Distribution of the Public Asset Portfolio, 1998-2017
ChartLab and SQL Console in ATSD
Data Source: Bank of Israel
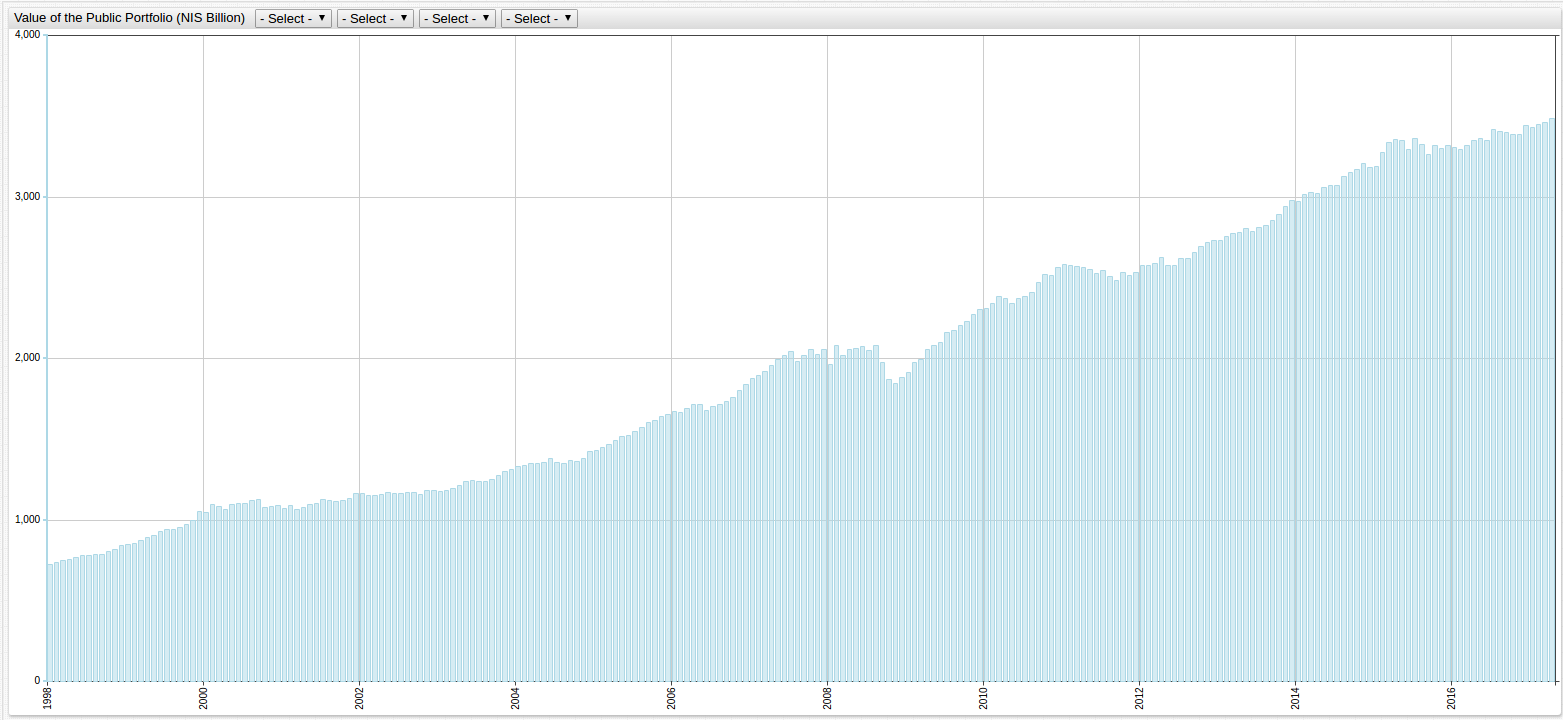
Value of the Public Portfolio (NIS Billion)

SELECT date_format(time, 'yyyy-MM') AS "Date", tv.value AS "Total Value (NIS Billion)"
  FROM "total_(nis_billion)" AS tv WHERE date_format(time, 'MM') = '01'
GROUP BY 'Date', tv.value
  ORDER BY 'Date'
| Date | Total Value (NIS Billion) |
|---|---|
| 1998-01 | 725 |
| 1999-01 | 847 |
| 2000-01 | 1048 |
| 2001-01 | 1074 |
| 2002-01 | 1162 |
| 2003-01 | 1177 |
| 2004-01 | 1331 |
| 2005-01 | 1433 |
| 2006-01 | 1675 |
| 2007-01 | 1878 |
| 2008-01 | 1960 |
| 2009-01 | 1916 |
| 2010-01 | 2312 |
| 2011-01 | 2581 |
| 2012-01 | 2574 |
| 2013-01 | 2730 |
| 2014-01 | 2974 |
| 2015-01 | 3190 |
| 2016-01 | 3306 |
| 2017-01 | 3429 |
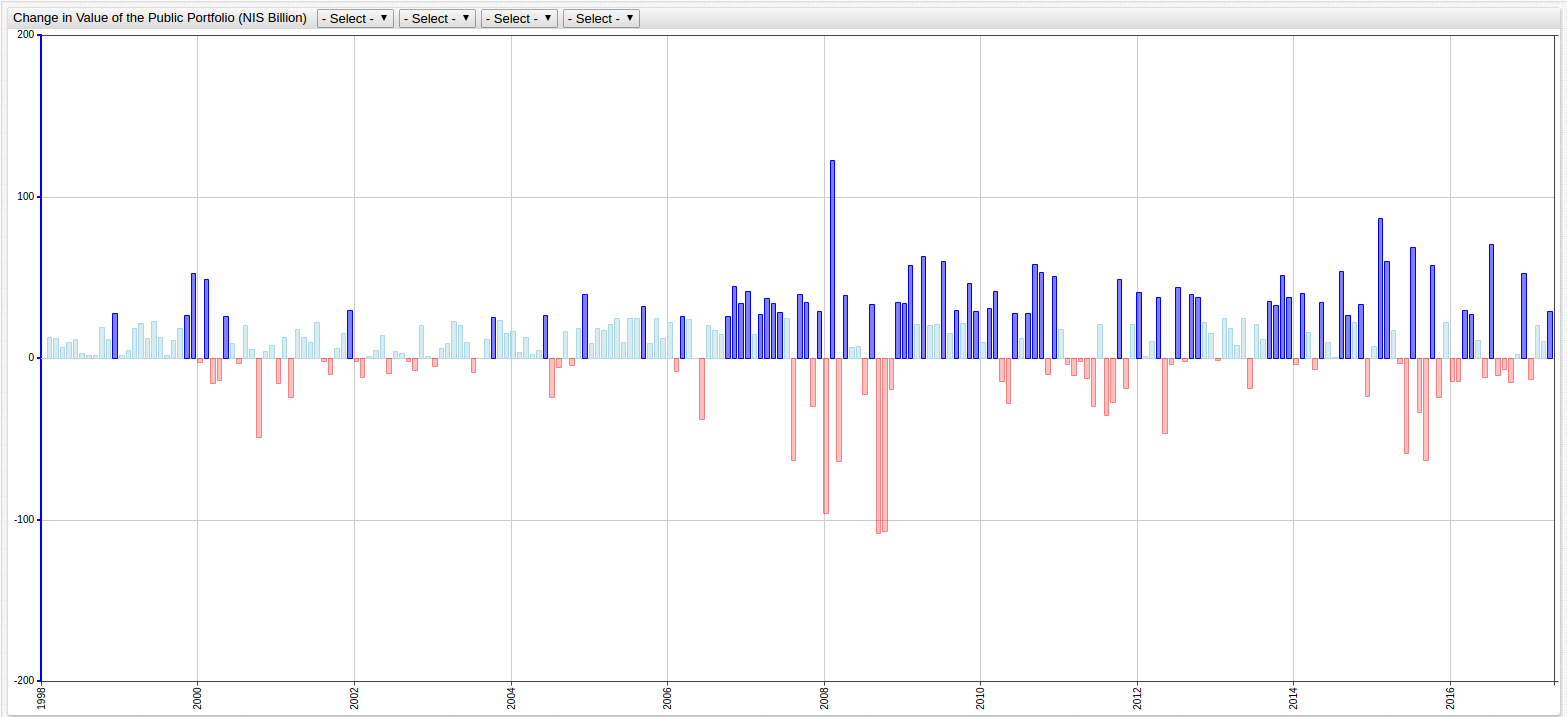
Months with negative growth are shown in red, and months with positive growth exceeding 25 billion NIS are shown in dark blue.
SELECT date_format(time, 'yyyy-MM') AS "Date", ROUND(tv.value, 1) AS "Total Value (NIS Billion)", ROUND((tv.value/3428.9)*100, 1) AS "Percent of Current Value", ROUND(tv.value - LAG(tv.value), 1) AS "Delta"
  FROM "total_(nis_billion)" AS tv WHERE date_format(time, 'MM') = '01'
GROUP BY 'Date', tv.value
  ORDER BY 'Date'
| Date    | Total Value (NIS Billion) | Percent of Current Value | Delta |
|---------|---------------------------|--------------------------|-------|
| 1998-01 | 725.1                     | 21.1                     | null  |
| 1999-01 | 846.6                     | 24.7                     | 121.5 |
| 2000-01 | 1047.9                    | 30.6                     | 201.3 |
| 2001-01 | 1074.1                    | 31.3                     | 26.2  |
| 2002-01 | 1162.3                    | 33.9                     | 88.2  |
| 2003-01 | 1177.4                    | 34.3                     | 15.1  |
| 2004-01 | 1331.1                    | 38.8                     | 153.7 |
| 2005-01 | 1432.8                    | 41.8                     | 101.7 |
| 2006-01 | 1674.7                    | 48.8                     | 241.9 |
| 2007-01 | 1878.2                    | 54.8                     | 203.5 |
| 2008-01 | 1959.8                    | 57.2                     | 81.6  |
| 2009-01 | 1916.4                    | 55.9                     | -43.4 |
| 2010-01 | 2311.9                    | 67.4                     | 395.5 |
| 2011-01 | 2581.2                    | 75.3                     | 269.3 |
| 2012-01 | 2574.5                    | 75.1                     | -6.7  |
| 2013-01 | 2730.4                    | 79.6                     | 155.9 |
| 2014-01 | 2974.3                    | 86.7                     | 243.9 |
| 2015-01 | 3189.5                    | 93                       | 215.2 |
| 2016-01 | 3305.5                    | 96.4                     | 116   |
| 2017-01 | 3428.9                    | 100                      | 123.4 |
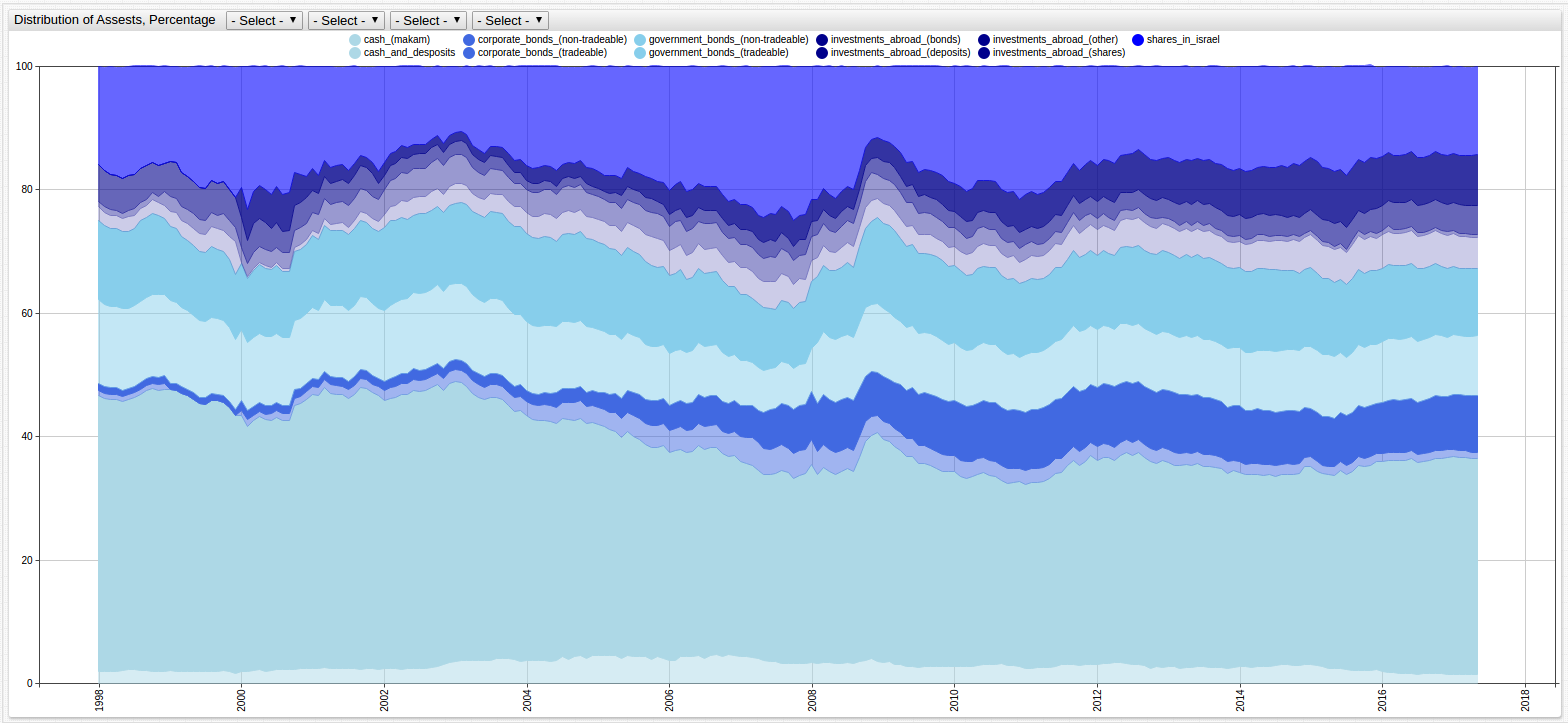
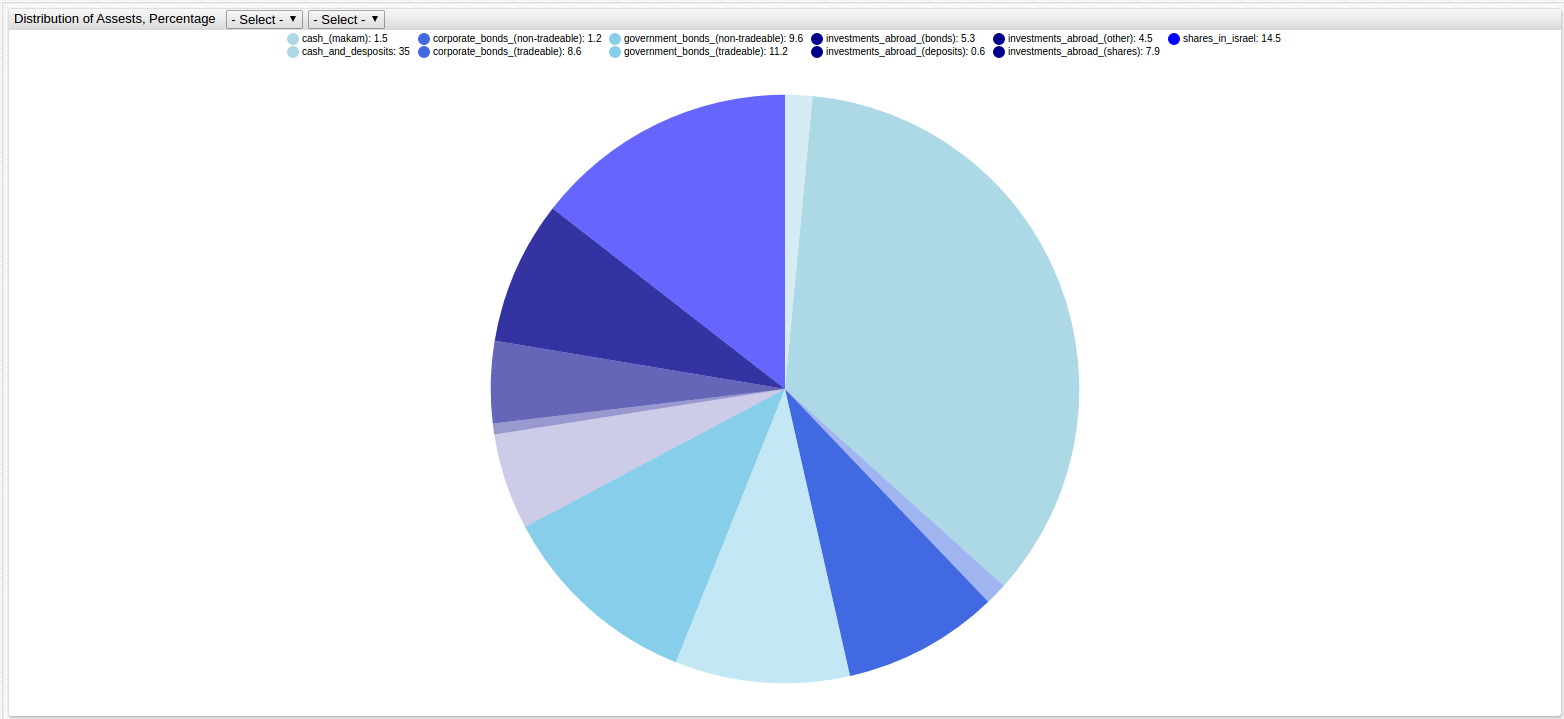
Distributions of Assets by Type (Percent)
SELECT date_format(time, 'MM-yyyy') AS "Date",  cd.value AS "Cash and Deposits", gbn.value AS "Government Bonds (Non-Tradeable)", gbt.value AS "Government Bonds (Tradeable)", cbn.value AS "Corporate Bonds (Non-Tradeable)", cbt.value AS "Corporate Bonds (Tradeable)", cm.value AS "Cash (Makam)", i.value AS "Shares in Israel", iad.value AS "Investments Abroad (Deposits)", iab.value AS "Investments Abroad (Bonds)", ias.value AS "Investments Abroad (Shares)", iao.value AS "Investments Abroad (Other)"
  FROM "cash_and_desposits" AS cd JOIN "government_bonds_(non-tradeable)" AS gbn JOIN "government_bonds_(tradeable)" AS gbt JOIN "corporate_bonds_(non-tradeable)" AS cbn JOIN "corporate_bonds_(tradeable)" AS cbt JOIN "cash_(makam)" AS cm JOIN "shares_in_israel" AS i JOIN "investments_abroad_(deposits)" AS iad JOIN "investments_abroad_(bonds)" AS iab JOIN "investments_abroad_(shares)" AS ias JOIN "investments_abroad_(other)" AS iao WHERE date_format(time, 'MM') = '01'
GROUP BY 'Date', cd.value, gbn.value, gbt.value, cbn.value, cbt.value, cm.value, i.value, iab.value, iad.value, ias.value, iao.value
  ORDER BY 'Date'
| Date | Cash and Deposits | Government Bonds (Non-Tradeable) | Government Bonds (Tradeable) | Corporate Bonds (Non-Tradeable) | Corporate Bonds (Tradeable) | Cash (Makam) | Shares in Israel | Investments Abroad (Deposits) | Investments Abroad (Bonds) | Investments Abroad (Shares) | Investments Abroad (Other) |
|---|---|---|---|---|---|---|---|---|---|---|---|
| 01-1998 | 44.7 | 13.5 | 12.9 | 0.8 | 1.2 | 2 | 15.9 | 0.9 | 2.2 | 0 | 5.9 |
| 01-1999 | 45.5 | 13.3 | 12 | 0 | 1.1 | 2.1 | 15.4 | 2.4 | 2.5 | 0 | 5.7 |
| 01-2000 | 41.6 | 11.5 | 10.7 | 0.8 | 1.5 | 1.9 | 19.6 | 2.4 | 0.3 | 4.9 | 4.8 |
| 01-2001 | 44.3 | 11.5 | 11.7 | 1.3 | 1.3 | 2.5 | 16.6 | 3 | 0.8 | 3.5 | 3.5 |
| 01-2002 | 43.4 | 11.5 | 13.4 | 1.6 | 1.5 | 2.5 | 15.6 | 4.1 | 2.1 | 2 | 2.3 |
| 01-2003 | 45.4 | 12.4 | 12.9 | 2 | 1.6 | 3.5 | 10.7 | 4.7 | 3.2 | 1.4 | 2.2 |
| 01-2004 | 39.6 | 11.2 | 14.2 | 2.3 | 1.8 | 3.8 | 16.3 | 3.8 | 3.4 | 2.3 | 1.5 |
| 01-2005 | 37.3 | 10.1 | 14.2 | 2.8 | 2.5 | 4.6 | 17 | 3.7 | 3.7 | 2.7 | 1.4 |
| 01-2006 | 33.7 | 8.5 | 12.6 | 3.6 | 4 | 3.7 | 20.1 | 4 | 4 | 3.9 | 1.9 |
| 01-2007 | 31.6 | 7.3 | 10.8 | 4 | 5 | 4.4 | 22.4 | 3.7 | 4.4 | 4 | 2.4 |
| 01-2008 | 32.1 | 6.9 | 10.8 | 4 | 7.9 | 3.4 | 21.6 | 3.9 | 3.5 | 3.5 | 2.4 |
| 01-2009 | 36.1 | 10.9 | 13.9 | 3 | 7.3 | 3.4 | 11.9 | 4.1 | 3.2 | 3.4 | 2.7 |
| 01-2010 | 31.6 | 9.3 | 12.5 | 2.6 | 9 | 2.7 | 19 | 3.1 | 3.1 | 4.6 | 2.6 |
| 01-2011 | 29.8 | 9.3 | 11.9 | 2.3 | 9.4 | 2.5 | 20.7 | 2.3 | 3.6 | 5.7 | 2.5 |
| 01-2012 | 33.1 | 9.4 | 12 | 2.2 | 9.6 | 3.1 | 16 | 1.8 | 4.2 | 5.8 | 2.8 |
| 01-2013 | 33.1 | 9.4 | 12.9 | 2.1 | 9.6 | 2.7 | 14.8 | 1.1 | 4.4 | 6.7 | 3.2 |
| 01-2014 | 31.5 | 9.4 | 13 | 1.7 | 9.1 | 2.7 | 16.6 | 0.9 | 4.3 | 7.4 | 3.4 |
| 01-2015 | 32.2 | 10.1 | 12.7 | 1.6 | 7.8 | 3 | 15 | 0.7 | 5.3 | 8.4 | 3.4 |
| 01-2016 | 33.9 | 9.9 | 11.9 | 1.3 | 8.3 | 2 | 14.5 | 0.8 | 5.4 | 7.9 | 4 |
| 01-2017 | 35.3 | 9.6 | 11.1 | 1.1 | 9 | 1.5 | 14 | 0.5 | 5.3 | 7.9 | 4.6 |