Calculating the Difference Between Consecutive Series Values
Purpose
ATSD has several methods to perform ad hoc calculations without modifying any underlying data. A common example is the computation of the difference between consecutive values for a given series.
This tutorial demonstrates such a calculation via three methods:
Dataset
The dataset in this tutorial is represented by:
- Entity
hetzner - Metric
outage-tickets - Series tags:
DC=07,DC=10, andDC=12
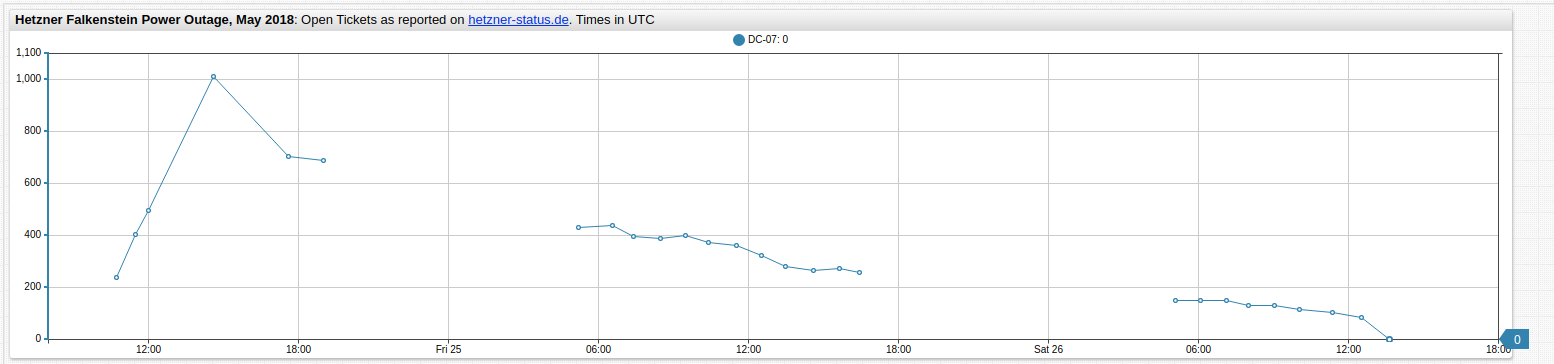
The outage-tickets metric measures the number of tickets open in the service provider support desk during a power outage incident.
For more information about the dataset, refer to Hetzner Outage, May 2018
SQL Console
SQL Console is a web-based interface to submit SQL queries to ATSD and display the results.
SELECT datetime, value AS "VALUE", (value - LAG(value)) AS "DIFF"
  FROM "outage-tickets"
WHERE entity = 'hetzner' AND tags.dc = '07'
  ORDER BY datetime
Compute the difference between consecutive values with the LAG function. When LAG encounters a non-existent sample, it returns null.
| datetime             | VALUE| DIFF |
|----------------------|------|------|
| 2018-05-24T10:43:00Z | 237  | null |
| 2018-05-24T11:29:00Z | 402  | 165  |
| 2018-05-24T12:00:00Z | 497  | 95   |
| 2018-05-24T14:36:00Z | 1013 | 516  |
| 2018-05-24T17:35:00Z | 704  | -309 |
| 2018-05-24T19:01:00Z | 690  | -14  |
| 2018-05-25T05:13:00Z | 429  | -261 |
| 2018-05-25T06:34:00Z | 437  | 8    |
| 2018-05-25T07:25:00Z | 398  | -39  |
| 2018-05-25T08:29:00Z | 390  | -8   |
| 2018-05-25T09:28:00Z | 401  | 11   |
| 2018-05-25T10:25:00Z | 374  | -27  |
| 2018-05-25T11:30:00Z | 362  | -12  |
| 2018-05-25T12:30:00Z | 324  | -38  |
| 2018-05-25T13:29:00Z | 279  | -45  |
| 2018-05-25T14:36:00Z | 266  | -13  |
| 2018-05-25T15:38:00Z | 272  | 6    |
| 2018-05-25T16:27:00Z | 256  | -16  |
| 2018-05-26T05:05:00Z | 151  | -105 |
| 2018-05-26T06:04:00Z | 149  | -2   |
| 2018-05-26T07:06:00Z | 149  | 0    |
| 2018-05-26T08:00:00Z | 130  | -19  |
| 2018-05-26T09:03:00Z | 131  | 1    |
| 2018-05-26T10:02:00Z | 117  | -14  |
| 2018-05-26T11:22:00Z | 105  | -12  |
| 2018-05-26T12:31:00Z | 86   | -19  |
| 2018-05-26T13:38:00Z | 0    | -86  |
To filter data for another series tag, modify the tags.dc condition in the WHERE clause.
Series Query
The series: query API endpoint allows you to query time series records for specified metric, entity, tag, and interval filters.
[{
    "startDate": "2018-05-24T00:00:00Z",
    "endDate": "2018-05-27T00:00:00Z",
    "entity": "hetzner",
    "metric": "outage-tickets",
    "tags": {"dc" : "07"}
}]
[{"entity":"hetzner","metric":"outage-tickets","tags":{"dc":"07"},"type":"HISTORY","aggregate":{"type":"DETAIL"},"data":[
{"d":"2018-05-24T10:43:00","v":237.0},
{"d":"2018-05-24T11:29:00","v":402.0},
{"d":"2018-05-24T12:00:00","v":497.0},
{"d":"2018-05-24T14:36:00","v":1013.0},
{"d":"2018-05-24T17:35:00","v":704.0},
{"d":"2018-05-24T19:01:00","v":690.0},
{"d":"2018-05-25T05:13:00","v":429.0},
{"d":"2018-05-25T06:34:00","v":437.0},
{"d":"2018-05-25T07:25:00","v":398.0},
{"d":"2018-05-25T08:29:00","v":390.0},
{"d":"2018-05-25T09:28:00","v":401.0},
{"d":"2018-05-25T10:25:00","v":374.0},
{"d":"2018-05-25T11:30:00","v":362.0},
{"d":"2018-05-25T12:30:00","v":324.0},
{"d":"2018-05-25T13:29:00","v":279.0},
{"d":"2018-05-25T14:36:00","v":266.0},
{"d":"2018-05-25T15:38:00","v":272.0},
{"d":"2018-05-25T16:27:00","v":256.0},
{"d":"2018-05-26T05:05:00","v":151.0},
{"d":"2018-05-26T06:04:00","v":149.0},
{"d":"2018-05-26T07:06:00","v":149.0},
{"d":"2018-05-26T08:00:00","v":130.0},
{"d":"2018-05-26T09:03:00","v":131.0},
{"d":"2018-05-26T10:02:00","v":117.0},
{"d":"2018-05-26T11:22:00","v":105.0},
{"d":"2018-05-26T12:31:00","v":86.0},
{"d":"2018-05-26T13:38:00","v":0.0}]}]
Include rate processor to compute the difference between consecutive samples per unit of time, or rate period.
"rate": {
  "period": {"count": 1, "unit": "MINUTE"},
  "counter": false
}
Omit the period parameter, or set its count to zero, to return the difference between consecutive samples.
[{
    "startDate": "2018-05-20T00:00:00Z",
    "endDate": "2018-05-27T00:00:00Z",
    "entity": "hetzner",
    "metric": "outage-tickets",
    "tags": {"dc" : "07"},
    "rate": {
      "counter": false
     }
}]
[{"entity":"hetzner","metric":"outage-tickets","tags":{"dc":"07"},"type":"HISTORY","aggregate":{"type":"DETAIL"},"rate":{"period":{"count":0,"unit":"SECOND"},"counter":false,"order":0},"data":[
{"d":"2018-05-24T11:29:00","v":165.0},
{"d":"2018-05-24T12:00:00","v":95.0},
{"d":"2018-05-24T14:36:00","v":516.0},
{"d":"2018-05-24T17:35:00","v":-309.0},
{"d":"2018-05-24T19:01:00","v":-14.0},
{"d":"2018-05-25T05:13:00","v":-261.0},
{"d":"2018-05-25T06:34:00","v":8.0},
{"d":"2018-05-25T07:25:00","v":-39.0},
{"d":"2018-05-25T08:29:00","v":-8.0},
{"d":"2018-05-25T09:28:00","v":11.0},
{"d":"2018-05-25T10:25:00","v":-27.0},
{"d":"2018-05-25T11:30:00","v":-12.0},
{"d":"2018-05-25T12:30:00","v":-38.0},
{"d":"2018-05-25T13:29:00","v":-45.0},
{"d":"2018-05-25T14:36:00","v":-13.0},
{"d":"2018-05-25T15:38:00","v":6.0},
{"d":"2018-05-25T16:27:00","v":-16.0},
{"d":"2018-05-26T05:05:00","v":-105.0},
{"d":"2018-05-26T06:04:00","v":-2.0},
{"d":"2018-05-26T07:06:00","v":0.0},
{"d":"2018-05-26T08:00:00","v":-19.0},
{"d":"2018-05-26T09:03:00","v":1.0},
{"d":"2018-05-26T10:02:00","v":-14.0},
{"d":"2018-05-26T11:22:00","v":-12.0},
{"d":"2018-05-26T12:31:00","v":-19.0},
{"d":"2018-05-26T13:38:00","v":-86.0}]}]
Charts Functions
Charts services provide several alternatives to visualize raw data and perform delta calculations in the browser.
The outage-tickets dataset visualized in ChartLab:

To calculate and display the difference between consecutive values, there are three options.
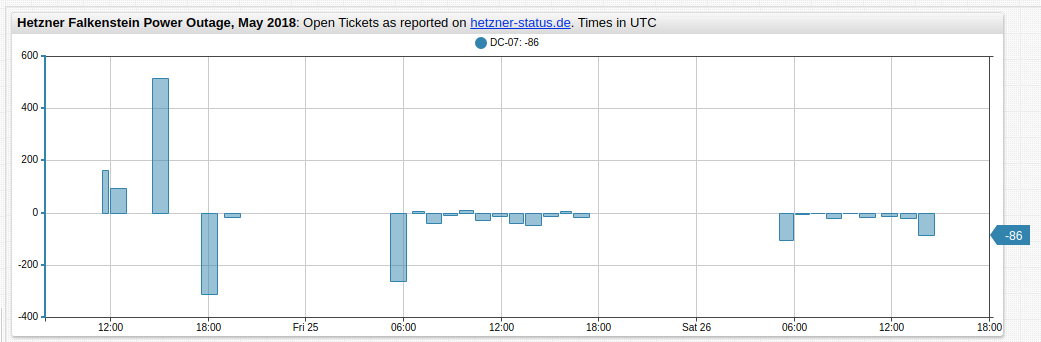
Rate Setting
Use the rate setting to calculate the difference between the current data sample and the previous sample and return this amount in place of the current data sample.
[series]
  rate = 0 minute
  rate-counter = false
The rate setting defines the period to prorate the value change. The underlying formula is shown here:
Sample Value = (value1 - value0) / (time1 - time0) * rate
- value1: current value
- value0: previous value
- time1: current value in Unix milliseconds
- time0: previous value in Unix milliseconds
rate: period in Unix milliseconds
For example, rate = 1 minute calculates the change in value (first derivative) per unit of time equal to one minute.
If the rate period is zero, the formula is:
Sample Value = value1 - value0
The rate-counter parameter ignores negative differences when set to true.
The visualization created by the rate setting configuration is shown below.
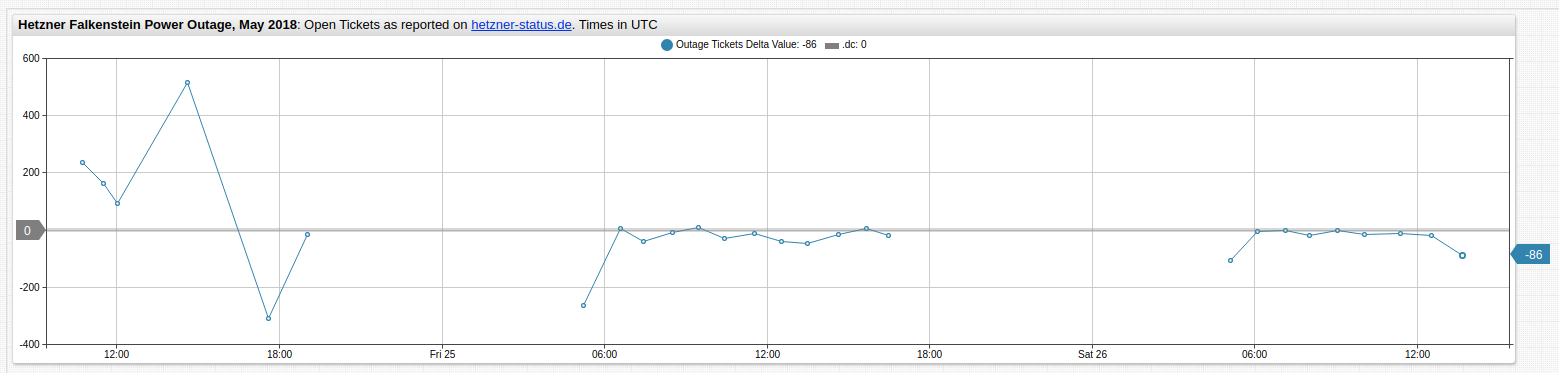
Create Derived Series Using replace-value
Use value and previousValue placeholders in the replace-value function.
[series]
  replace-value = value - previousValue
Derived Series Using Aliases
Create a derived series using the previous() function. Hide both the raw series and the derived series. Create a third series and calculate the difference in consecutive values for each timestamp by referencing values of the hidden series.
/* raw series data */
[series]
 alias = raw
 display = false

/* series where each value is equal to previous value */
[series]
 value = previous('raw')
 alias = prev
 display = false

/* derived series that calculated the delta */
[series]
 value = value('raw') - value('prev')
Both methods create the same visualization, shown below.
For more function examples, view Charts Functions.