Downsampling
Overview
Downsampling transformation reduces time series density by filtering out sequentially duplicate samples from a response.
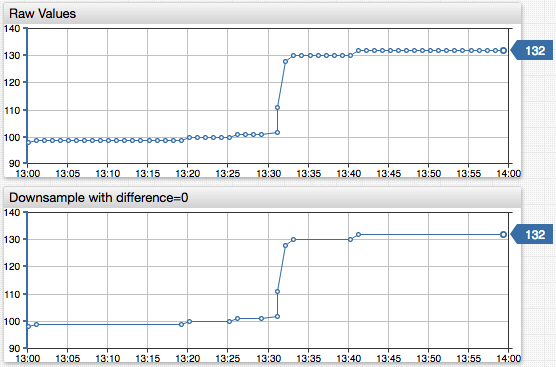
Basic Example
"downsample": {
  "difference": 0
}
The configuration example excludes samples that are equal to the previous and next values.
Advanced Example
"downsample": {
  "algorithm": "INTERPOLATE",
  "difference": 10
}
The configuration excludes samples that are within ±10 of an interpolated value.
Parameters
| Name | Type | Description |
|---|---|---|
algorithm | string | Downsampling algorithm determines which values to discard as duplicate. Possible values: DETAIL or INTERPOLATE.Default: DETAIL. |
difference | number | The sample is classified as duplicate if the current value deviates by more than the specified difference, in absolute terms, from the estimated value produced by downsampling algorithm. Minimum value: 0.Default: 0. |
ratio | number | The sample is classified as duplicate if the ratio of the current value and the value produced by downsampling algorithm or the inverse exceed the specified ratio. Minimum value: 1. Default: none. |
gap | object | Maximum distance between subsequent samples in the transformed series. Specified as count and time unit. Default: none. |
TIP
The difference and ratio parameters cannot be specified simultaneously.
Gap
If the gap parameter is specified, and the time distance between the current and last returned sample exceeds the gap, the current sample is always included in the result.
| Name | Type | Description |
|---|---|---|
count | number | Number of time units. |
unit | string | Time unit, for example MINUTE. |
"gap": {"count": 2, "unit": "MINUTE"}
The gap parameter prevents a time series from becoming too sparse as a result of downsampling.
Processing
The samples in the input series are evaluated sequentially in ascending time order.
The following samples are always included in the result, even if classified as duplicate by the downsampling algorithm.
- The first and the last samples.
- Annotated samples: Sample with a non-empty text field.
- Samples with
NaNvalue. - Samples whose previous or next sample value is
NaN.
The remaining samples are checked by the algorithm which excludes them from the results if classified as duplicates and the provided gap condition is satisfied.
If the query retrieves versioned series, the algorithm evaluates the latest version. If the latest version is classified as a duplicate, then all versions with the same timestamp are classified as such.
Algorithm
The DETAIL and INTERPOLATE algorithms use different formulas to classify samples as duplicates.
This documentation references the following keywords and definitions:
sample: Current evaluated sample.last_sample: Last returned series sample included in the result.next_sample: Sample following currentsample.
The timestamps of these samples are time, last_time, next_time, and their values are value, last_value, next_value.
In addition, the INTERPOLATE algorithm performs linear interpolation between the last_sample and the next_sample to calculate interpolated_value with a timestamp equal to time.
Ratio Check
When the ratio parameter is set, the algorithms calculate several multiples.
DETAILalgorithm:value/last_valuelast_value/valuevalue/next_valuenext_value/value
INTERPOLATEalgorithm:value/interpolated_valueinterpolated_value/value
The sample is classified as a duplicate if all multiples do not exceed the specified ratio.
Note
To avoid division by zero, the algorithm compares x/ratio > y instead of x/y > ratio.
Difference Check
If the ratio parameter is not set, the algorithm uses absolute difference to classify the sample. If the difference parameter is not set, it defaults to 0. The algorithm classifies the sample as duplicate if the following expressions return true.
DETAILalgorithm:
abs(value - last_value) <= difference AND abs(value - next_value) <= difference
If the difference is 0, the sample is a duplicate if it is equal both to the last and the next value:
value == last_value AND value == next_value
INTERPOLATEalgorithm:
abs(value - interpolated_value) <= difference
Examples
Default Downsampling
"downsample": {}
Result:
|       | input  | downsampled |
| time  | series |   series    |
|-------|--------|-------------|
| 07:00 |   1    |      1      | first sample
| 08:00 |   1    |      -      |
| 09:00 |   1    |      -      |
| 10:00 |   1    |      -      |
| 11:00 |   1    |      -      |
| 12:00 |   1    |      1      | differs from next sample
| 13:00 |   2    |      2      | differs from last returned sample
| 14:00 |   2    |      -      |
| 15:00 |   2    |      2      | differs from next sample
| 16:00 |   3    |      3      | differs from last returned sample
| 17:00 |   3    |      -      |
| 18:00 |   3    |      -      |
| 19:00 |   3    |      -      |
| 20:00 |   3    |      3      | last sample
DETAIL downsampling with difference and gap
"downsample": {
    "difference": 1.5,
    "gap": {"count": 4, "unit": "HOUR"}
}
Result:
|       | input  | downsampled |
| time  | series |   series    |
|-------|--------|-------------|
| 07:00 |   1    |      1      | first sample
| 08:00 |   1    |      -      |
| 09:00 |   1    |      -      |
| 10:00 |   1    |      -      |
| 11:00 |   1    |      -      |
| 12:00 |   1    |      1      | time gap with last returned sample exceeds 4 hours
| 13:00 |   2    |      -      |
| 14:00 |   2    |      -      |
| 15:00 |   2    |      -      |
| 16:00 |   3    |      3      | differs from last returned sample (1.0 at 12:00) by 2.0
| 17:00 |   3    |      -      |
| 18:00 |   3    |      -      |
| 19:00 |   3    |      -      |
| 20:00 |   3    |      3      | last sample
INTERPOLATE downsampling
"downsample": {
    "algorithm": "INTERPOLATE"
}
Result:
|       | input  | downsampled |
| time  | series |   series    |
|-------|--------|-------------|
| 07:00 |   1    |      1      | first sample
| 08:00 |   3    |      -      |
| 09:00 |   5    |      -      |
| 10:00 |   7    |      -      |
| 11:00 |   9    |      9      | last sample
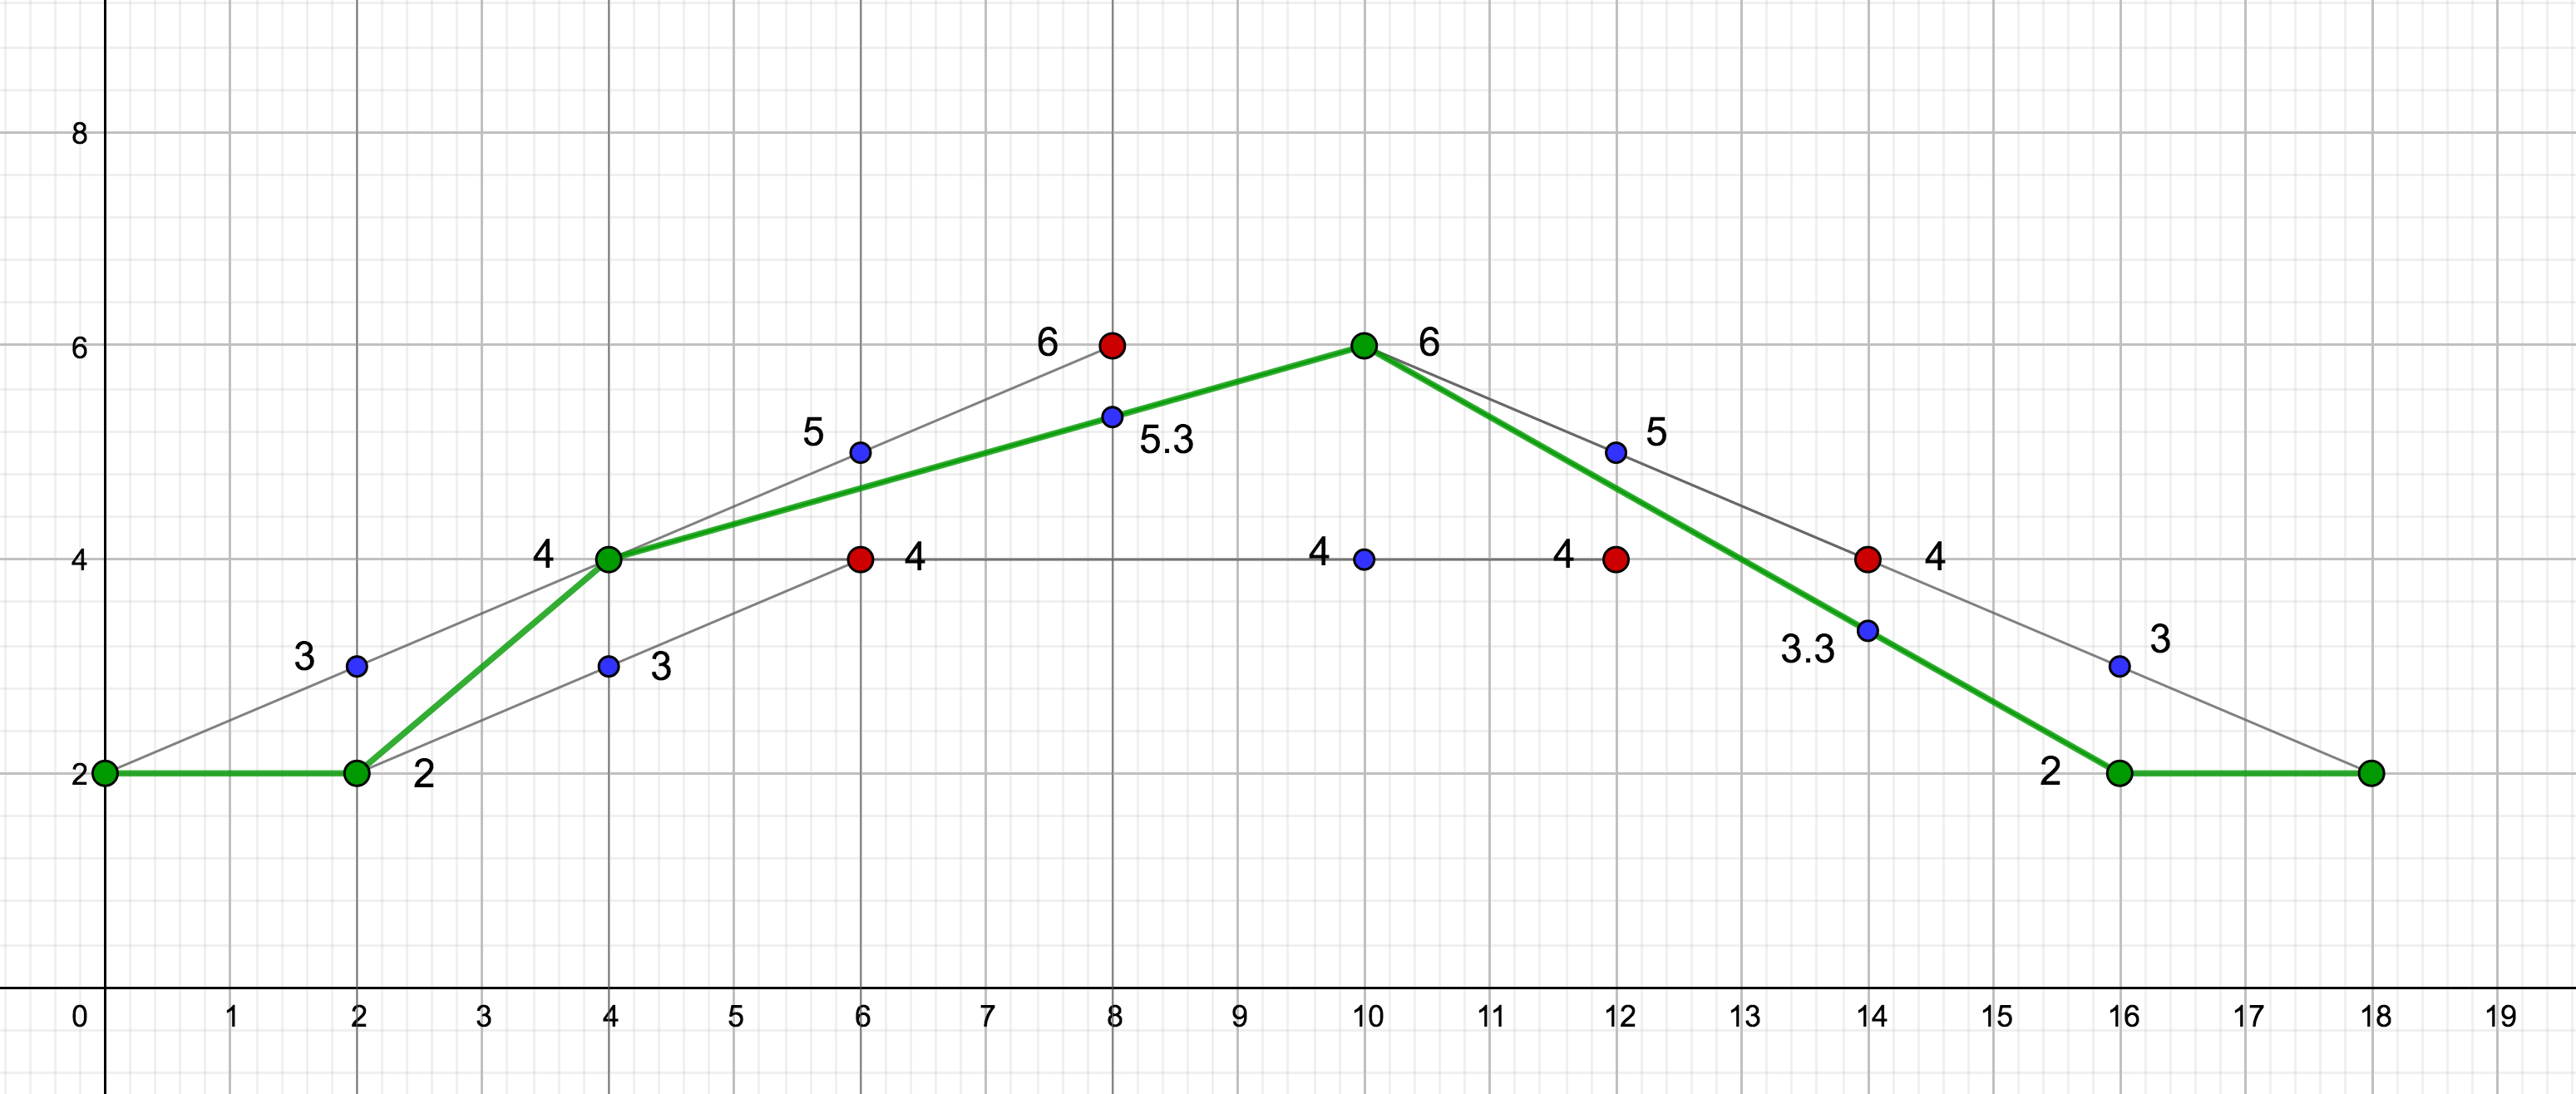
INTERPOLATE downsampling with ratio
"downsample": {
    "algorithm": "INTERPOLATE",
    "ratio": 1.25
}
Result:
|       | input  | downsampled | interpolated |       |
| time  | series |   series    |   value      | ratio |
|-------|--------|-------------|----------------------|
|   00  |   2    |      2      |      -       |   -   | first sample
|   02  |   2    |      2      |      3       | 1.50  | ratio exceeds threshold
|   04  |   4    |      4      |      3       | 1.30  | ratio exceeds threshold
|   06  |   4    |      -      |      5       | 1.25  |
|   08  |   6    |      -      |     5.3      | 1.13  |
|   10  |   6    |      6      |      4       | 1.50  | ratio exceeds threshold
|   12  |   4    |      -      |      5       | 1.25  |
|   14  |   4    |      -      |     3.3      | 1.21  |
|   16  |   2    |      2      |      3       | 1.50  | ratio exceeds threshold
|   18  |   2    |      2      |      -       |   -   | last sample
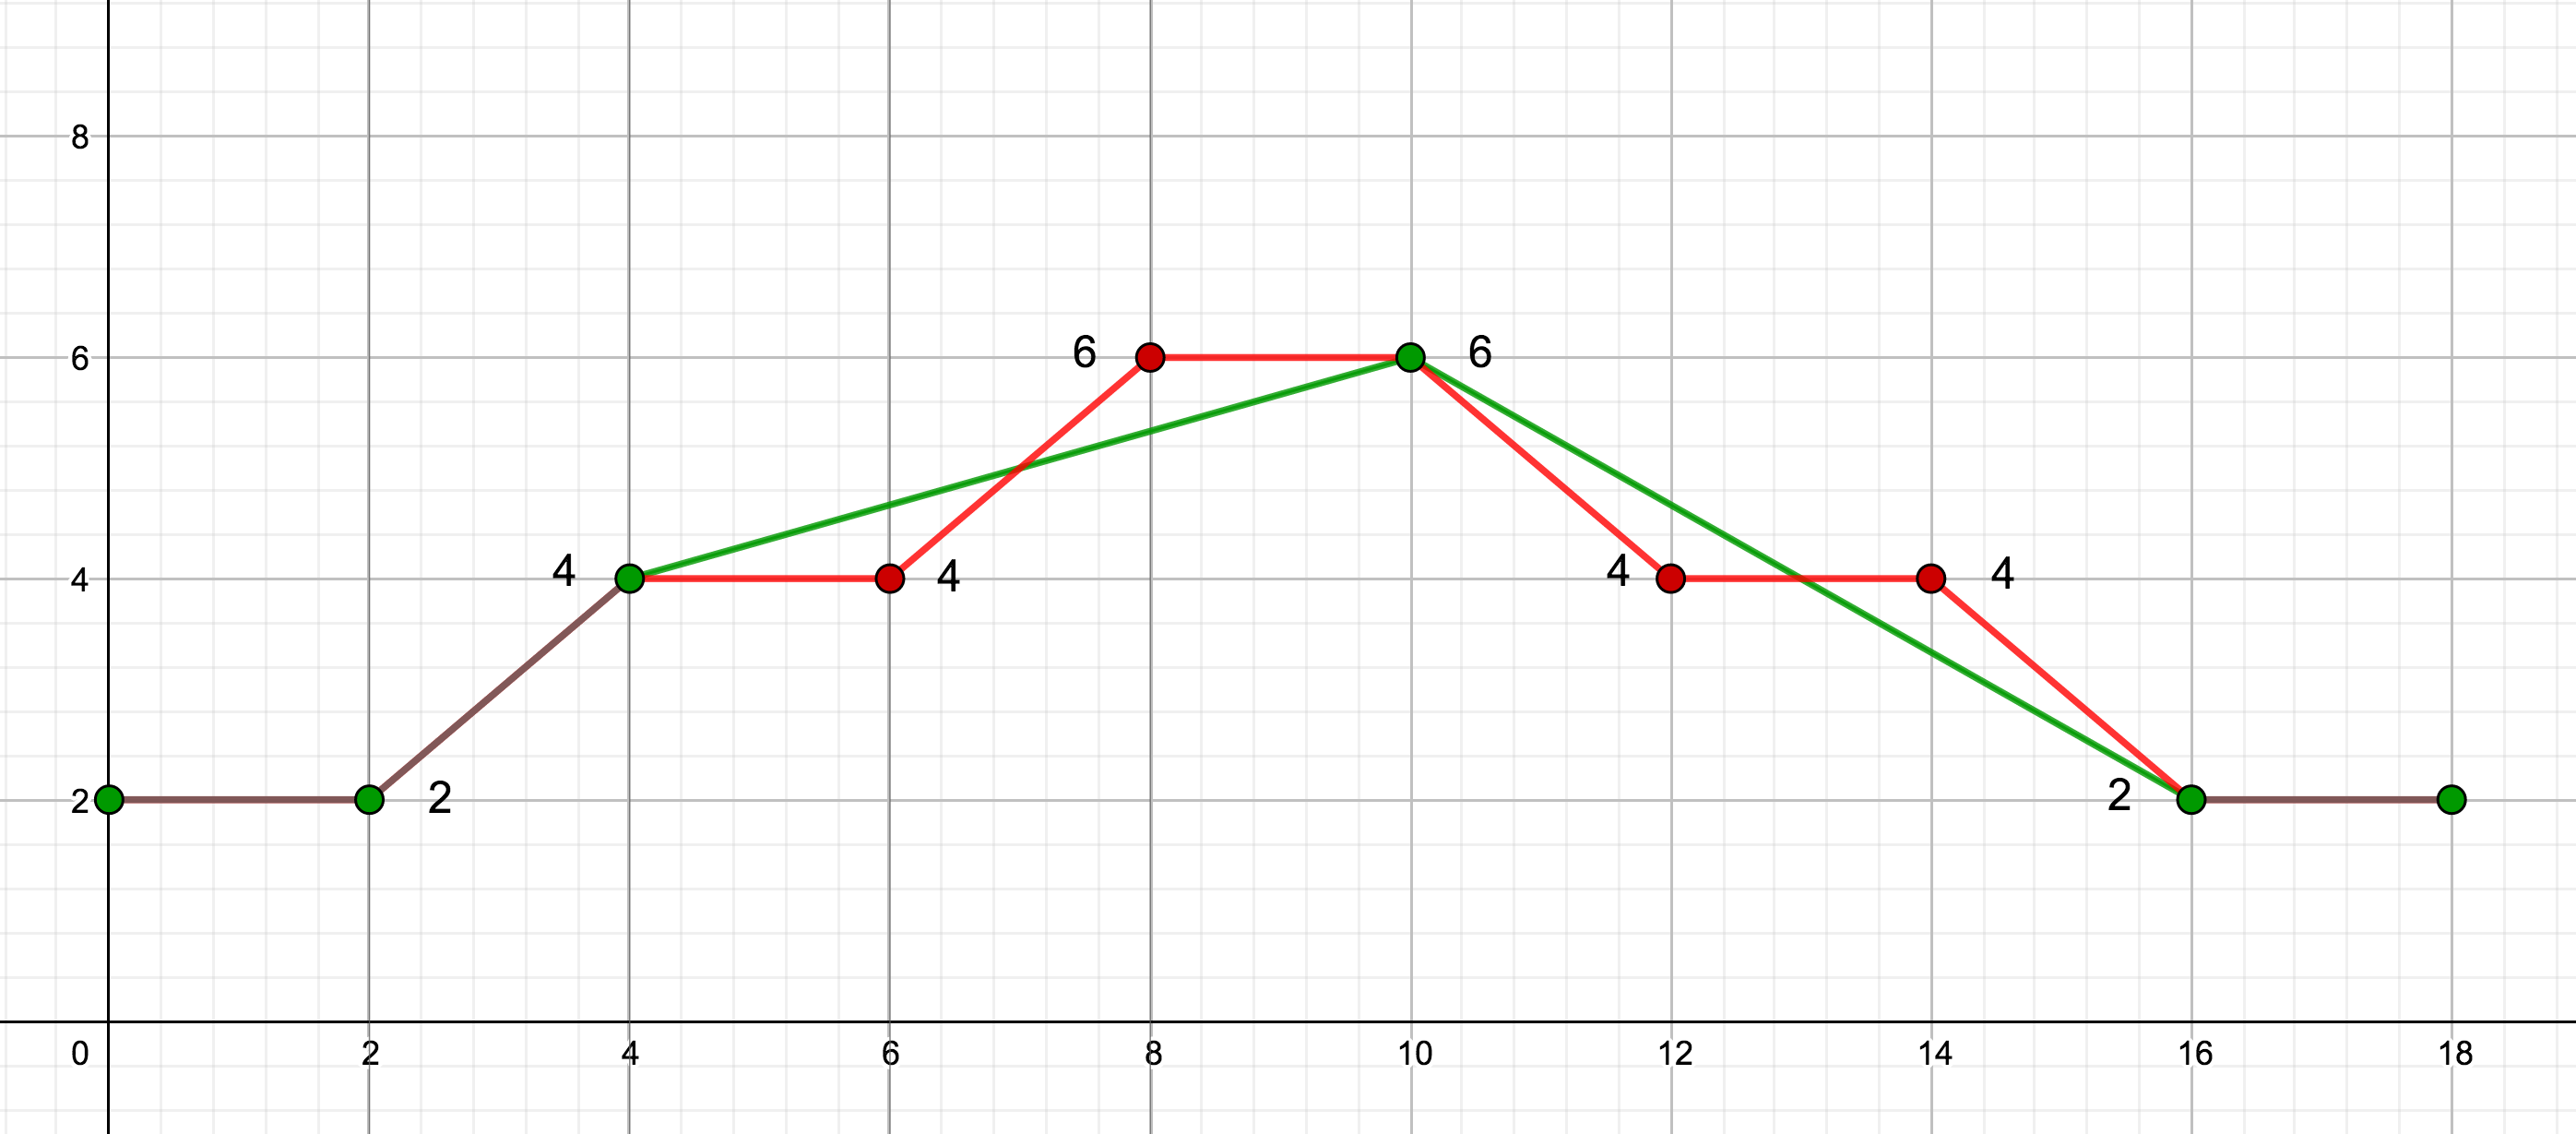
Charts of the input and downsampled series are provided below. The input series is colored red, the downsampled series is colored green.
The chart illustrates how the INTERPOLATE algorithm calculates interpolated values. Interpolated values are colored blue.