Rule Engine
The rule engine automates repetitive tasks based on real-time statistical analysis of incoming data.
Such tasks include triggering an outgoing webhook, executing a Python script, sending an email/Slack alert, or generating derived statistics.
The engine evaluates incoming series, message, and property commands and executes response actions when appropriate:
IF condition THEN action-1 ... action-N
Example
IF percentile(75) > 300 THEN send_message_to_slack
A rule condition can operate on a single metric or correlate multiple metrics using value, database, and rule functions.
max() > 5 && value('temperature') > 50
avg() > 75 && !rule_open('backup_active')
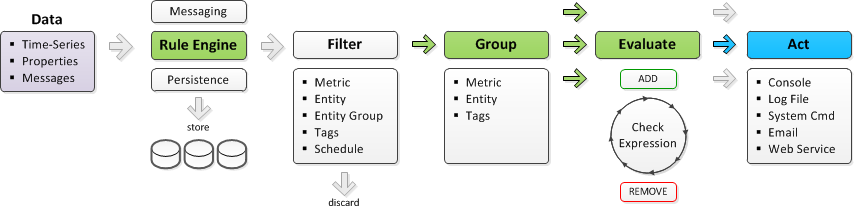
Processing Pipeline
The incoming data is consumed by the rule engine independently of the persistence path.
The data is maintained in windows which are in-memory structures initialized for each unique combination of metric, entity, and grouping tags extracted from incoming commands.

The processing pipeline consists of the following stages:
- Filtering
- Grouping
- Evaluating Condition
- Executing Actions
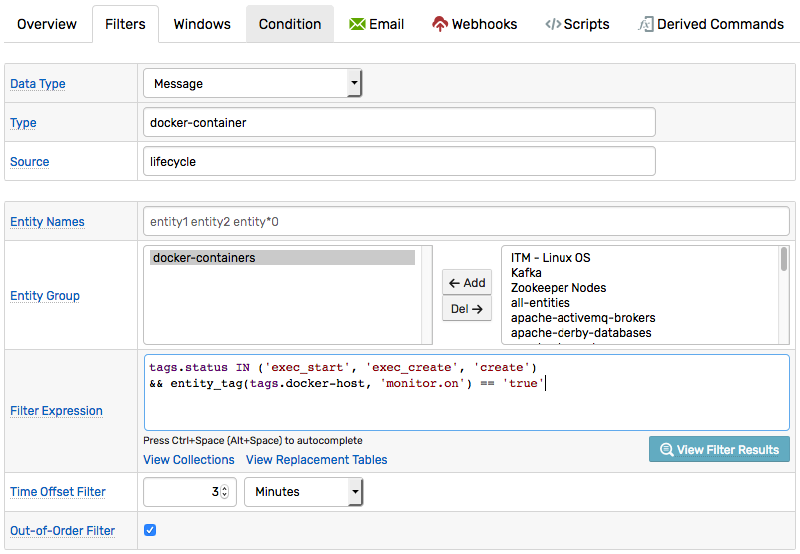
Filtering
The incoming data samples are processed by a chain of filters prior to the grouping stage. Such filters include:
Input Filter. All samples are discarded if the Settings > Input Settings > Rule Engine option is disabled.
Status Filter. Samples are discarded for disabled metrics and entities.
Rule Filter accepts data that satisfies the metric, entity, and tag filters specified in the rule.
Grouping
After passing through the filters, each sample is allocated to a matching window grouped by metric, entity, and optional tags. Each window maintains its own array of data samples in working memory.
The commands can be associated with windows in a 1-to-1 fashion by enabling the All Tags setting or by enumerating all tags as the grouping tags.

If the Group by Entity option is cleared, the entity field is ignored for grouping purposes and the window is grouped only by metric and tags.
The rule engine supports two types of windows:
Count-based windows accumulate up to the specified number of samples. The samples are sorted by command timestamp, with the most recent command placed at the end of the array. When the window reaches the limit, the first sample with the earliest timestamp is removed from the window to free up space for an incoming sample.
Time-based windows store samples that are timestamped within the specified interval of time. The start time of time-based windows is continuously updated. Old records are automatically removed from the window once they are outside of the time range.
Condition Checking
The rule engine evaluates the condition each time a new sample is added or an expired samples is removed from the window.
Condition example:
avg() > 80
Response actions are triggered based on the condition result: true or false.
Window Status
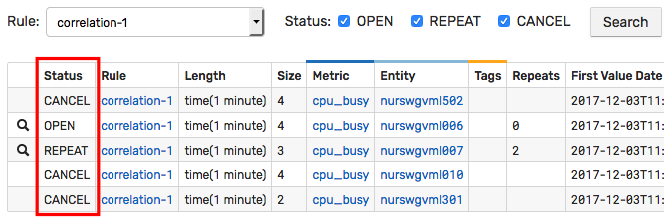
Windows are stateful. When the condition for a given window changes from false to true, the window status changes from CANCEL to OPEN.
On subsequent true evaluations, the status transitions to REPEAT.
When the condition becomes false, the window status is reverted to CANCEL.
The current window status is displayed on the Alerts > Rule Windows page.
Windows are updated when the commands enter or exit the windows. Scheduled rules that are checked at a regular interval, regardless of commands, can be constructed using the built-in timer metrics.
Actions
Actions are triggered on window status changes, for example when the window becomes OPEN or on every N-th REPEAT occurrence.
Supported response actions:
Actions are configured and executed independently, for example a daily email alert can be combined with hourly chat notifications and continuous logging on all repeat occurrences.
Each action type implements a dedicated thread pool to isolate slow executions from other actions triggered by the same rule. The pool executes pending actions in the order received.
To prioritize actions initiated by a particular rule, enable the Instant Action option on the Windows tab in which case the action is executed without going through the queue.
Correlation
Each rule evaluates data received for only one specified metric. To create conditions that check values for multiple metrics, use value, database, and rule functions.
- Value functions:
percentile(95) > 80 && values('metric2') != 0
- Database functions:
percentile(95) > 80 && db_statistic('max', '1 hour', 'metric2') < 10*1024
- Rule functions:
percentile(95) > 80 && rule_open('inside_temperature_check')
Developing Rules
Rules can be considered software programs in their own right and as such involve initial development, testing, documentation and maintenance efforts.
To minimize the number of rules with manual thresholds, the rule engine in ATSD provides the following capabilities:
- Condition overrides.
- Comparison of windows with different lengths.
- Automated thresholds.
Manual Thresholds
Thresholds can be set manually which requires some trial and error to determine a level that strikes a balance between false positives and missed alerts.
value > 90
Since a single baseline cannot handle all edge cases, the Overrides can be used to enumerate exceptions.
To reduce unnecessary alerts, apply averaging functions and increase window durations.
avg() > 90
To reduce distortions caused by a small number of outliers, use percentiles instead of averages.
percentile(75) > 90
Alternatively, use the minimum or a low percentile function with the reversed comparator to check that all samples in the window exceed the threshold. This is equivalent to checking that the last N consecutive samples are above the threshold.
// all samples are above 90
min() > 90
// only 10% of the smallest samples are below 90
percentile(10) >= 90
Deviation Thresholds
Short-term anomalies can be spotted by comparing statistical functions for different overlapping intervals.
The condition below activates an alert if the 5-minute average exceeds the 1-hour average by more than 20 and by more than 10%.
avg('5 minute') - avg() > 20 && avg('5 minute') / avg() > 1.1
Forecast Thresholds
The forecast function retrieves a precalculated forecast for the current series. The forecast object contains fields that can be compared with the current statistics, for example, to raise an alert if the moving average deviates from the expected value by more than the specified threshold.
# forecast() returns an object with fields and methods
abs(avg() - forecast().interpolated) > 25
For convenience the actual value can be compared with the forecast range.
forecast().violates(avg(), 25)
Alternatively, the forecast_deviation function can be called to compare the actual and expected values as a ratio of the standard deviation.
abs(forecast_deviation(avg())) > 3.0
Correlation Thresholds
In cases where the analyzed metric is related to another metric, use the database functions to identify abnormal behavior in both metrics.
The primary metric is expected to be below 50 as long as the second metric remains below 100. Otherwise, an alert is raised.
avg() > 50 && db_statistic('avg', '1 hour', 'page_views_per_minute') < 100
The same condition can be generalized with a ratio as well.
avg() / db_statistic('avg', '1 hour', 'page_views_per_minute') > 2
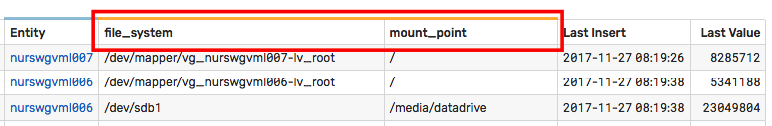
As an alternative, use the value() function to access the last value for metrics submitted within the same series command or parsed from the same row in CSV files.
value > 75 && value('page_views_per_minute') < 1000
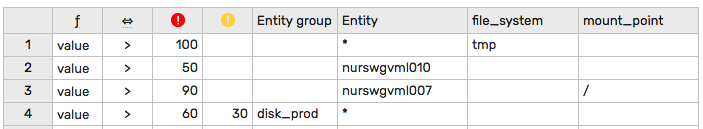
Overrides
The default baseline can be adjusted for particular series using the Overrides table.
Scheduled Rules
To check conditions on a fixed schedule, use the built-in timer_ metrics such as timer_1h which are generated by the database internally.
// Active on Thursdays between [06:00-07:00) and [15:00-16:00)
now.day_of_week == 'Thursday'
  && now.hourOfDay = 6 && now.hourOfDay = 15
  && /* remaining checks */
Alert Storms
To prevent repeat notifications when the compared value oscillates around the threshold, make the threshold conditional upon the window status. Once the window becomes open, the threshold is adjusted to cancel the alert only after a substantial change in the compared value.
/*
  Window opens when the value exceeds 80.
  Thereafter the value needs to drop below 70 for the window to cancel.
*/
value >= before_status == 'CANCEL' ? 80 : 70
Alert Severity
Severity is a measure of criticality assigned to alerts generated by the rule. The severity level ranges between NORMAL and FATAL and is specified on the Logging tab in the rule editor.
If an alert is raised by a condition defined in the Overrides table, its severity supersedes the default severity.
In rules operating on message commands, the alert severity can be inherited from the severity field of the underlying message.
To enable this behavior, set Severity on the Logging tab to unknown.
Complex Rules
In cases that involve processing of large volumes of historical data, use Scheduled SQL queries to analyze the data.
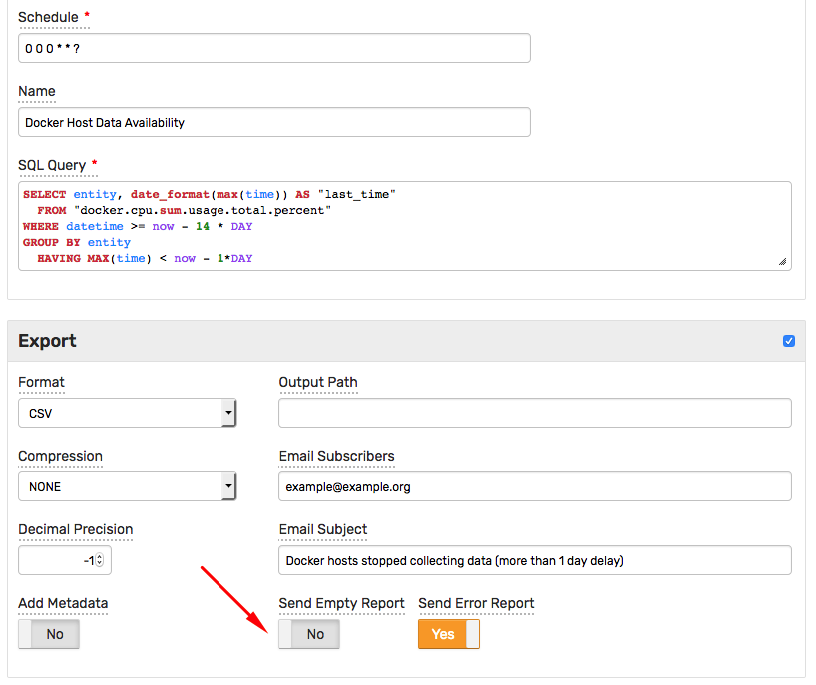
To trigger an email notification from an SQL query, use WHERE and HAVING filters to develop a query that returns no rows if the situation is normal.
SELECT entity, tags, percentile(90, value) FROM page_views
  WHERE datetime >= current_day
  GROUP BY entity, tags, period(1 DAY)
HAVING percentile(90, value) > 1000
-- HAVING condition acts as a rule filter
- Set Send Empty Report parameter to
No. - Specify triggers such as an email notification or a file export.
As a result, the query triggers actions only when it returns at least one row.
Monitoring
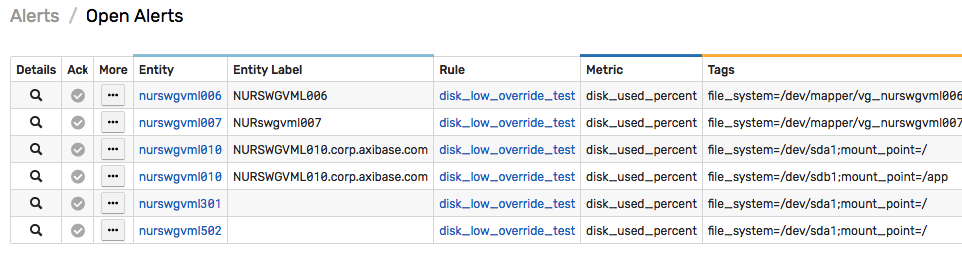
Open Alerts
Open alerts are displayed on the Alerts > Open Alerts page and can be retrieved with /alert/query Data API query and incorporated into portals using the Alert Table widget.
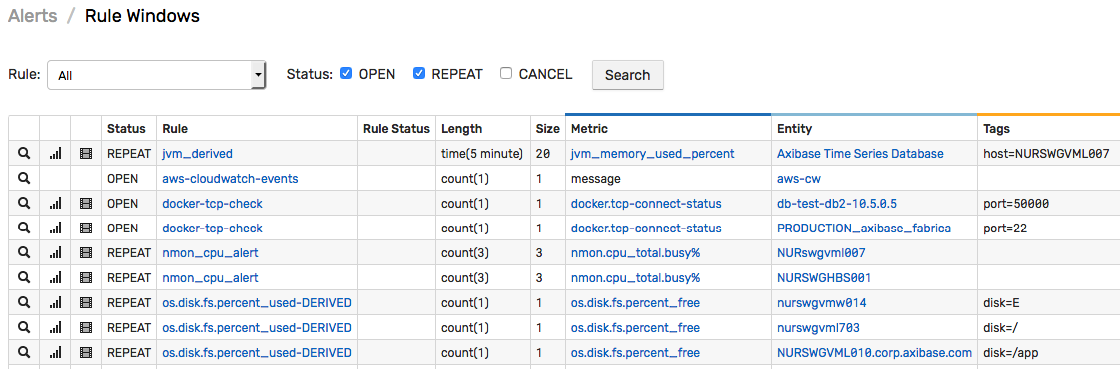
Rule Windows
Rule windows are initialized in memory and are displayed on the Alerts > Rule Windows page. If no windows are present for the given rule, check that the rule is enabled and that data is not discarded by one of the filters.
Rule Errors
Rule Errors can occur in case of invalid or malformed expressions. The Alerts > Rule Errors page contains the list of most recent errors as well as the relevant context and the command details. The errors are also logged as messages by entity atsd with type rule-error and source rule-engine.
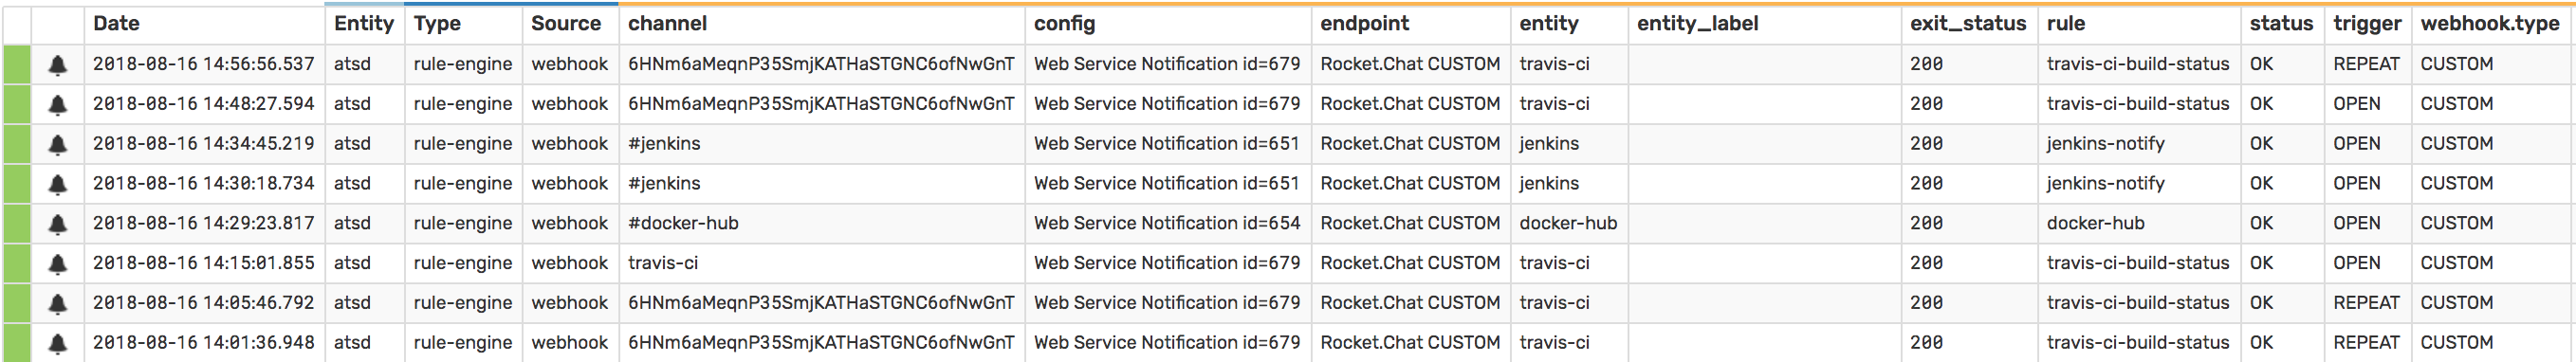
Action Logging
Webhook, Email and Script actions log their status as ATSD messages. To view action logs, select the option in the left menu.
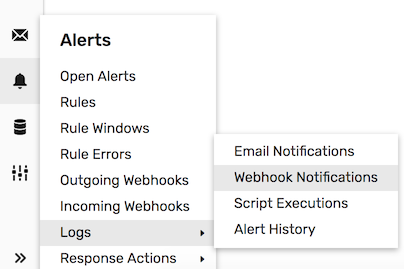
- Email Notification Log

- Webhook Notification Log
- Script Action Log

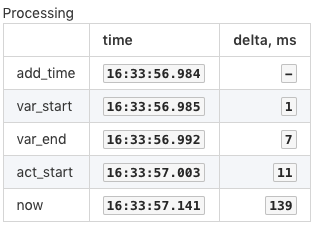
Latency and Tracing
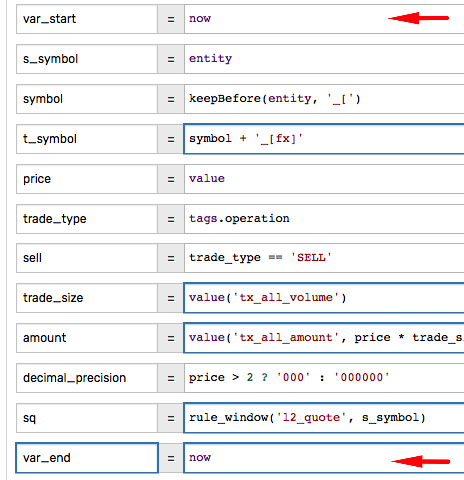
To monitor the latency between incoming commands and response actions, add time checkpoints by declaring variables set to now.
The execution times for each stage can be included in the notification message for tracing.
|           | time                   | delta, ms                              |
|-----------|------------------------|---------------------------------------:|
| add_time  | `${df.f(add_time)}`    | `-`                                    |
| var_start | `${df.f(var_start)}`   | `${elapsedTime(add_time, var_start)}`  |
| var_end   | `${df.f(var_end)}`     | `${elapsedTime(var_start, var_end)}`   |
| act_start | `${df.f(notify_time)}` | `${elapsedTime(var_end, notify_time)}` |
| now       | `${df.f(now)}`         | `${elapsedTime(notify_time, now)}`     |