Multi-Season Overlays
Overview
- Each time series can be de-composed into multiple components consisting of a trend, one or multiple seasonal cycles, and the intrinsic residuals often called noise.
- The seasonality can be deduced manually by observing the records using graphs or determined automatically by analyzing periodograms.
- Once the seasonality is known, overlaying multiple time intervals with the same seasonal lag can be used as an essential visual analysis technique.
- The overlaid series can be assigned different weights by applying opacity to more distant seasons.
Keywords
overlay, lag, shift, seasonality
Graphics
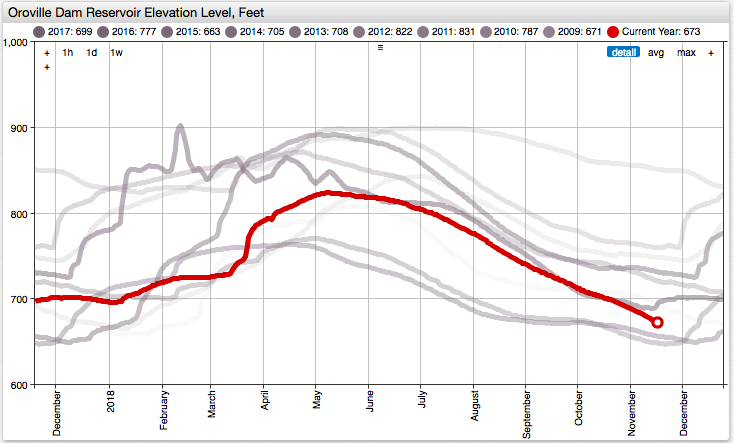
The chart shows the Oroville Dam water levels for the current year (2018, red series) with prior year overlays displayed with a gradually decreasing visibility. Year 2009 is the least visible.

Syntax Features
time-offsetsetting to add time lag to the underlying series.
[series]
  time-offset = @{offset} year
  # time-offset = 1 year
forloop to iterate over multiple seasons.
for name in offsets
  # access current element by @{name}
endfor
rangefunction to generate a numeric sequence, for example a range of years to shift the series.
# inline array
for offset in range(1,10)