Oroville Dam Reservoir Baselines
Overview
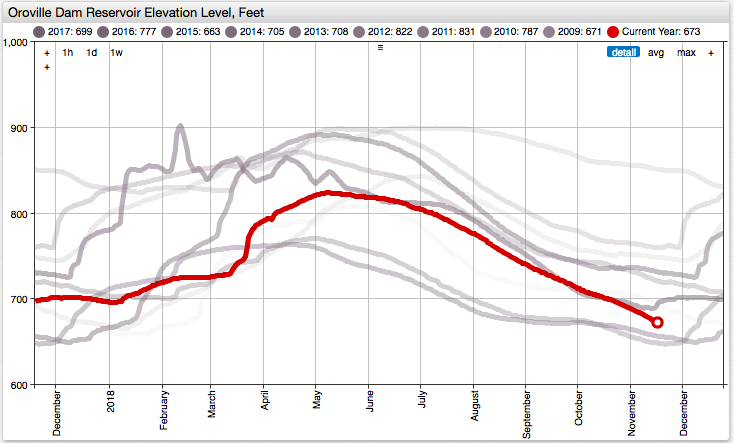
- Oroville Dam water levels continue to be suppressed following the February, 2017 incident.
- Lagged time series facilitate year-on-year comparison and help determine the baseline.
- Past series are de-emphasized using calculated opacity.
Keywords
last-marker, time-offset, hex code, range, context-path, for
Graphics

Syntax Features
time-offsetsetting to add time lag to the series.
[series]
  time-offset = @{offset} year
  # time-offset = 1 year
forloop to add multiple lagged series.
for name in offsets
  # access current element by @{name}
endfor
rangefunction to generate a numeric sequence, for example a range of years by which the series is shifted to the past. The function can be invoked inline.
# define named array
var offsets = range(1,20)
# inline array
for offset in range(1,10)