Complaints in the Emerald City

Keywords
period, statistics, column-label-format, group, tags, sort
Overview
Living in the city has always been a "take the good with the bad" compromise. On the upside, there is the culture and the location, but on the downside there are the other people there messing it all up. The City of Seattle, like most metropolitan areas, has a number of methods for community members to reach out and draw the attention of the government to a particularly egregious problem and as of the last year, they've begun to publish the number of complaints they receive every month about the seven most reported problems.
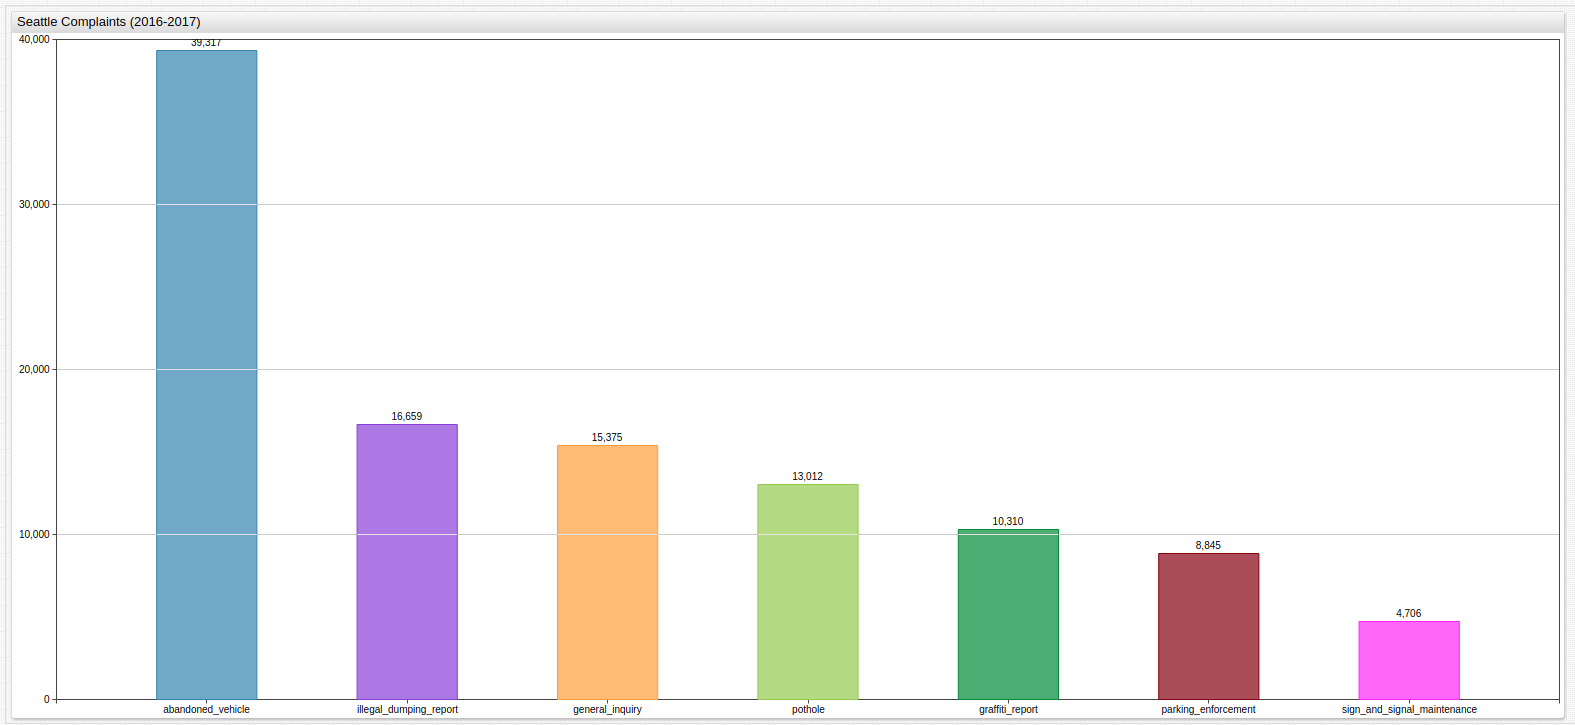
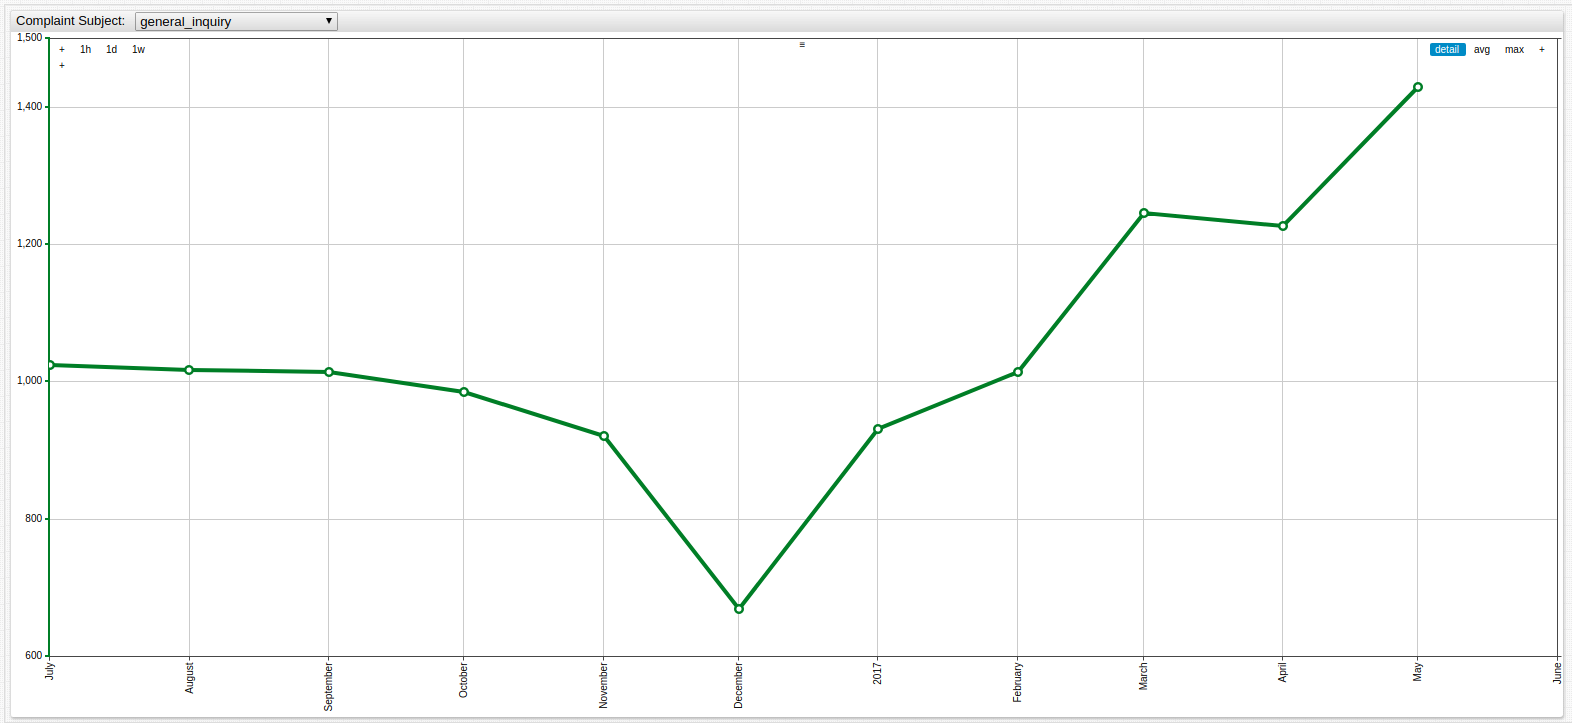
The chart, made in ChartLab based on ATSD, at the top of the screen shows the total number of complaints received from the beginning of the dataset last July all the way up until a few months ago, in June, and the chart below details the complaints by month. Use the drop-down list at the top of the visualization to change the subject of the complaint and see for yourself the changing rates of the main complaints in Seattle.
It seems hard to believe, but according to these figures, the city government receives something on the order of 100 daily complaints about abandoned vehicles littering the city, and an additional 50 about illegal dumping taking place. Knowing that, it is not difficult to understand how committed the residents of Seattle are to keeping the Emerald City green.