U.S. Treasury Holdings Series Filter
Overview
- Filtering data is an important task of any visualization with the aim of presenting evidence with the smallest amount of 'digital ink'.
- This note illustrates several techniques to identify interesting series in the U.S. debt foreign portfolio holdings reported by the U.S. Treasury Department.
- The techniques rely on basic statistical and analytical functions to reduce visual clutter and to spot outliers.
Keywords
filter, visibility, opacity, enable, disable, hide
Graphics
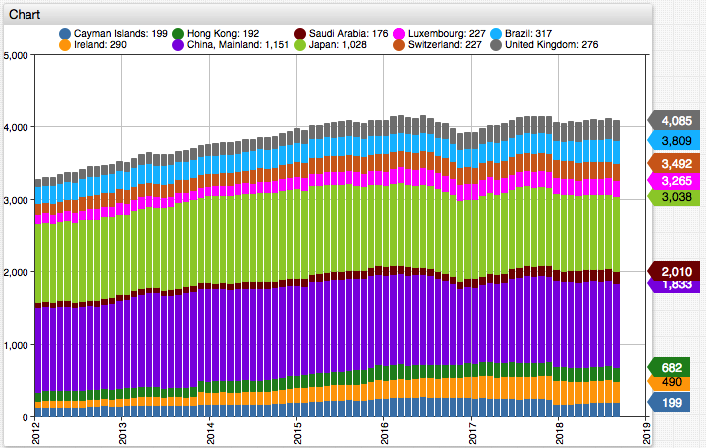
- Top-N countries by U.S. debt holdings

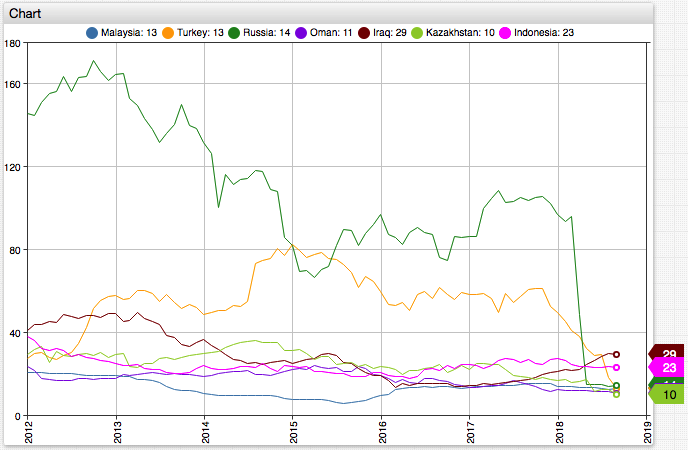
- Countries with substantially decreasing holdings.
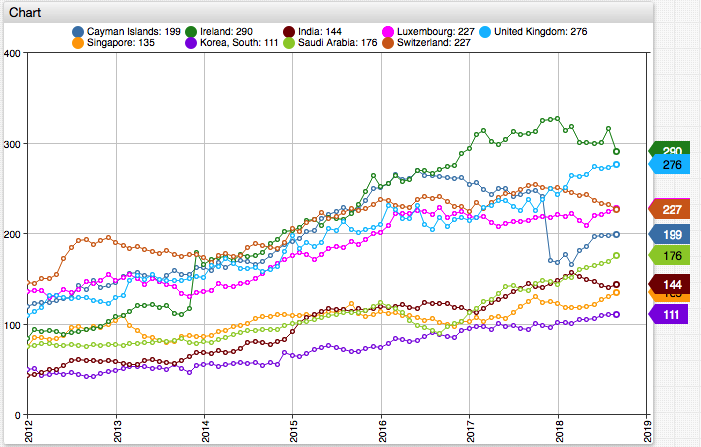
- Countries with substantially increasing holdings.
Syntax Features
displaysetting to hide the series both from the chart and the legend.
[series]
  # Show only top-10 countries by last reported portfolio size
  display = value >= top(10)
[series]
  # Hide countries (both in charts and legend) with maximum holdings during the 10 year period of less than $10B
  display = max('10 year') > 10000
enabledsetting to hide the series in the chart while allowing the user to manually show the series by clicking on its legend.
[series]
  # Show countries with greater than $100B current holdings and with 50%+ increase over the 10-year interval
  enabled = value > 100000 && last('10 year') / first('10 year') > 1.5