Axibase Enterprise Reporter
Overview
ATSD adapter in Axibase Enterprise Reporter, Axibase Fabrica, and Axibase SitCenter (hereinafter Axibase Server) creates a hierarchical representation of metrics collected in ATSD and makes them available for querying in reports.
In order for the Axibase Server to group ATSD metrics into virtual tables, metrics need to be tagged with the table tag.
Setup Integration User
Log in to ATSD.
Open the Settings > User Groups page, click Create.
Create a group called Integration Users Read with
All Entities Readpermission.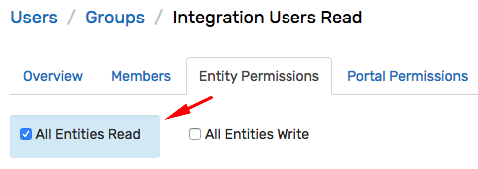
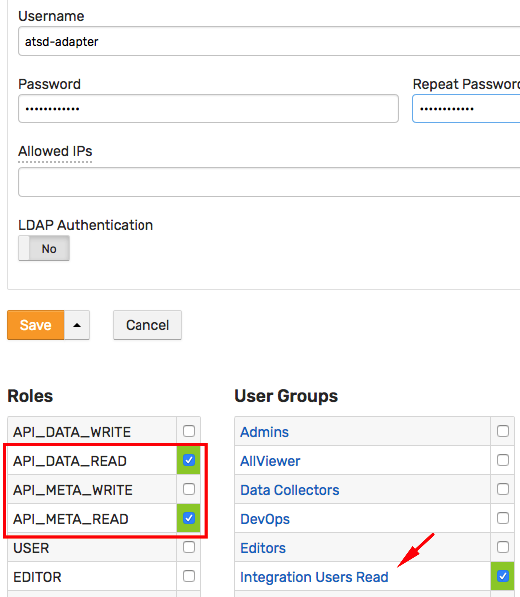
Open the Settings > Users page, click Create.
Create a user with roles
API_DATA_READandAPI_META_READand check the selection to make it member of the Integration Users Read group.Optionally, specify the IP address of the Axibase Server from which the user is allowed to connect.
Configure ATSD Adapter
Log in to Axibase Server.
Open the Admin > Adapters page, click Add.
Enter the ATSD hostname or IP address as well as user credentials.
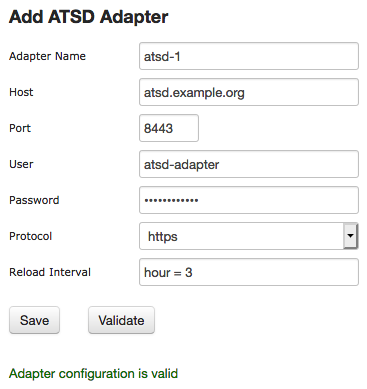
Select Protocol. By default, ATSD listens on port 8443/HTTPS and port 8088/HTTP.
Click Validate and save the adapter if there are no errors.
Configure Metric Visibility
The ATSD typically contains many metrics of which only a small subset needs to be accessed in Axibase Server.
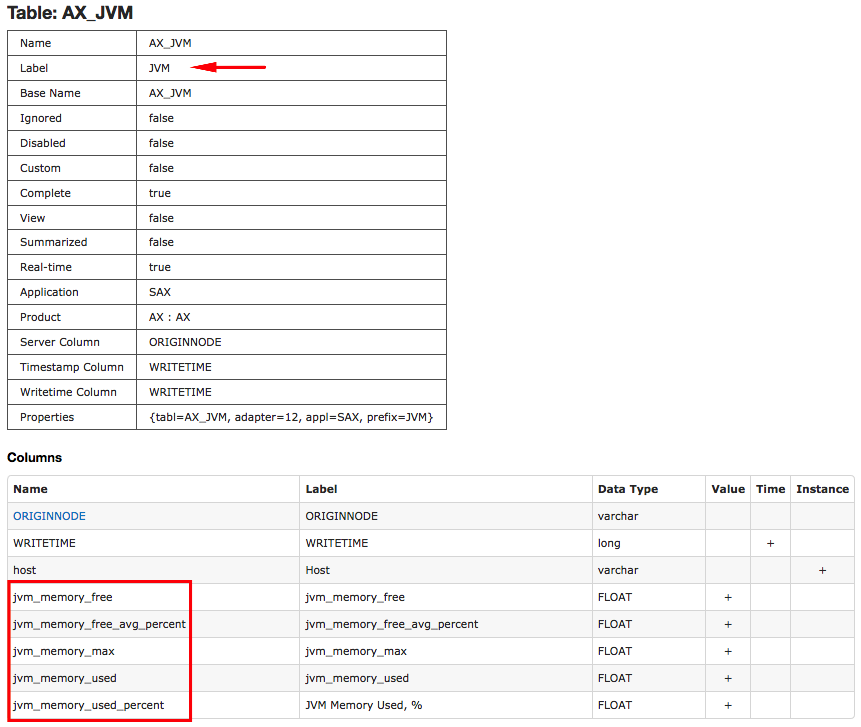
To control which metrics to expose in Axibase Server, use the table metric tag.
Add Metrics
Open the Metrics tab in the main menu.
Search metrics by name.
*and?wildcards are supported.Click the checkbox in the top left corner to select all matching metrics or use the checkbox in each row to include or exclude specific metrics.
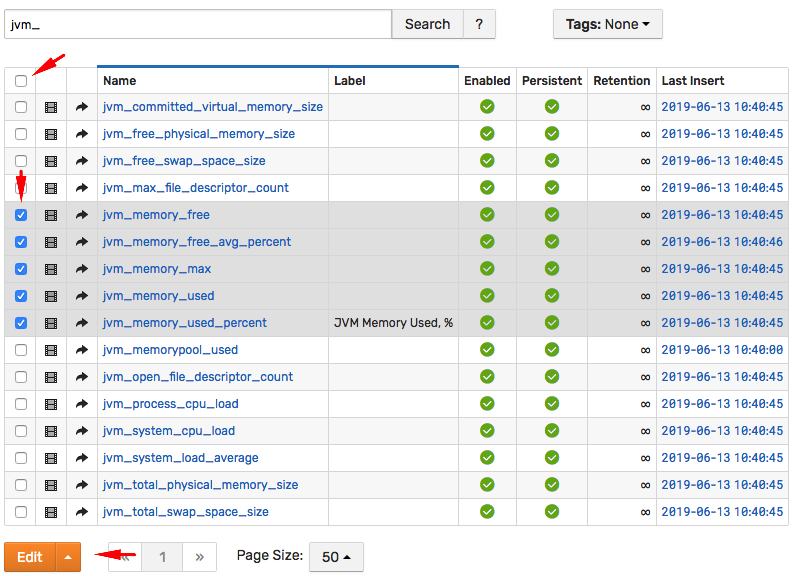
Click Edit to apply the
tabletag to similar metrics. These metrics are displayed under the corresponding table name in Axibase Server.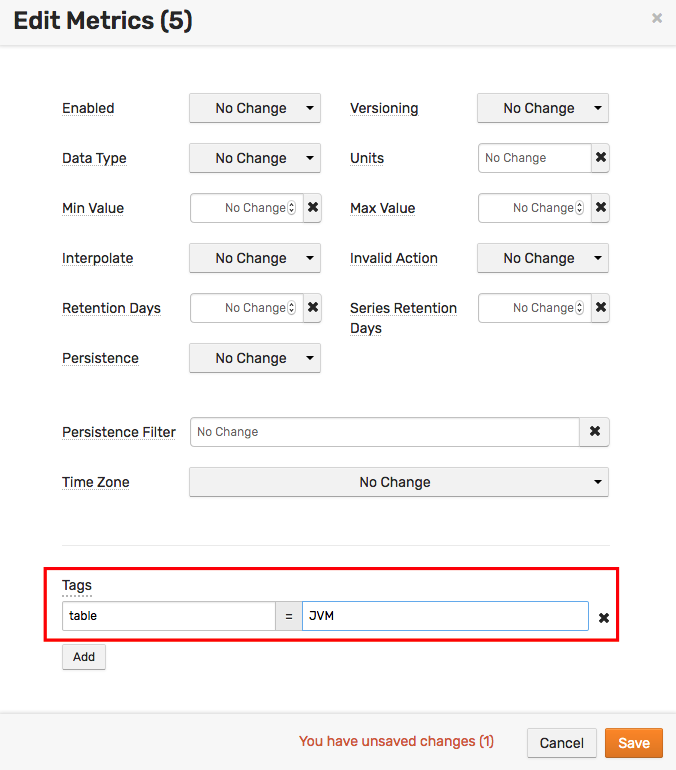
Search metrics by name as before, add
table:*keyword to view the changes.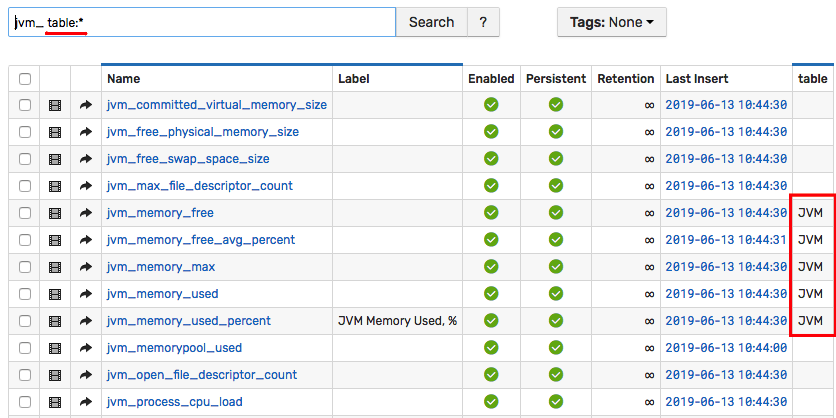
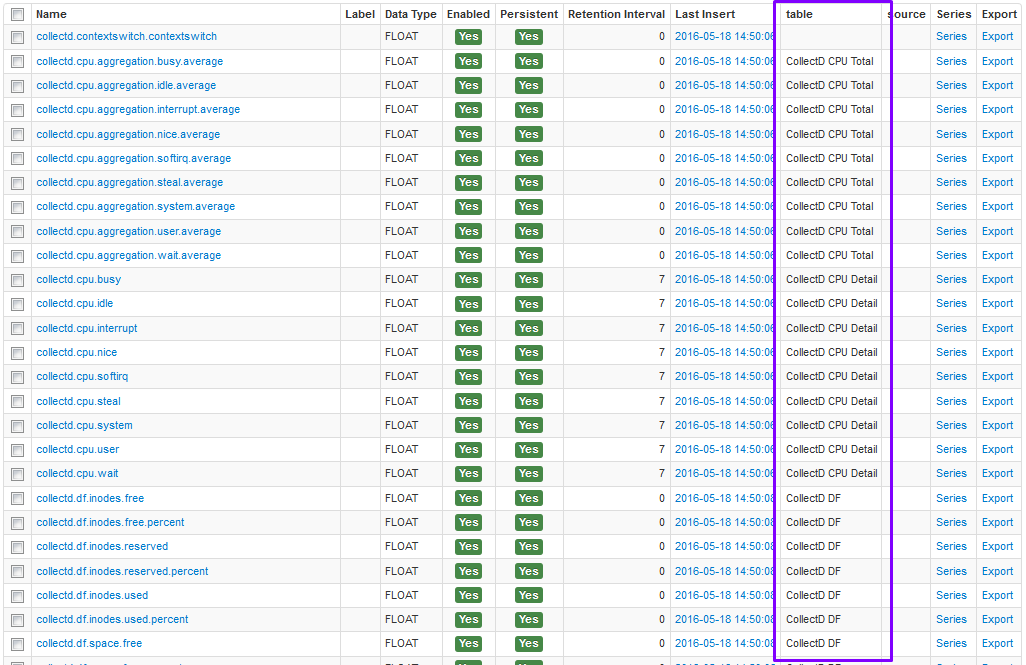
Ensure that series under metrics grouped into one table have the same tags.
Repeat the process to group more metrics into tables.
Discover Metrics in Axibase Server
Log in to the Axibase Server.
Open the Admin > Warehouse Tools page.
Select Reload Schema Cache.
Click View Schema Cache and verify that new metric groups are present as tables.
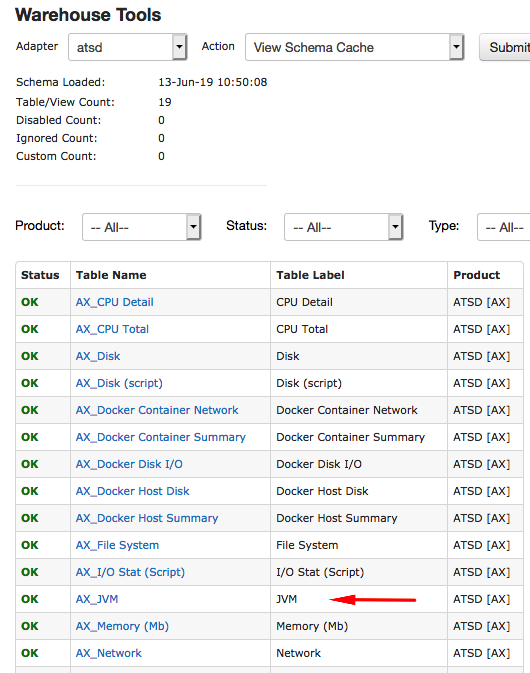
Click the table name to check the list of metrics.
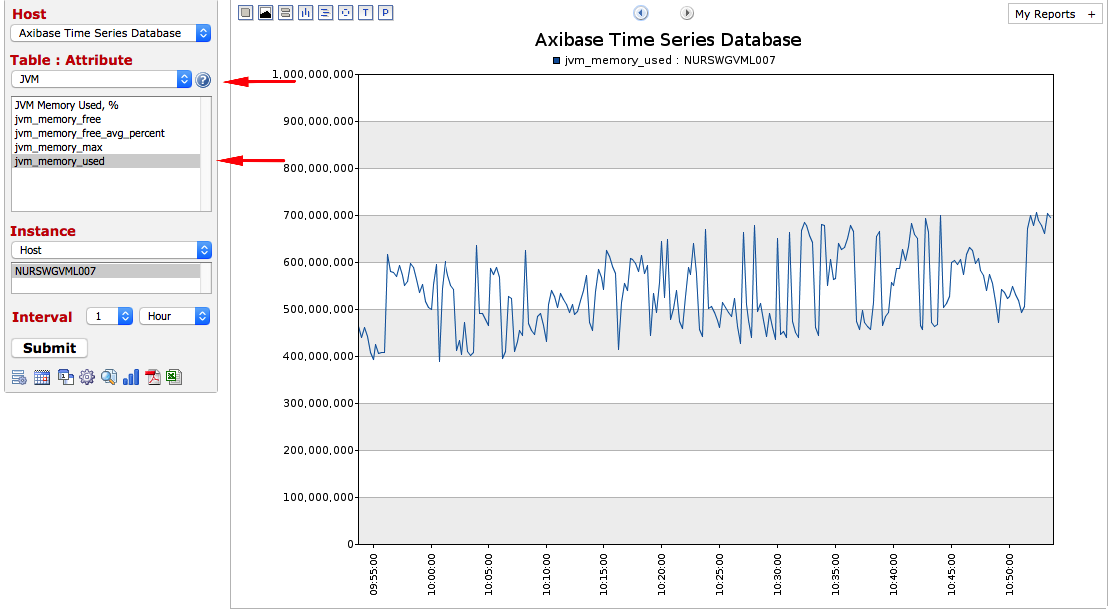
- Open Designer tab, search for an entity collecting the metrics. In the example above, search for
atsdentity. Follow the prompts to view the report.
Configure ATSD Proxy
This step optional
Configure the Axibase Server to serve as an ATSD proxy to ensure that widgets stored in the Axibase Server can query all data in ATSD transparently. In this configuration, the Axibase Server redirects an API request received from the browser directly into ATSD and returns the ATSD response unmodified.
- Open the Admin > Settings page in Axibase Server and expand the SERVER section.
- Enter a full URL to ATSD into the
REDIRECT URLfield, including username and password of the integration user as follows:schema://username:password@atsd_hostname:atsd_port
Example:
http://john.doe:secret@192.0.2.6:8088

- Save these Settings.
- Add the
url = /proxysetting in widget configuration files to query ATSD directly:
[configuration]
  title = Performance/Daily
  width-units = 4
  height-units = 3
  url = /proxy

  [group]
  [widget]
    type = chart
    /*
        Query entities and metrics defined in ATSD, even if not exposed in Axibase Server
    */
    metric = mpstat.cpu_busy
    entity = nurswghbs001