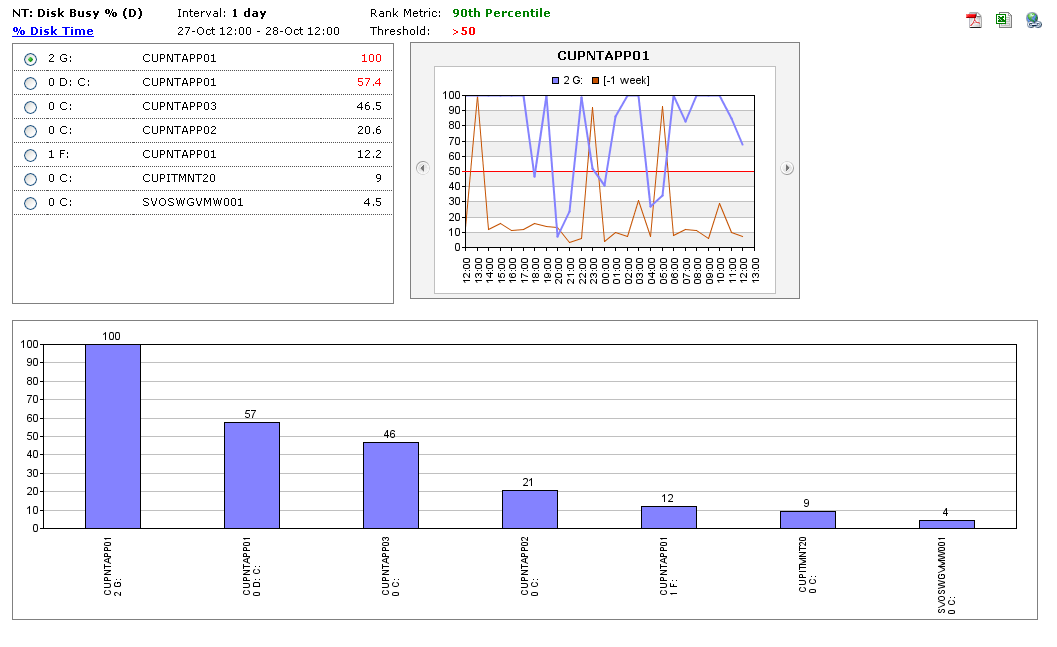
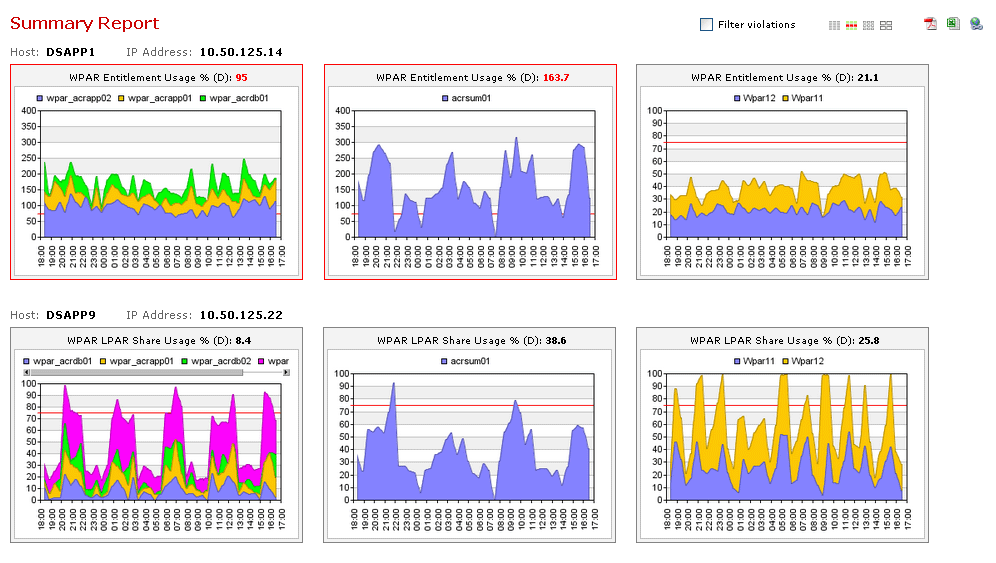
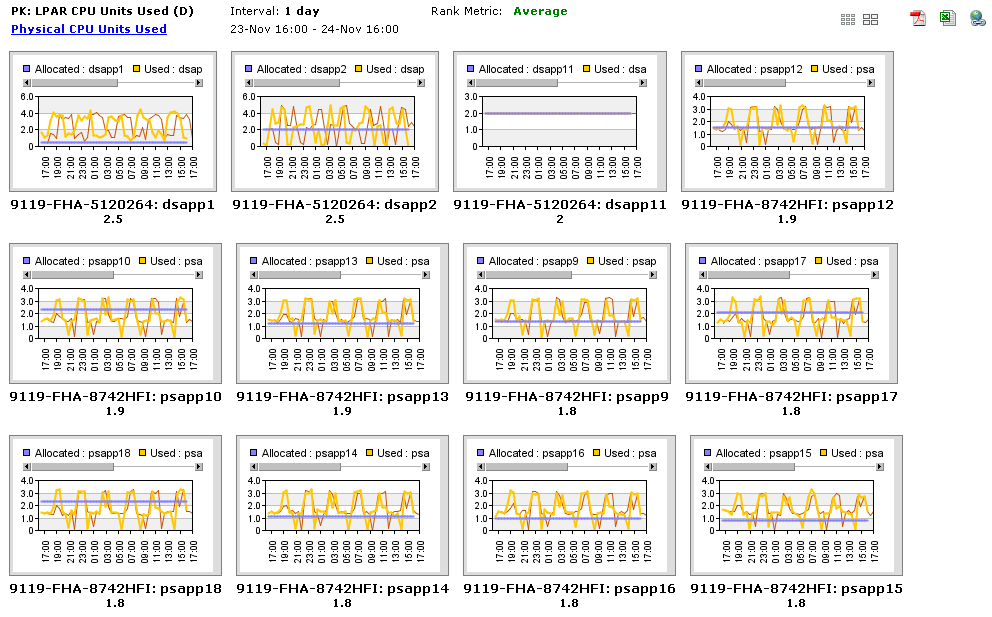
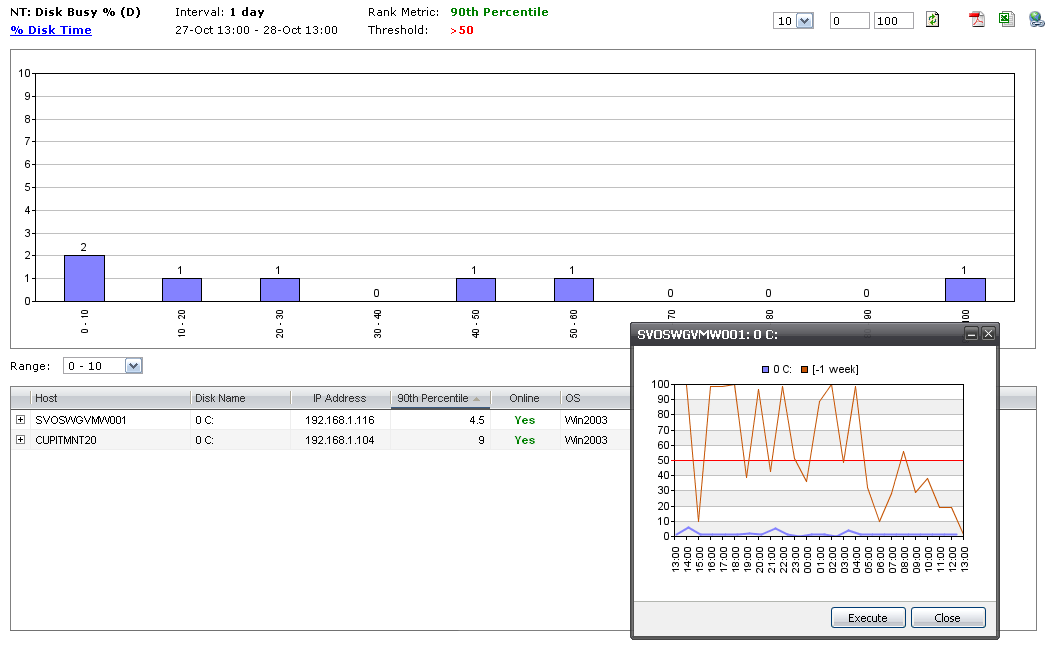
- View the top overutilized and underutilized servers
- Filter by location, application, and environment
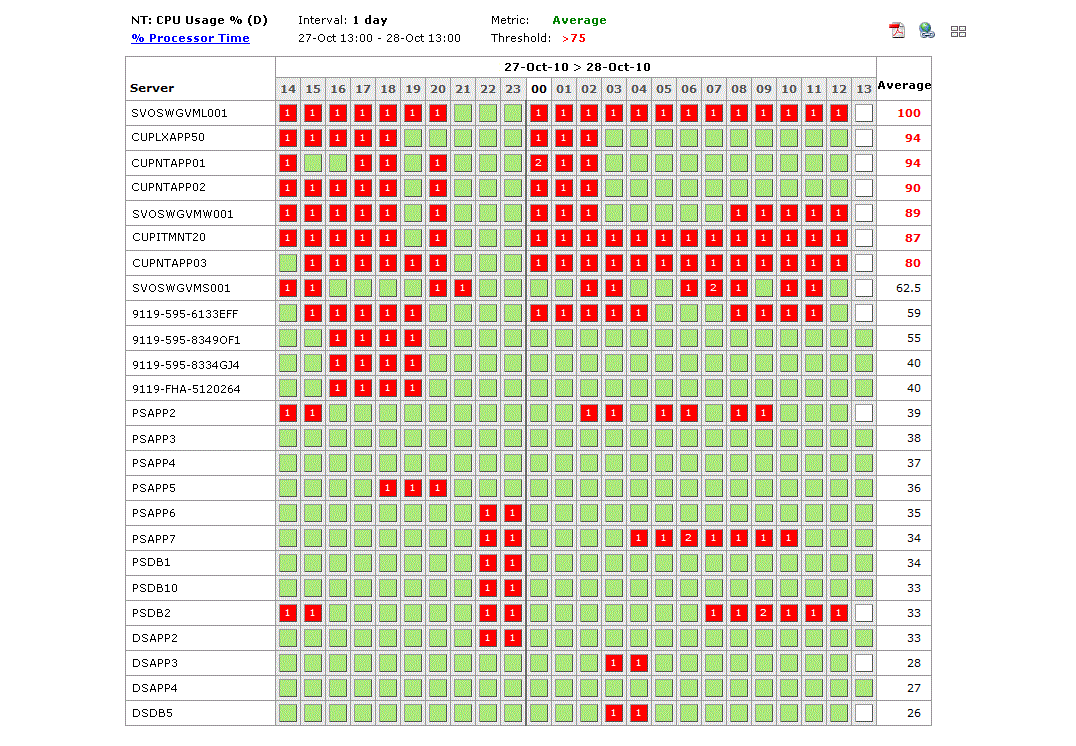
- Highlight threshold violations
- Drill down into detailed statistics for in-depth diagnostics
- Evaluate the CPU, memory, disk, and network statistics for each server
- Filter threshold violations
- Correlate the performance of multiple servers in cluster or application
- Choose from more than 20 statistical metrics
- Finds servers available for virtualization
- Uses statistical metrics to profile an entire environment
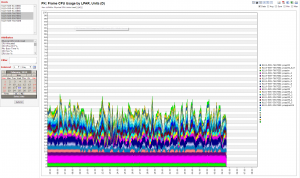
- Displays statistics for multiple servers on one chart
- Arranges a collection of values by time
- Contrasts the performance to server configuration
- Sorts servers by statistics such as violations and forecasts
- Identifies system-wide patterns in performance degradation
- Finds bottlenecks between multiple servers
- Detects hidden dependencies
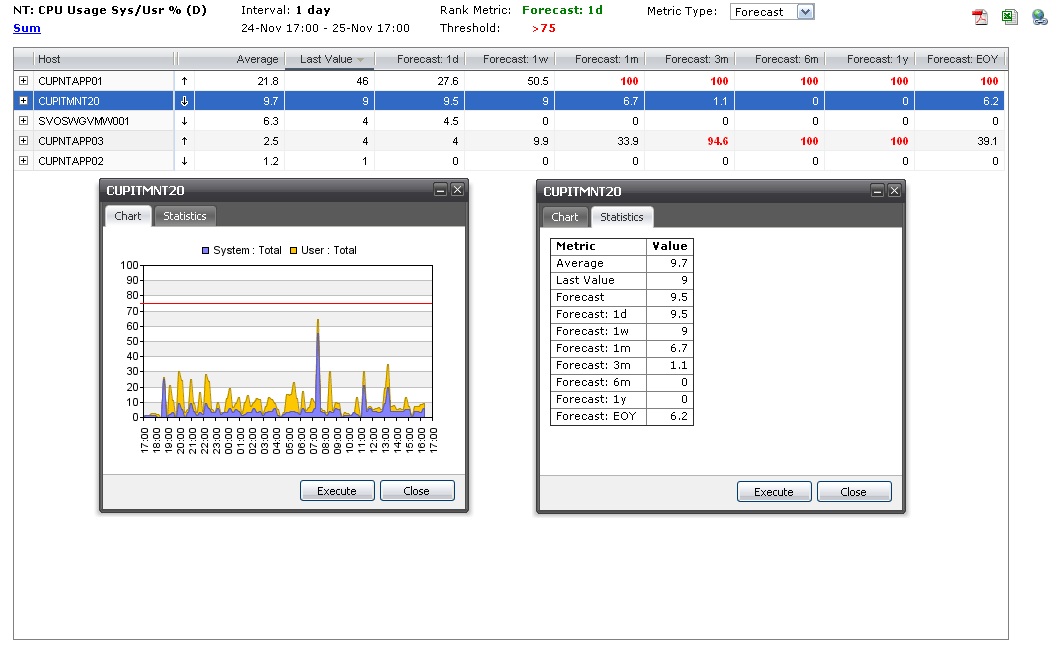
- Forecasts resource utilization with detailed dates
- Highlights upcoming threshold violations
- Generates quick utilization predictions for multiple time intervals
- Drills down into in-depth server statistics
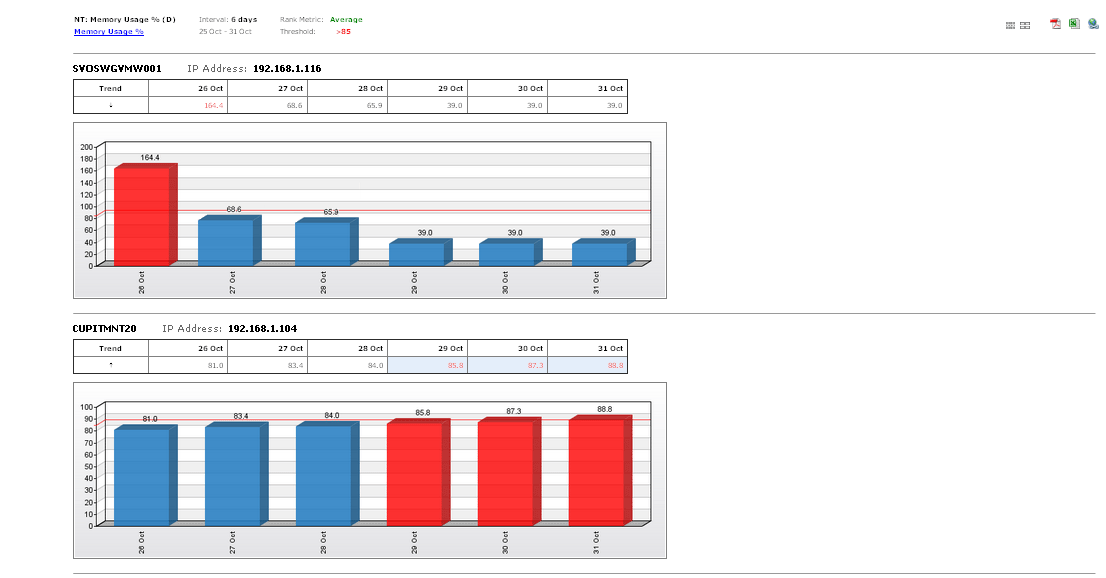
- Shows threshold violation trends
- Looks for underutilized units
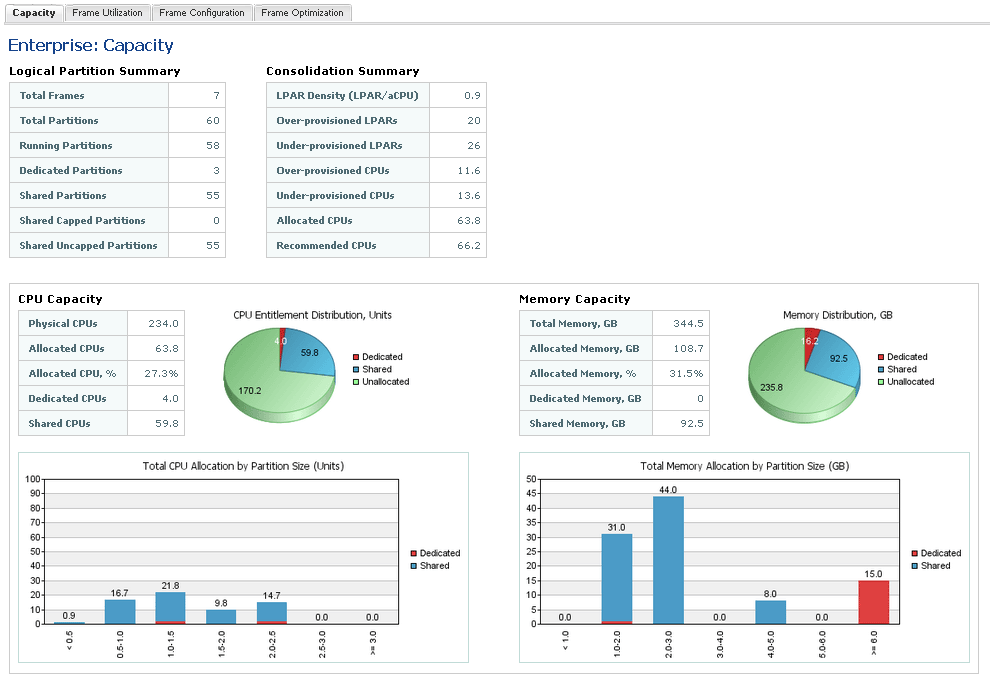
- Examines the entire enterprise-level server capacity
- Summarizes the efficiency of key performance indicators such as LPAR density and over provisioning
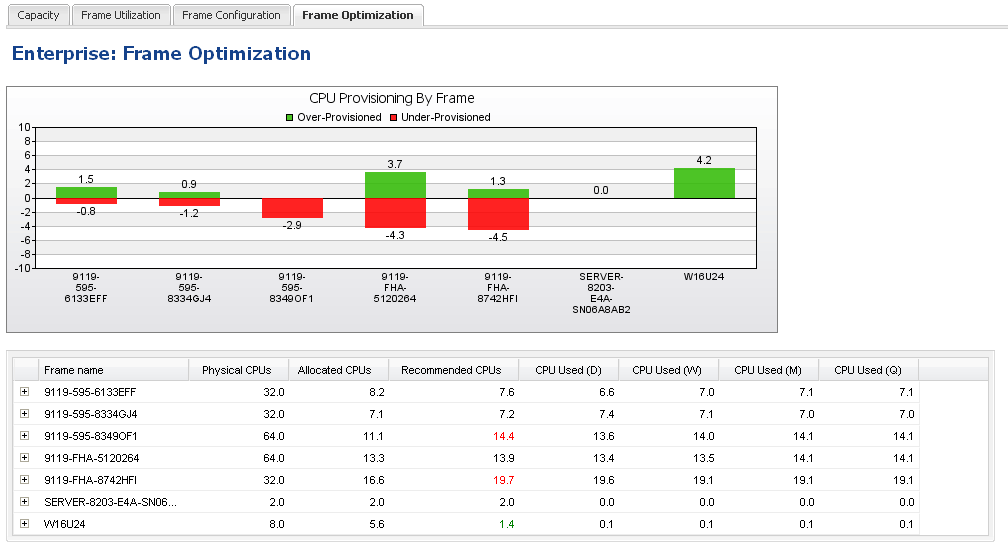
- Identifies over- and under-provisioning imbalances for each frame
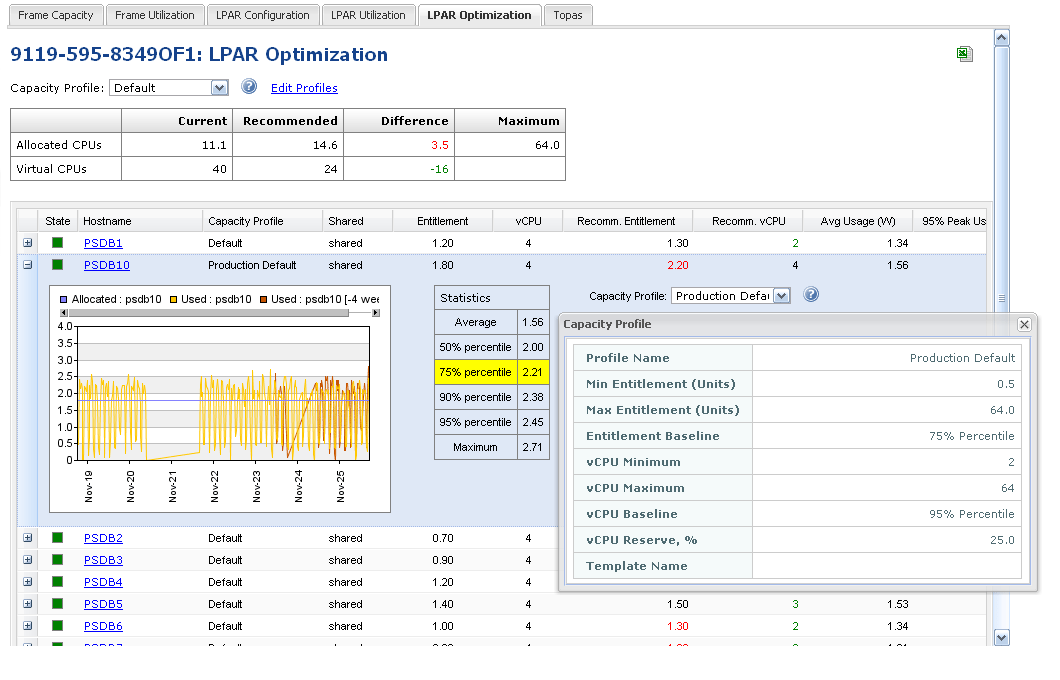
- Provides continuous recommendations for rebalancing LPAR CPU
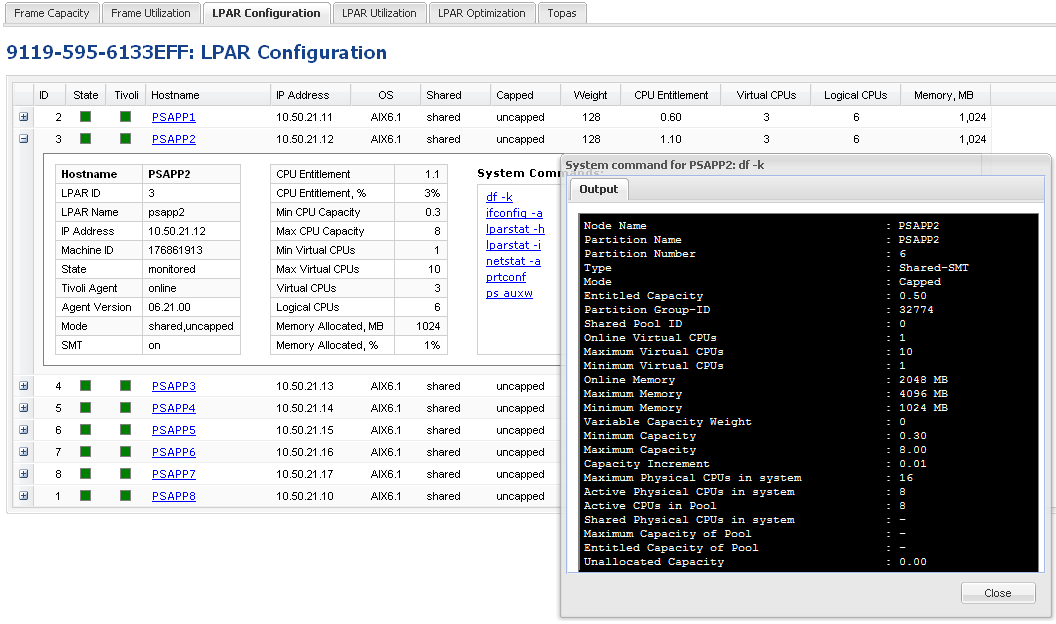
- Configures hardware, LPAR, and WPARs for the entire frame
- Obtains real-time configuration from each partition
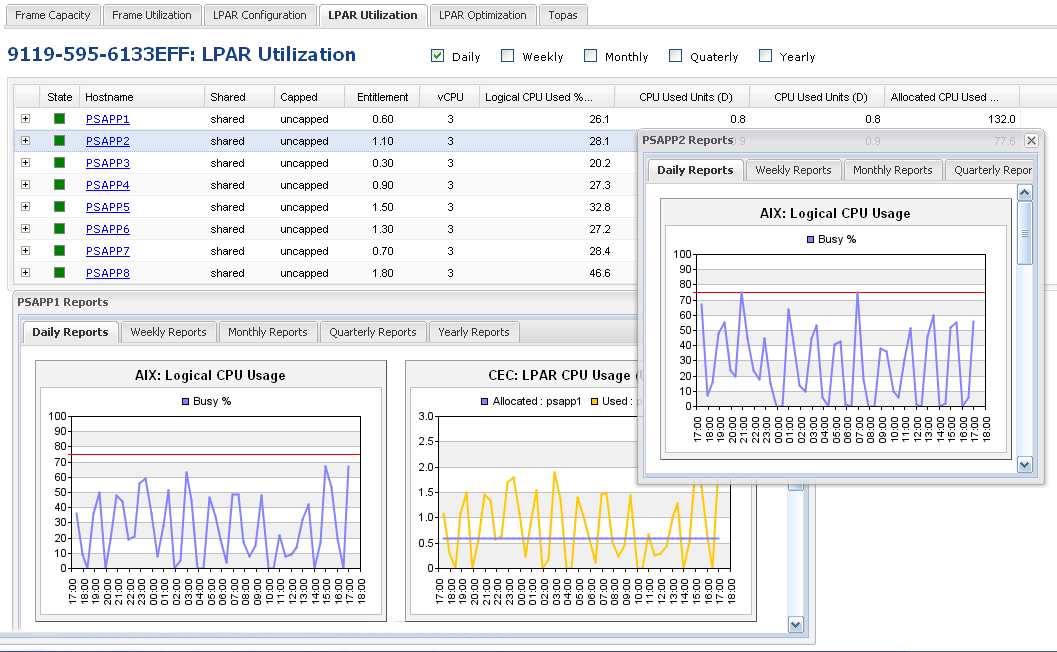
- Displays allocated and used CPU and memory capacity for each partition
- Compares performance across partitions on the same frame
- Examines multiple time periods
- Computes optimal and burst CPU settings for each LPAR based on capacity profiles and historical data
- Ensures resource allocation for Tier-1 LPARs based on priority
- Presents in-depth, out-of-the-box historical LPAR statistics
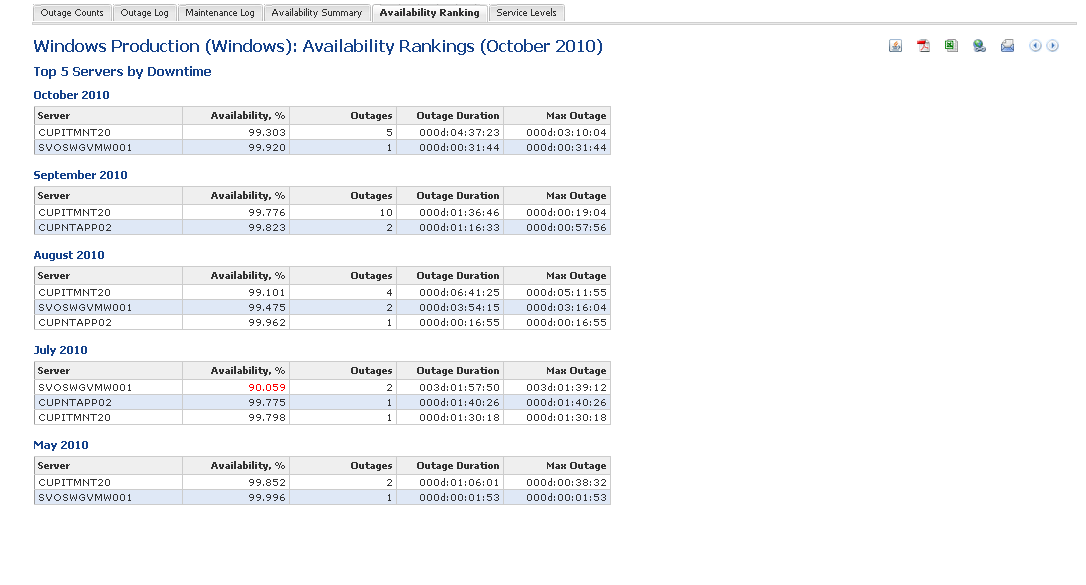
- Captures and report downtime incidents
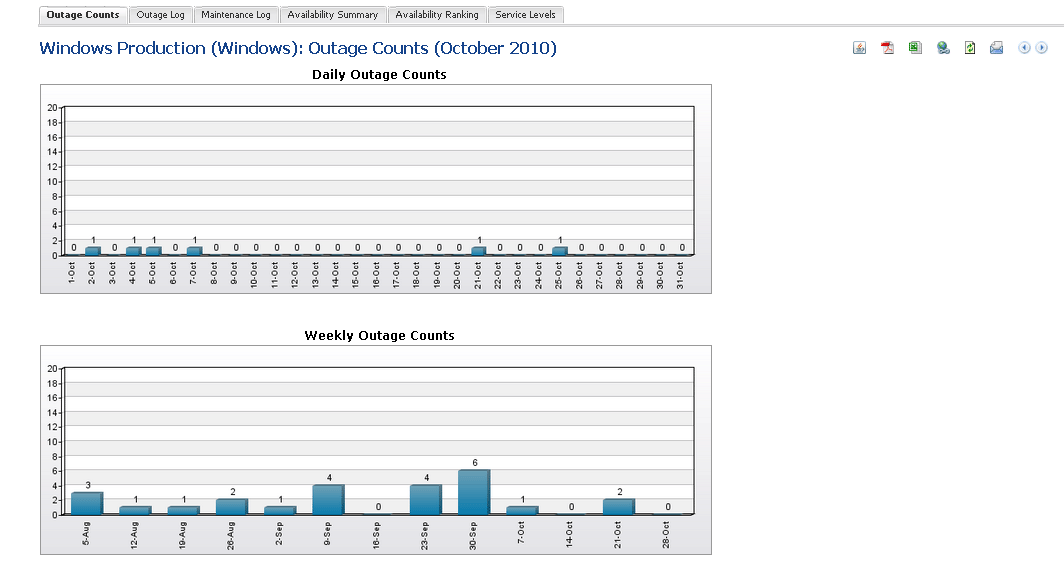
- Graphs daily, weekly, monthly, and quarterly outage counts
- Compares year-on-year outage counts
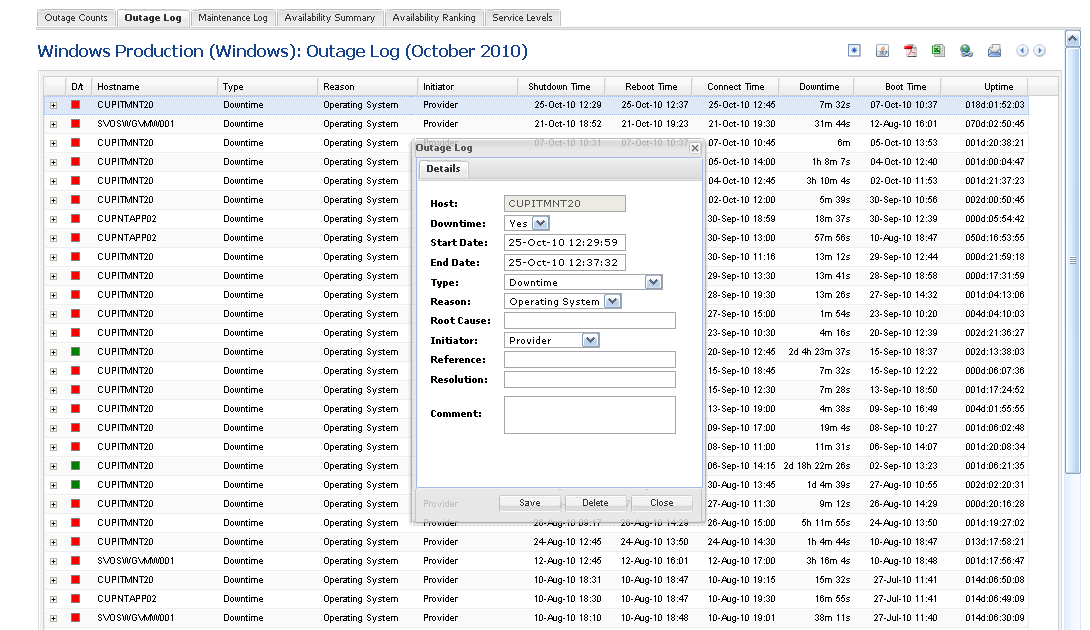
- View an outage log with detailed information on downtime duration
- Reveal the start and end time of the outage and uptime before a shutdown
- Add, enrich, or acknowledge incident records
- Estimate an external events using API
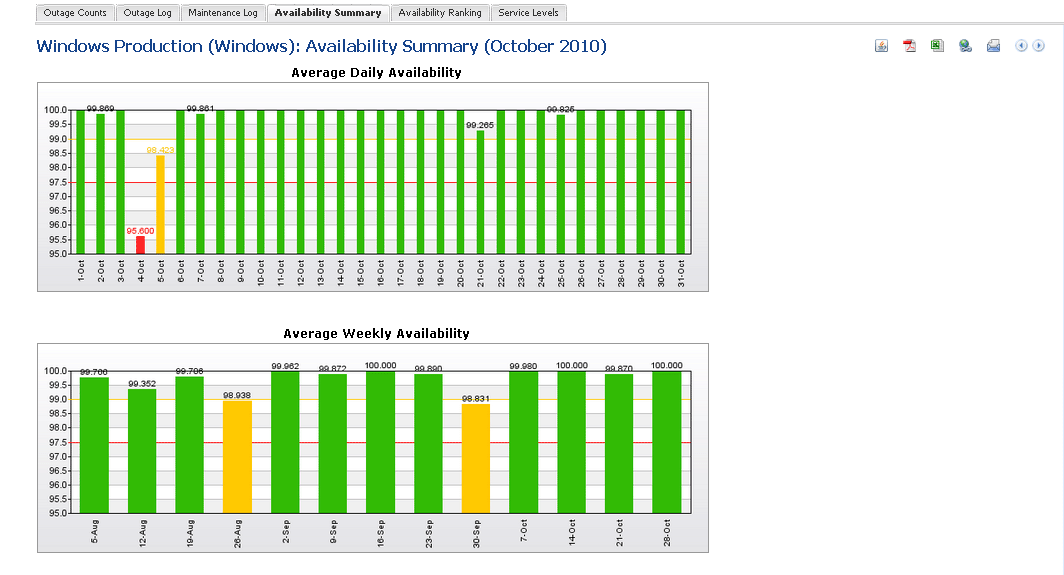
- Daily, weekly, monthly, and quarterly availability statistics
- Application, environment, customer, location, etc.filters
- Outage summaries by month or server with detailed information
- Top-N outage contributors for each month
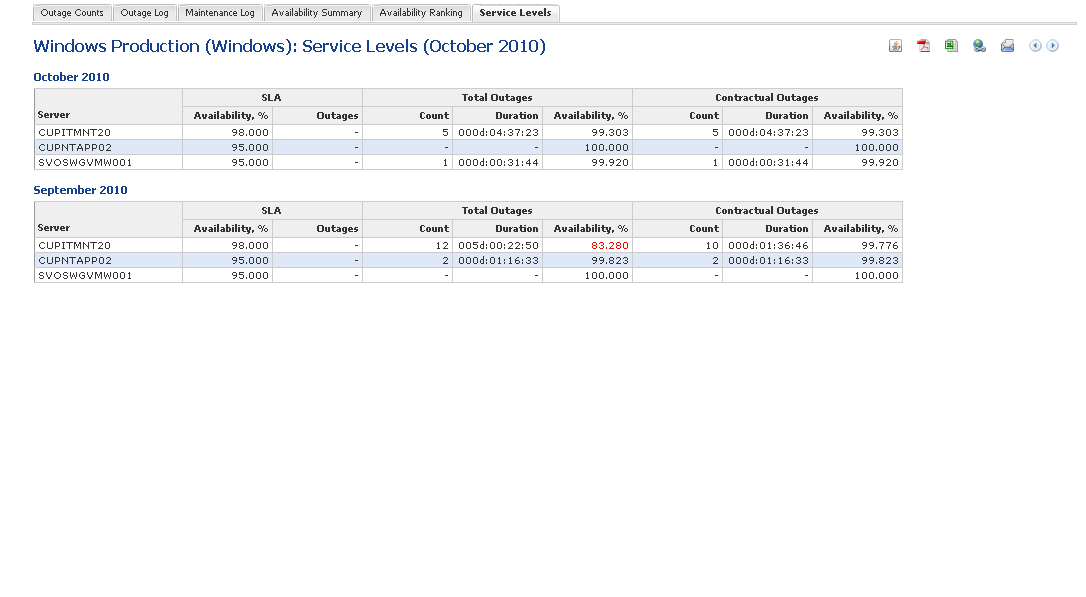
- Contractual outage compliance
- Target SLA levels defined at server or application levels

