City-wide LED Street Light Savings (Los Angeles, CA)

Keywords
list, sort, group, column-label-format, label-format, drop-down, change-field, options
Overview
The City of Los Angeles is keenly aware of the negative effects of greenhouse gas pollution and is often in the process of working to counteract the effects of mass individual car ownership by reducing greenhouse gas emissions in other spheres of life. The Port of Los Angeles for example, reduced the amount of a number of toxic emissions during their 2005-2012 green campaign. Additionally, the City has begun to retrofit their public lighting infrastructure with light-emitting diode (LED) bulbs to update the traditional incandescent bulbs, which are shockingly less efficient.
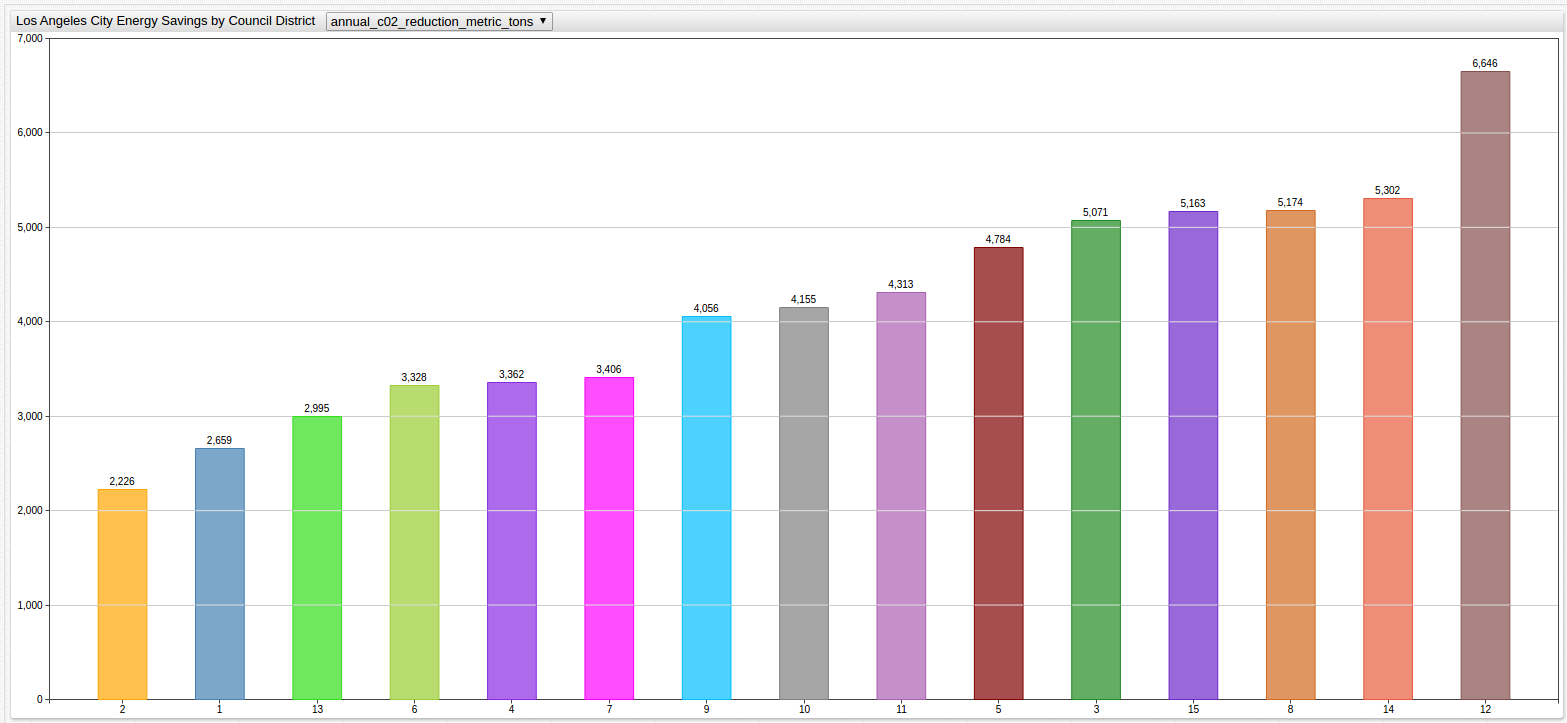
The ChartLab visualization above, made possible by ATSD, tracks government progress with public data and offers insight on the latest foray into environmental protectionism of Los Angeles. Open the chart with the link above, and use the drop-down list to toggle between all of the recorded metrics for a complete picture of The Los Angeles LED Streetlight Program.
The table below indexes the recorded metrics and offers explanation when needed:
| Metric | Unit | Comment |
|---|---|---|
annual_c02_reduction_metric_tons | Metric Tons | - |
annual_energy_savings | ||
annual_energy_savings_gwh | Gigawatt Hours | |
energy_savings | ||
total_nom_wats_tafter_kw | ||
total_nom_watts_before_kw | ||
total_units | Count | Number of streetlights |
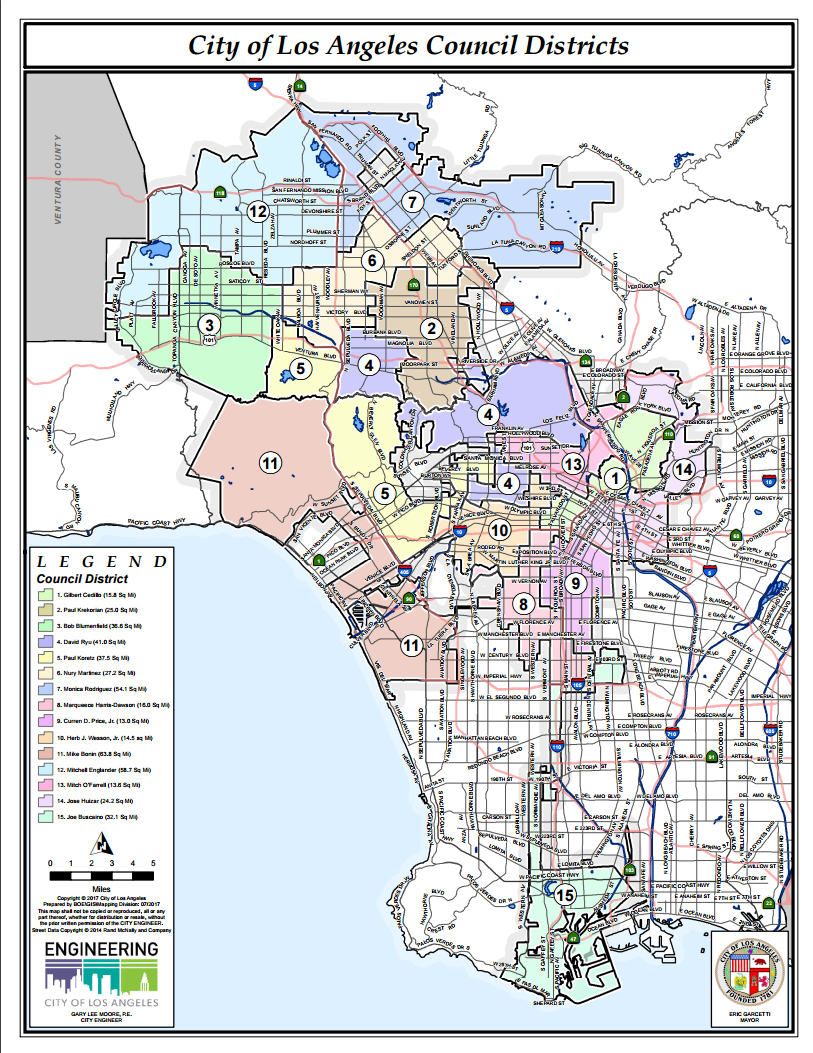
The map below details the City Council districts of Los Angeles to provide a clearer picture of the work being done.

Source: City of Los Angeles, 2017
