Air Traffic Noise Complaints in San Francisco by the Numbers
Visualizations made with Axibase Charts library.
Keywords
column-stack, alert-expression, alert-style, tags, legend-value, label-format
Overview
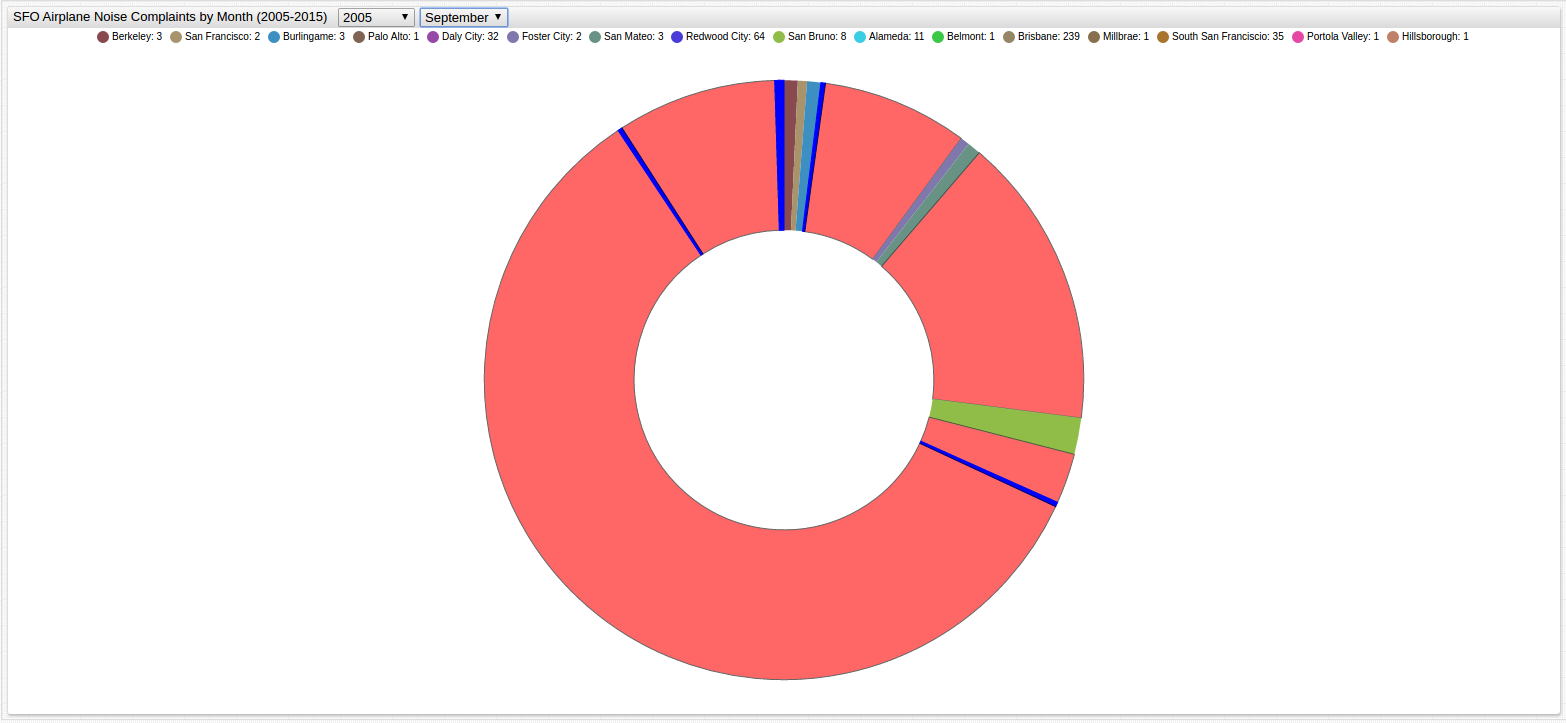
Thinking of moving to San Francisco anytime soon? Check out data stored in Axibase Data Catalog released by the City of San Francisco that covers complaints of air traffic noise from various locations in the San Francisco metropolitan area. Not only is 'Frisco home to the Golden Gate Bridge, one of the wonders of the modern world, but also San Francisco International Airport, or SFO as it is known to frequent fliers. The data is collected by the Office of Aircraft Noise Abatement and includes complaints received via email, hotline, and even handwritten letter. Open ChartLab below and navigate through time using the list at the top of the visualization:

Neighborhoods with more than 48 complaints in any given year are highlighted in red, while those that received 24 or less complaints are highlighted in blue.
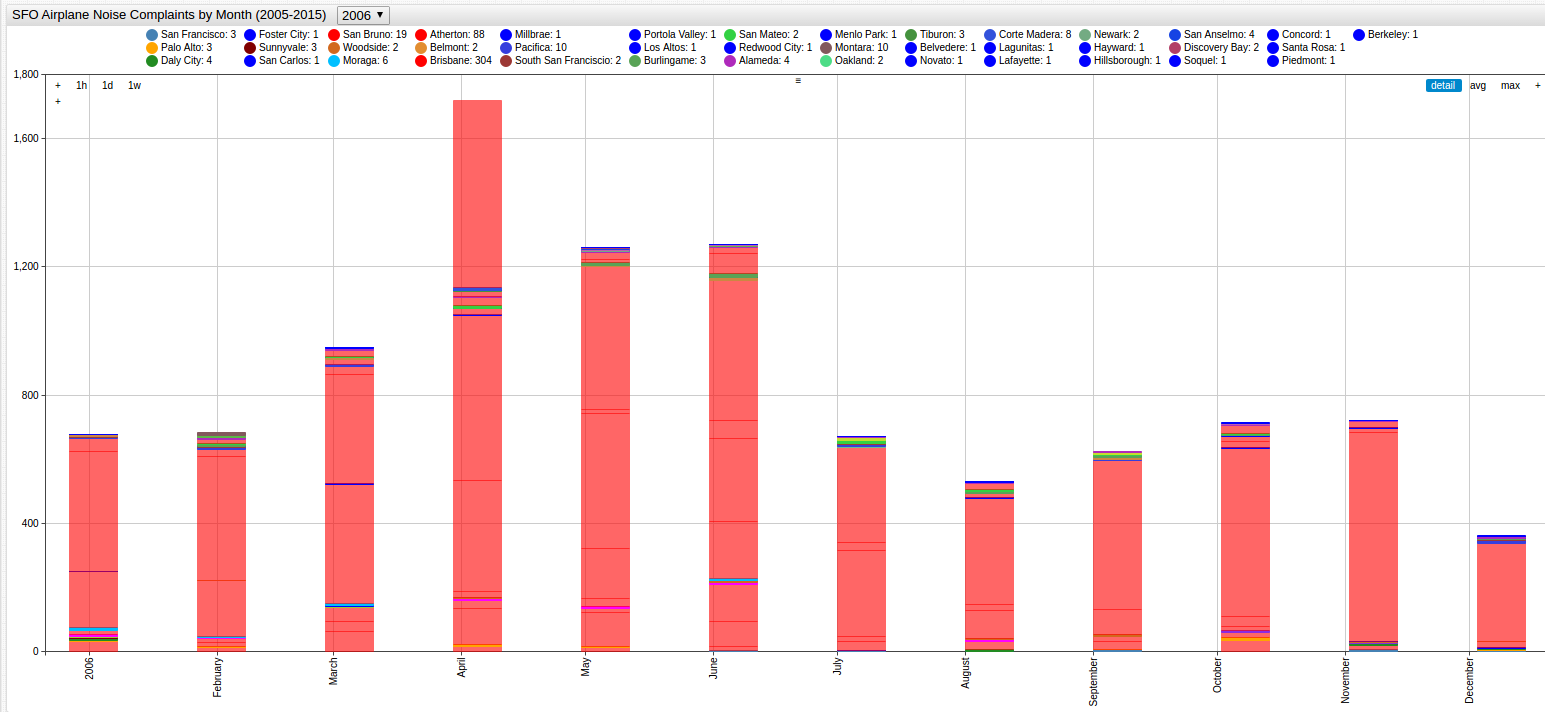
The visualization below further contracts the data, showing complaints by neighborhood received during each month and year:
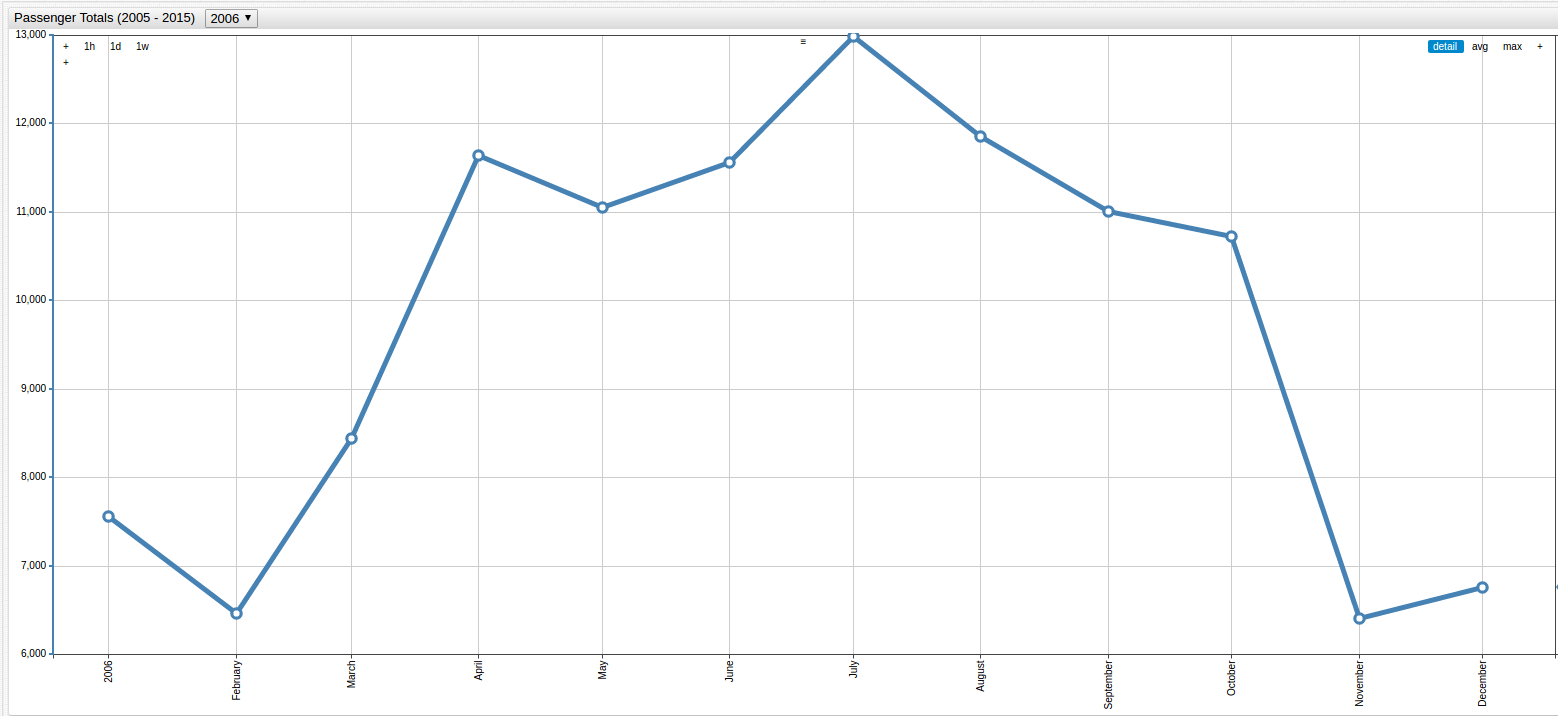
Follow seasonal passenger ebbs and flow trends to spot patterns in complaint traffic, using additional Passenger Statistics. It is no surprise that during peak travel months, the number of complaints received increases as well:
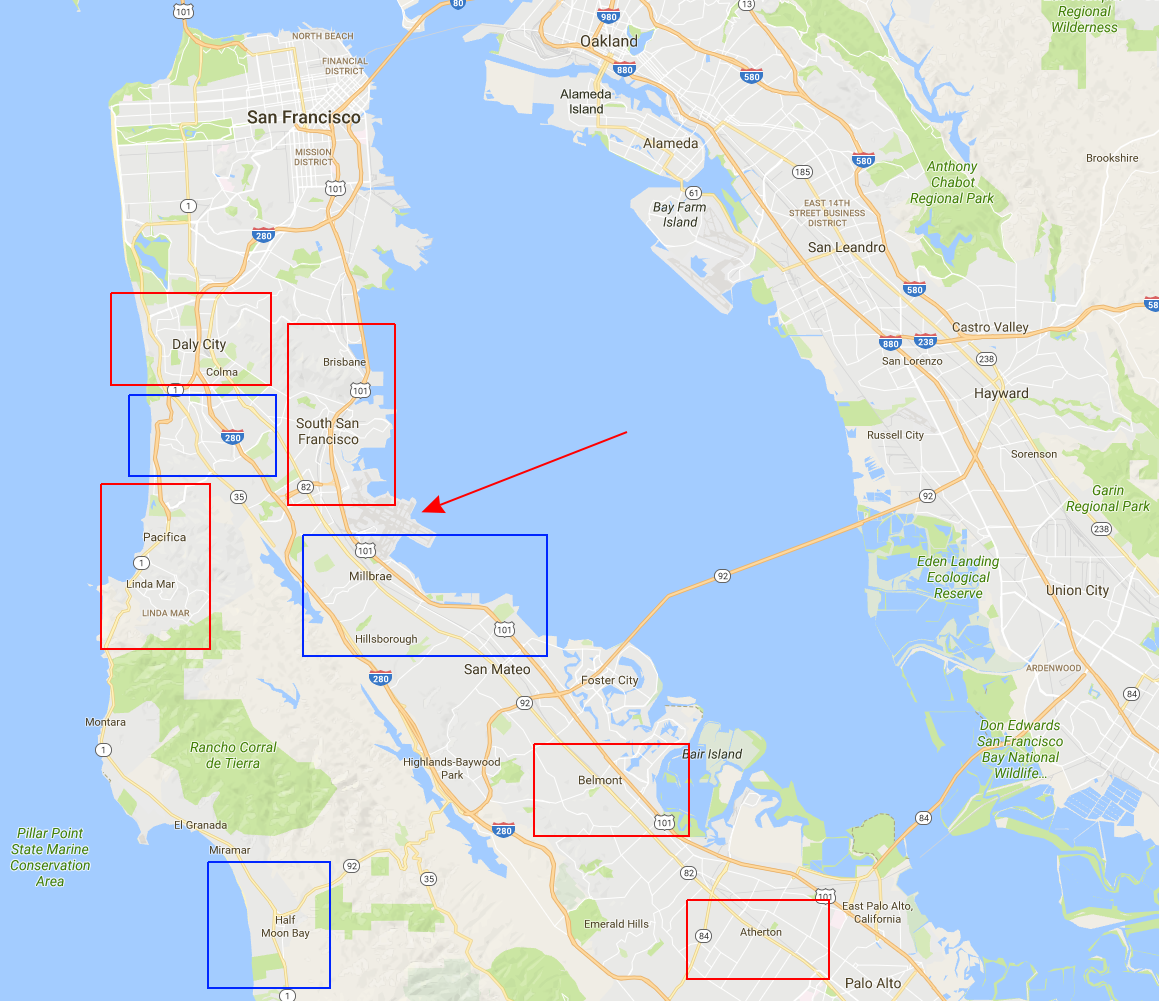
The map below has been modified to highlight neighborhoods with a low number of complaints in blue and a high number of complaints in red, as well as an arrow pointing to the location of the airport itself:
Contact Axibase with any questions.