Comprehensive Housing Market Analysis: City of Austin (2014)
Source Data: City of Austin Report
Structured Query Language: SQL Console in ATSD
Visualization: ChartLab

Index
The following table contains the entire set of included metrics as well as their corresponding visualization figure for easy navigation. Use the clickable links in the Figure column to jump between visualizations and in ChartLab, use the drop-down lists to toggle between metrics.
| Metric | Comment | Figure |
|---|---|---|
| average_monthly_transportation_cost | Dollars/month | Figure 2.1: Transportation Statistics |
| change_in_median_home_value_2000_2012 | Percent (%) | Figure 1.1: Home Cost Statistics |
| change_in_median_rent_2000_2012 | Percent (%) | Figure 1.1: Home Cost Statistics |
| change_in_percentage_of_population_below_poverty_2000_2012 | Percent (%) | Figure 3.1: Socioeconomic Statistics |
| homes_affordable_to_people_earning_less_than_50_000 | Percent (%) | Figure 3.1: Socioeconomic Statistics |
| median_home_value | Dollars | Figure 1.1: Home Cost Statistics |
| median_household_income | Dollars | Figure 3.1: Socioeconomic Statistics |
| median_rent | Dollars/month | Figure 1.1: Home Cost Statistics |
| owner_units_affordable_to_average_artist | Percent (%) | Figure 4.1: Accessibility Statistics |
| owner_units_affordable_to_average_retail_service_worker | Percent (%) | Figure 4.1: Accessibility Statistics |
| owner_units_affordable_to_average_teacher | Percent (%) | Figure 4.1: Accessibility Statistics |
| owner_units_affordable_to_average_tech_worker | Percent (%) | Figure 4.1: Accessibility Statistics |
| percent_change_in_number_of_housing_units_2000_2012 | Percent (%) | Figure 5.1: Quality of Housing Statistics |
| percentage_of_homes_within_1_4_mi_of_transit_stop | Percent (%) | Figure 2.1: Transportation Statistics |
| percentage_of_rental_units_in_poor_condition | Percent (%) | Figure 5.1: Quality of Housing Statistics |
| population_below_poverty_level | Percent (%) | Figure 3.1: Socioeconomic Statistics |
| rent_restricted_units | Number of Units | Figure 5.1: Quality of Housing Statistics |
| rental_units_affordable_to_average_artist | Percent (%) | Figure 4.2: Accessibility Statistics |
| rental_units_affordable_to_average_retail_service_worker | Percent (%) | Figure 4.2: Accessibility Statistics |
| rental_units_affordable_to_average_teacher | Percent (%) | Figure 4.2: Accessibility Statistics |
| rental_units_affordable_to_average_tech_worker | Percent (%) | Figure 4.2: Accessibility Statistics |
| rentals_affordable_to_people_earning_less_than_25_000 | Percent (%) | Figure 3.1: Socioeconomic Statistics |
| transportation_related | Metric name shortened for index, percent (%) | Figure 2.1: Transportation Statistics |
| unemployment | Percent (%) | Figure 3.1: Socioeconomic Statistics |
Home Cost Statistics
The following ChartLab visualization displays information related to the changing cost of both owning and renting a home.
Local Metrics:
- change_in_median_home_value_2000_2012
- change_in_median_rent_2000_2012
- median_home_value
- median_rent
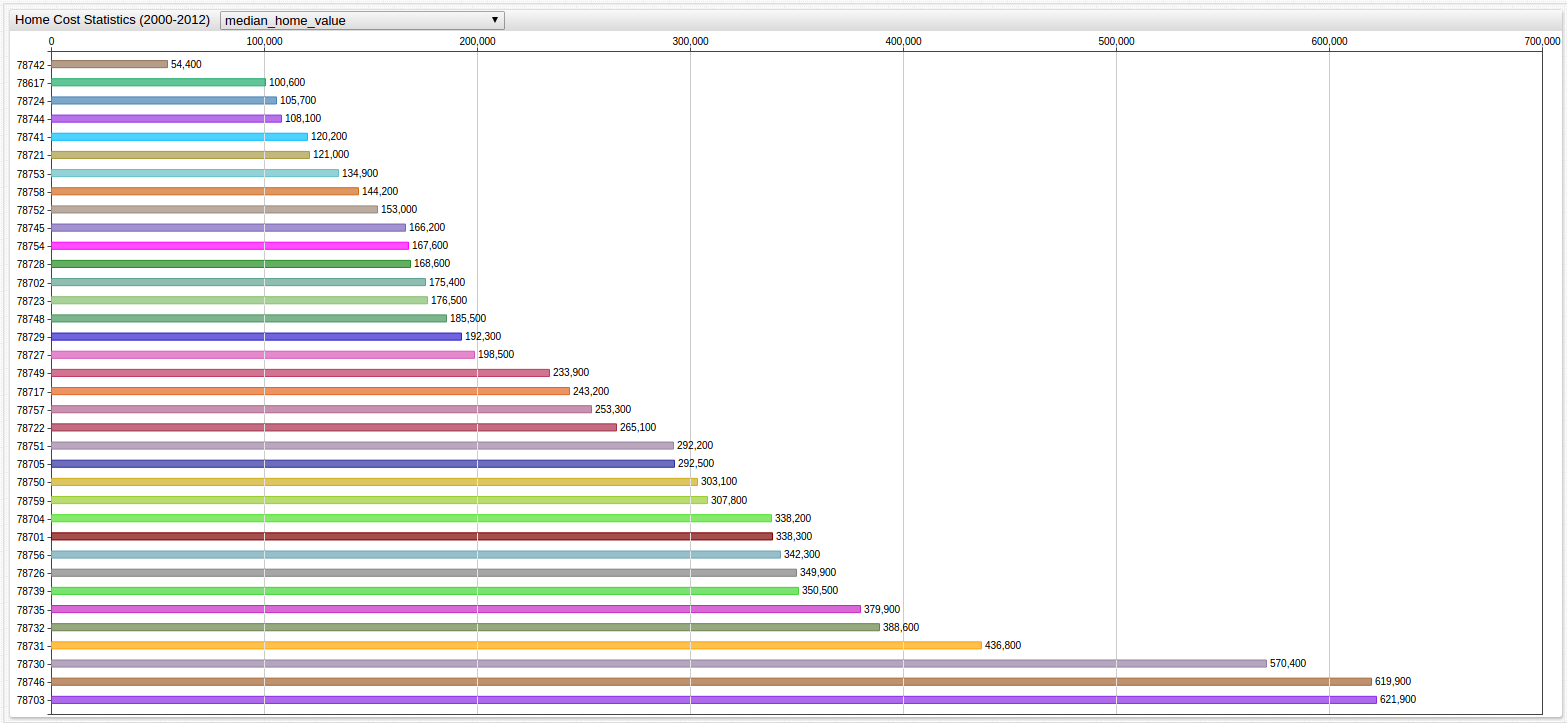

Use the list to navigate between metrics
Return to the Index
Transportation Statistics
The following ChartLab visualization displays information related to transportation cost in the city of Austin.
Local Metrics:
- average_monthly_transportation_cost
- percentage_of_homes_within_1_4_mi_of_transit_stop
- percentage_of_housing_and_transportation_costs_that_is_transportation_related
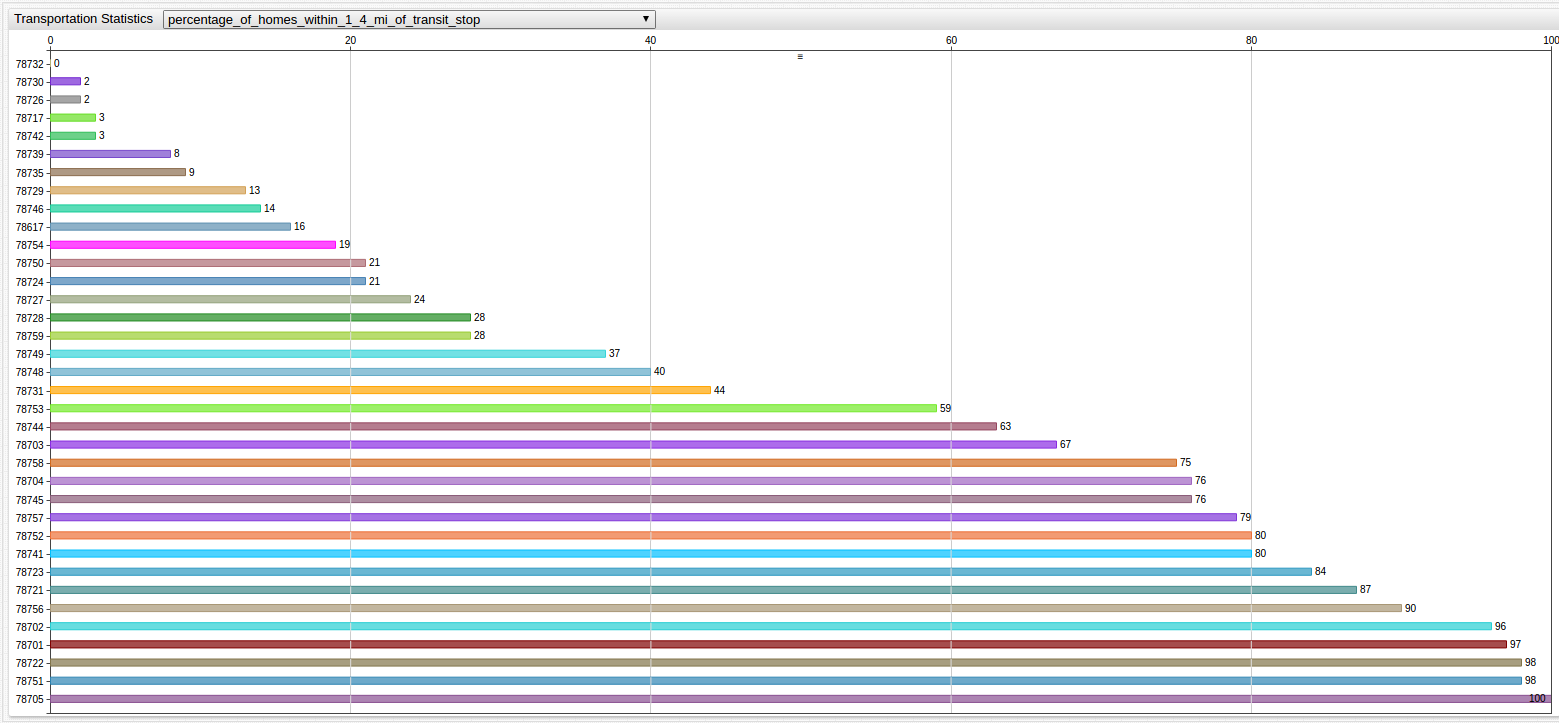
Use the drop-down list to toggle between metrics
Return to the Index
Socioeconomic Statistics
The following ChartLab visualization displays information related to the socioeconomic conditions of Austin residents.
Local Metrics:
- change_in_percentage_of_population_below_poverty_2000_2012
- homes_affordable_to_people_earning_less_than_50_000
- median_household_income
- population_below_poverty_level
- rentals_affordable_to_people_earning_less_than_25_000
- unemployment
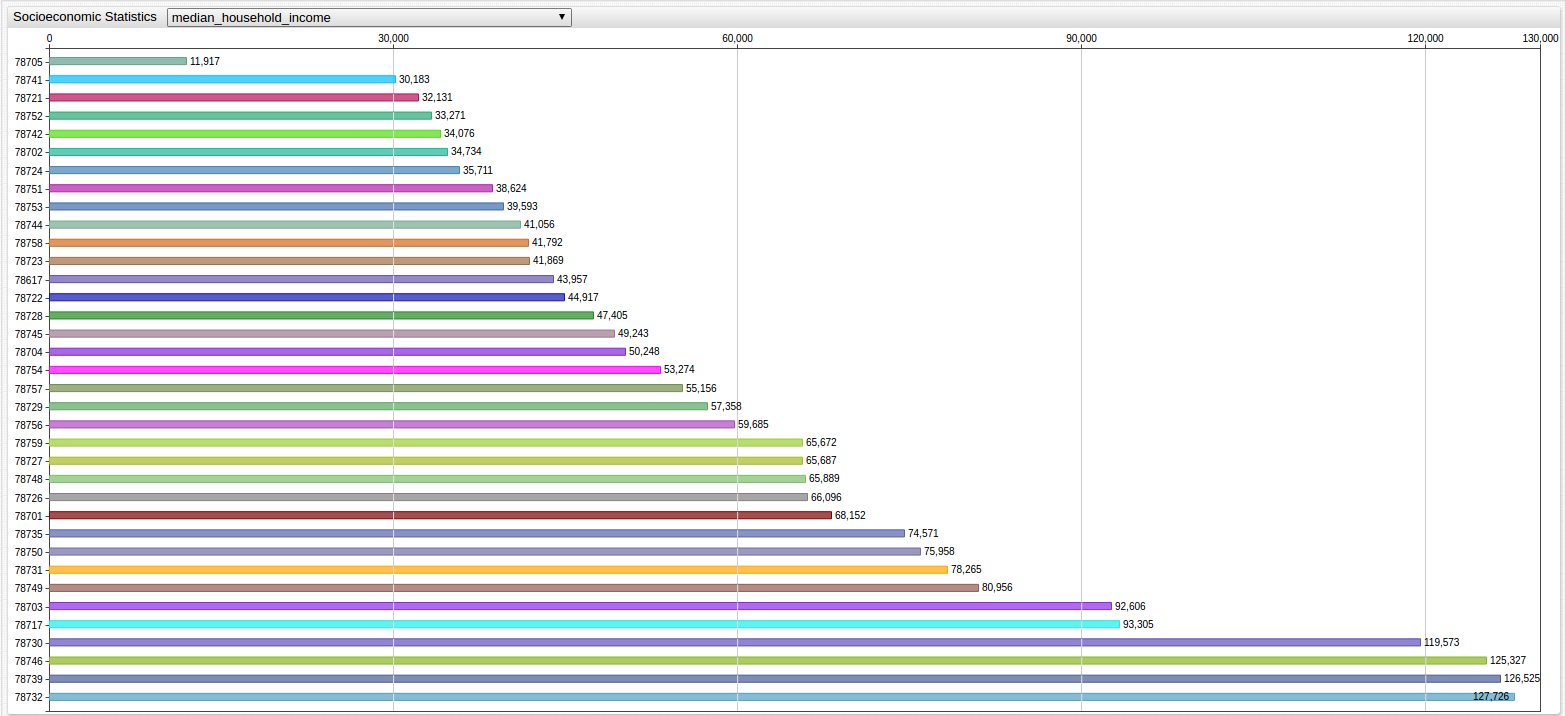
Use the drop-down list to toggle between metrics
Return to the Index
Accessibility Statistics
The following ChartLab visualization displays information related to the accessibility of both owning and renting a home in Austin. Figure 4.1 deals with ownership statistics, whereas Figure 4.2 deals with home rental statistics.
Local Metrics:
Figure 4.1
- owner_units_affordable_to_average_artist
- owner_units_affordable_to_average_retail_service_worker
- owner_units_affordable_to_average_teacher
- owner_units_affordable_to_average_tech_worker
Figure 4.2
- rental_units_affordable_to_average_artist
- rental_units_affordable_to_average_retail_service_worker
- rental_units_affordable_to_average_teacher
- rental_units_affordable_to_average_tech_worker
Figure 4.1
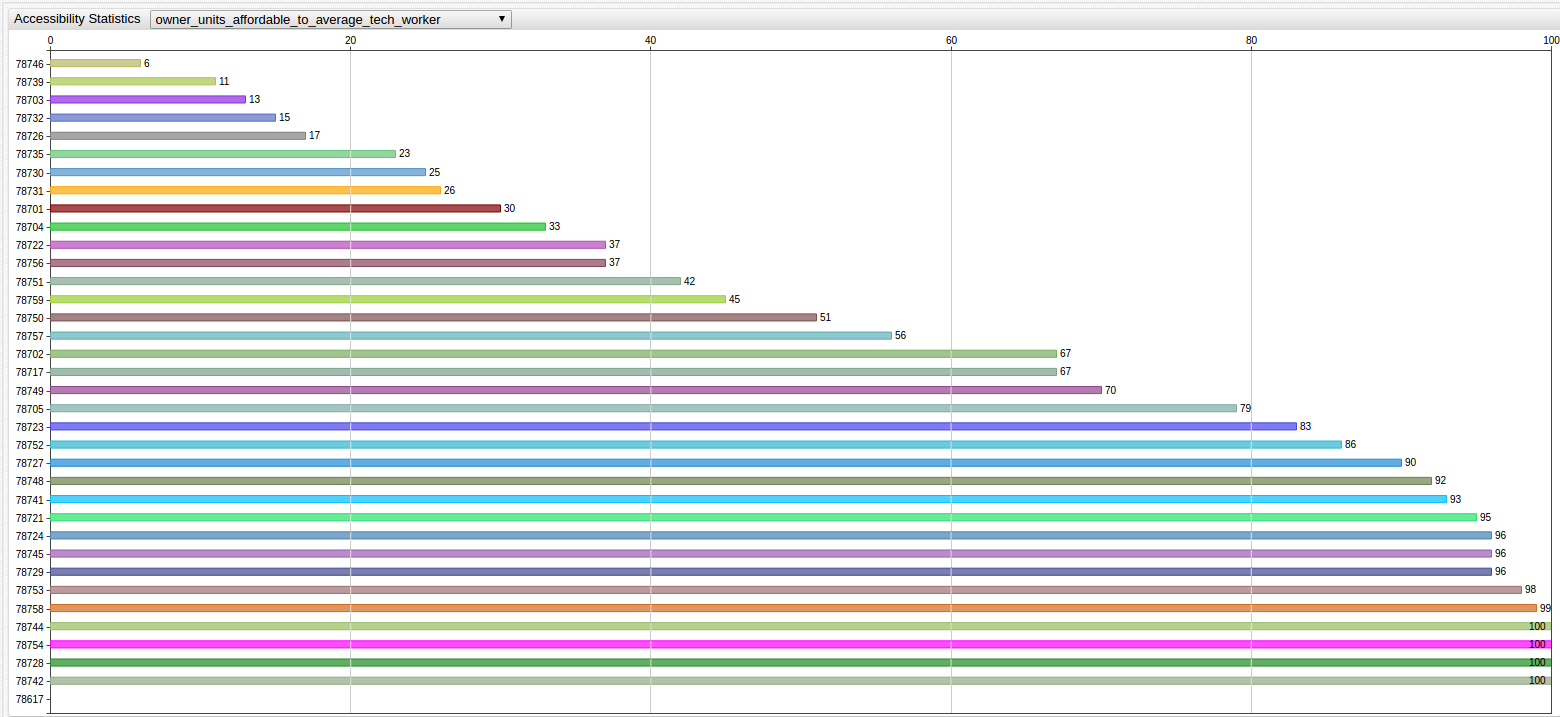
Use the drop-down list to toggle between metrics
Figure 4.2
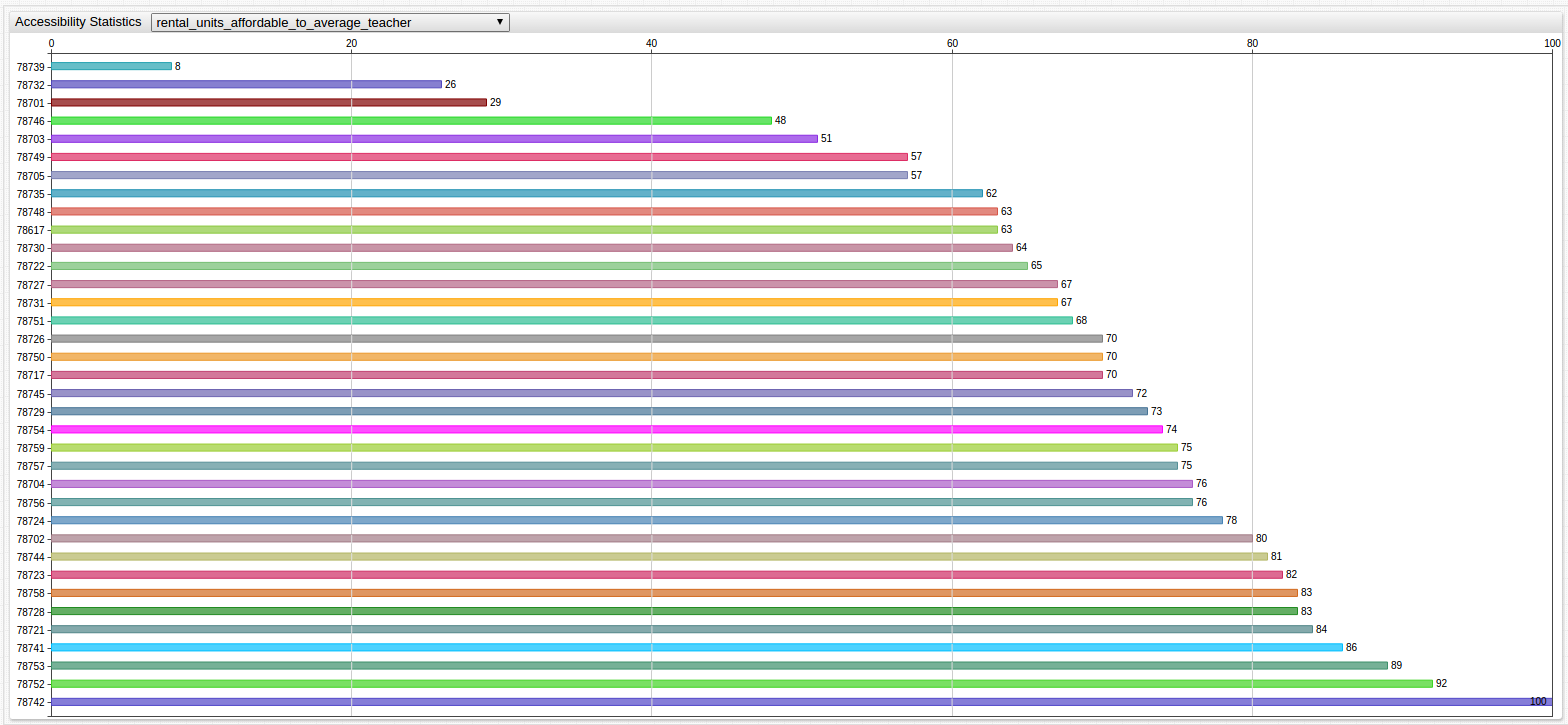
Use the drop-down list to toggle between metrics
Return to the Index
Quality of Housing Statistics
The following ChartLab visualization displays information related to the quality of housing in the City of Austin.
Local Metrics:
- percent_change_in_number_of_housing_units_2000_2012
- percentage_of_rental_units_in_poor_condition
- rent_restricted_units
Figure 5.1
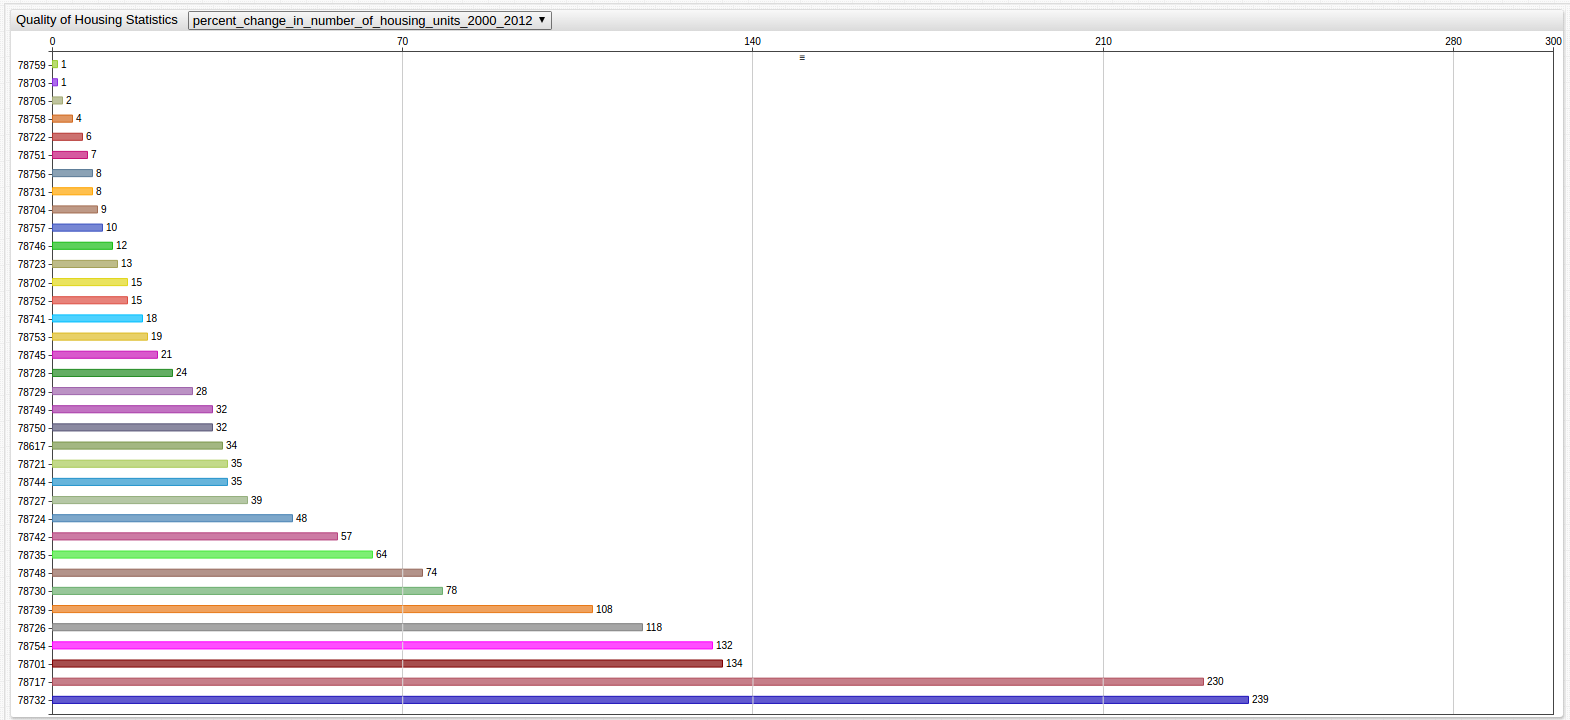
Use the drop-down list to toggle between metrics
Return to the Index