Bank of Israel Debt, 1997-2016
ChartLab and SQL Console in ATSD
Data Source: Bank of Israel
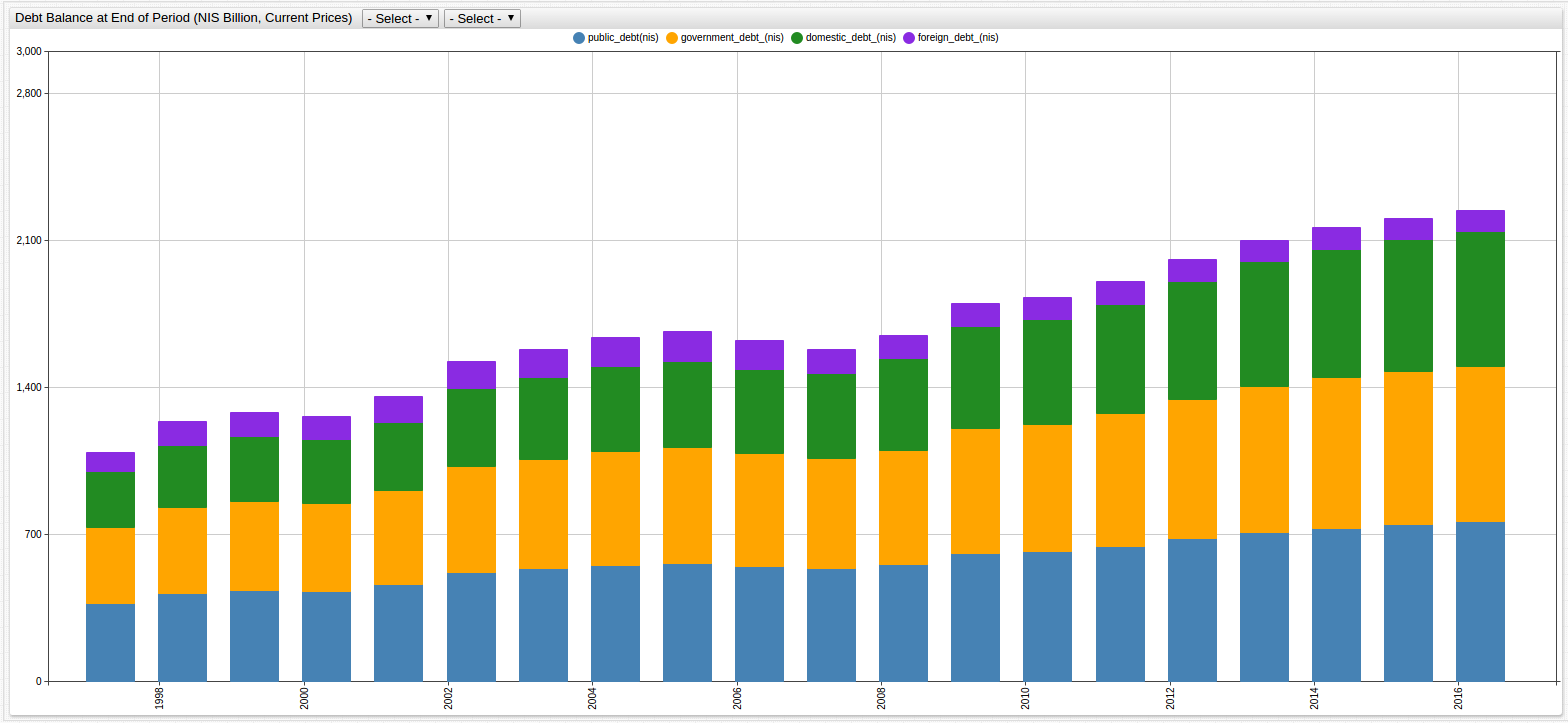
Debt Balances (NIS Billion, current value)

SELECT date_format(time, 'yyyy') AS "Date", pd.value AS "Public Debt", gd.value AS "Government Debt", dd.value AS "Domestic Debt", fd.value AS "Foreign Debt"
  FROM "public_debt(nis)" AS pd JOIN "government_debt_(nis)" AS gd JOIN "domestic_debt_(nis)" AS dd JOIN "foreign_debt_(nis)" AS fd
GROUP BY 'Date', pd.value, gd.value, dd.value, fd.value
  ORDER BY 'Date'
| Date | Public Debt | Government Debt | Domestic Debt | Foreign Debt |
|---|---|---|---|---|
| 1997 | 372 | 360 | 268 | 92 |
| 1998 | 421 | 409 | 295 | 114 |
| 1999 | 435 | 422 | 308 | 115 |
| 2000 | 429 | 417 | 305 | 112 |
| 2001 | 460 | 448 | 326 | 121 |
| 2002 | 517 | 504 | 372 | 132 |
| 2003 | 536 | 523 | 390 | 133 |
| 2004 | 554 | 541 | 403 | 138 |
| 2005 | 564 | 551 | 407 | 145 |
| 2006 | 549 | 536 | 402 | 135 |
| 2007 | 536 | 523 | 405 | 118 |
| 2008 | 557 | 545 | 437 | 108 |
| 2009 | 608 | 596 | 486 | 110 |
| 2010 | 618 | 606 | 502 | 103 |
| 2011 | 644 | 631 | 521 | 110 |
| 2012 | 679 | 666 | 559 | 107 |
| 2013 | 709 | 696 | 596 | 100 |
| 2014 | 729 | 716 | 610 | 106 |
| 2015 | 746 | 728 | 629 | 99 |
| 2016 | 760 | 740 | 643 | 97 |
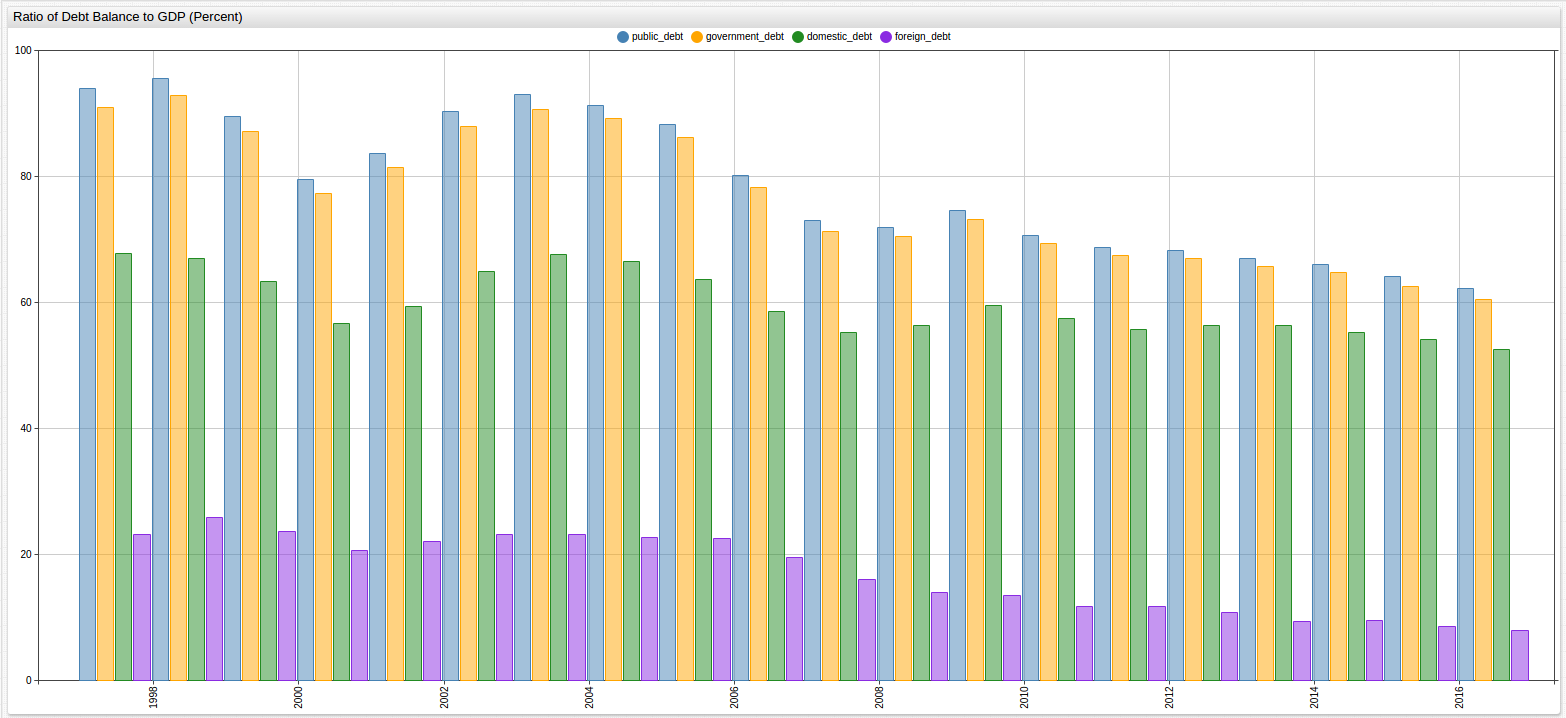
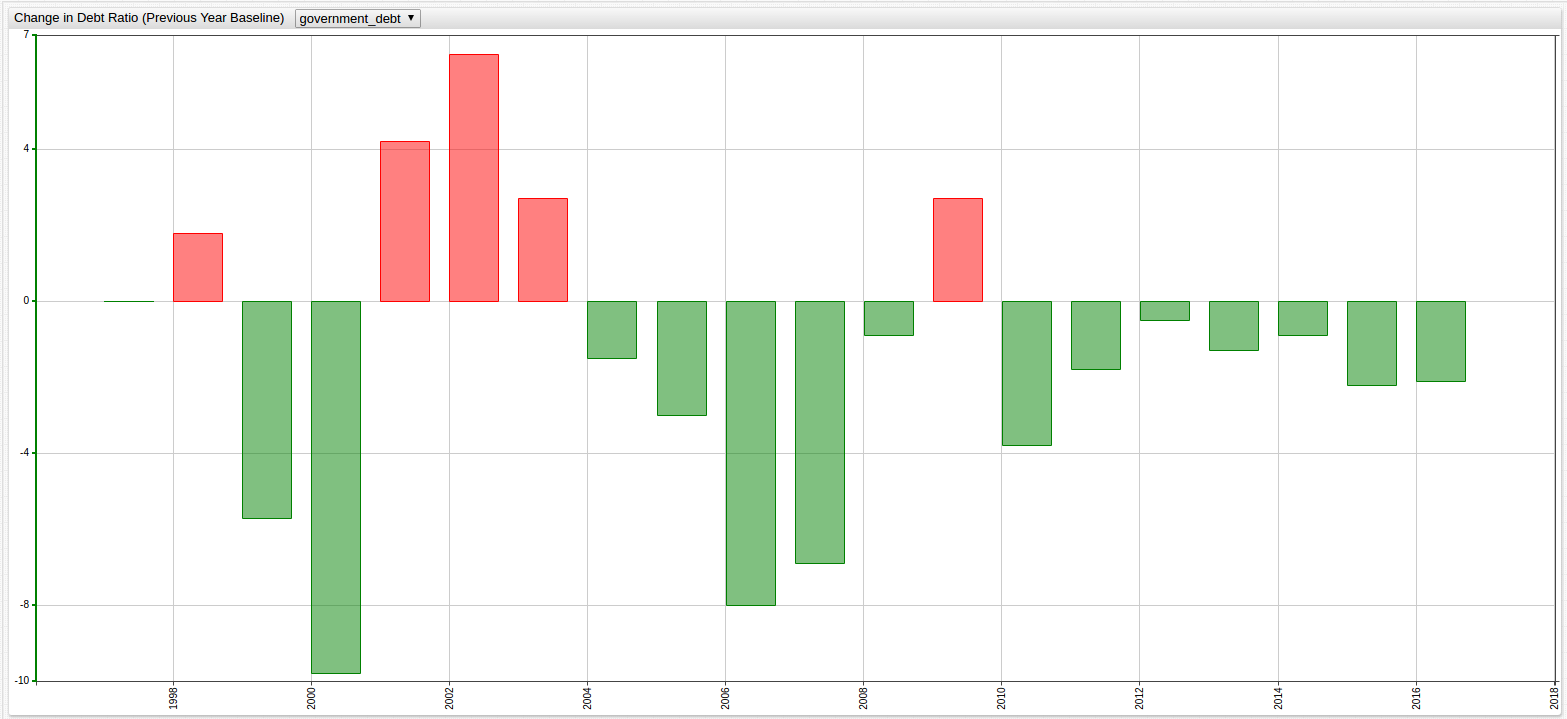
Debt Balances as Percent GDP
SELECT date_format(time, 'yyyy') AS "Date", pd.value AS "Public Debt Percent GDP", gd.value AS "Government Debt Percent GDP", dd.value AS "Domestic Debt Percent GDP", fd.value AS "Foreign Debt Percent GDP"
  FROM "public_debt" AS pd JOIN "government_debt" AS gd JOIN "domestic_debt" AS dd JOIN "foreign_debt" AS fd
GROUP BY 'Date', pd.value, gd.value, dd.value, fd.value
  ORDER BY 'Date'
| Date | Public Debt Percent GDP | Government Debt Percent GDP | Domestic Debt Percent GDP | Foreign Debt Percent GDP |
|---|---|---|---|---|
| 1997 | 94 | 91 | 68 | 23 |
| 1998 | 96 | 93 | 67 | 26 |
| 1999 | 90 | 87 | 63 | 24 |
| 2000 | 80 | 77 | 57 | 21 |
| 2001 | 84 | 82 | 59 | 22 |
| 2002 | 90 | 88 | 65 | 23 |
| 2003 | 93 | 91 | 68 | 23 |
| 2004 | 91 | 89 | 66 | 23 |
| 2005 | 88 | 86 | 64 | 23 |
| 2006 | 80 | 78 | 59 | 20 |
| 2007 | 73 | 71 | 55 | 16 |
| 2008 | 72 | 70 | 56 | 14 |
| 2009 | 75 | 73 | 60 | 14 |
| 2010 | 71 | 69 | 58 | 12 |
| 2011 | 69 | 68 | 56 | 12 |
| 2012 | 68 | 67 | 56 | 11 |
| 2013 | 67 | 66 | 56 | 9 |
| 2014 | 66 | 65 | 55 | 10 |
| 2015 | 64 | 63 | 54 | 8 |
| 2016 | 62 | 60 | 53 | 8 |
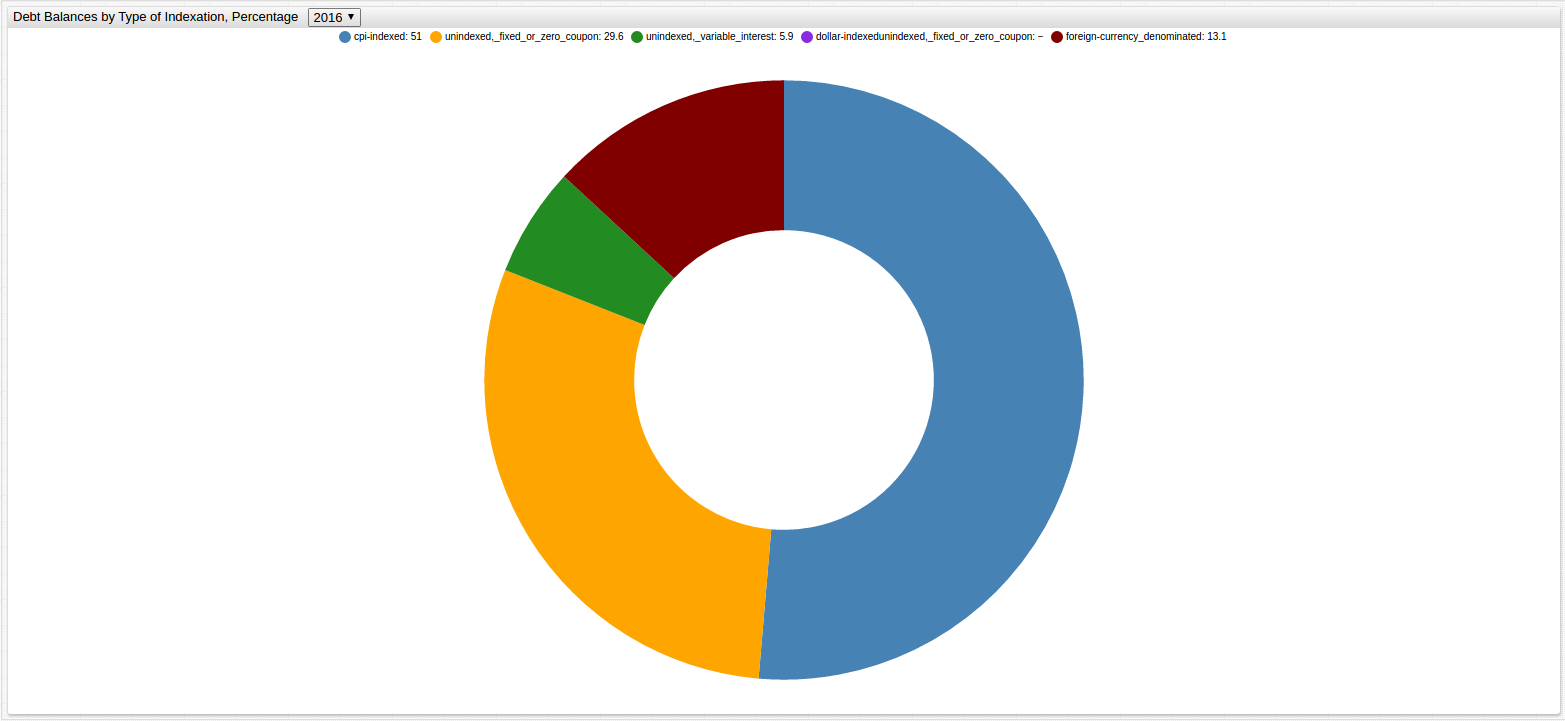
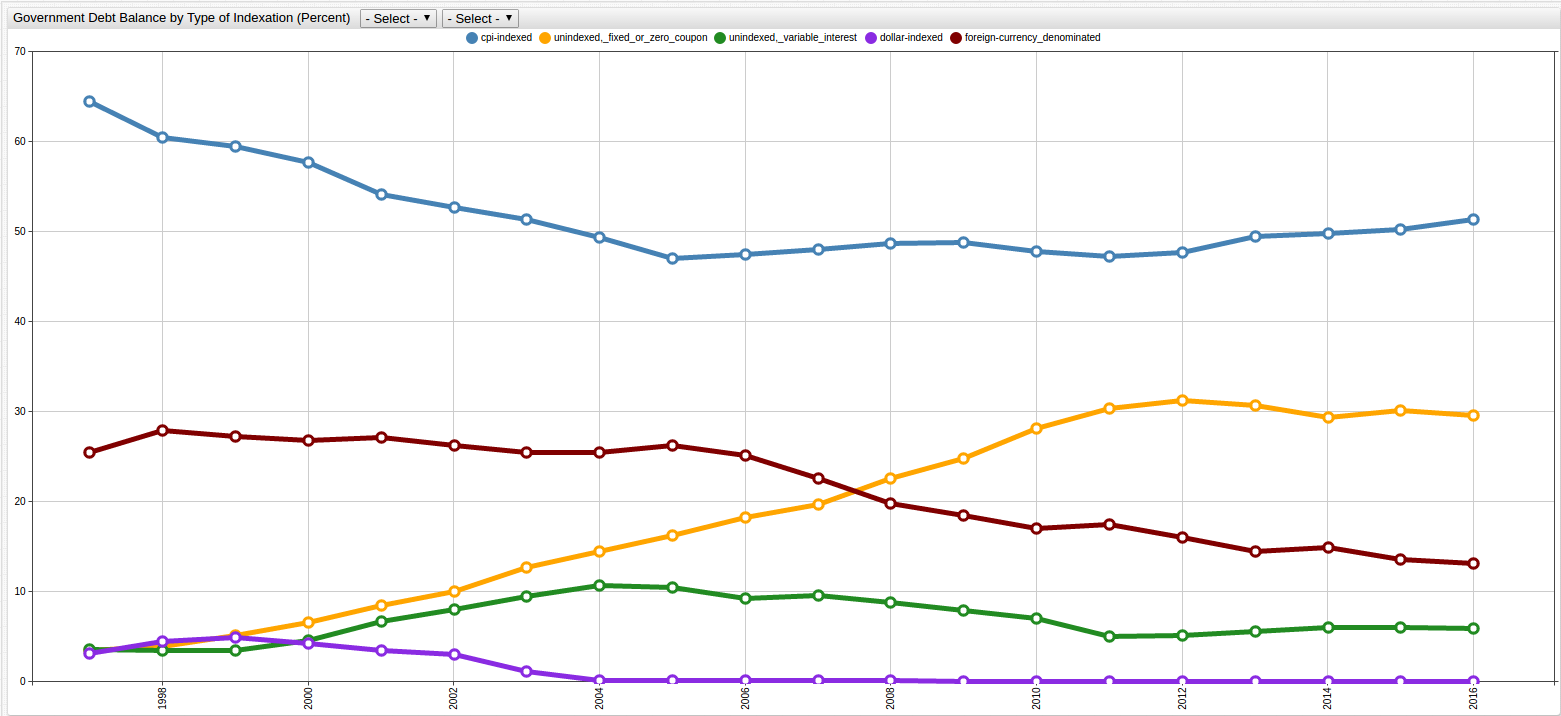
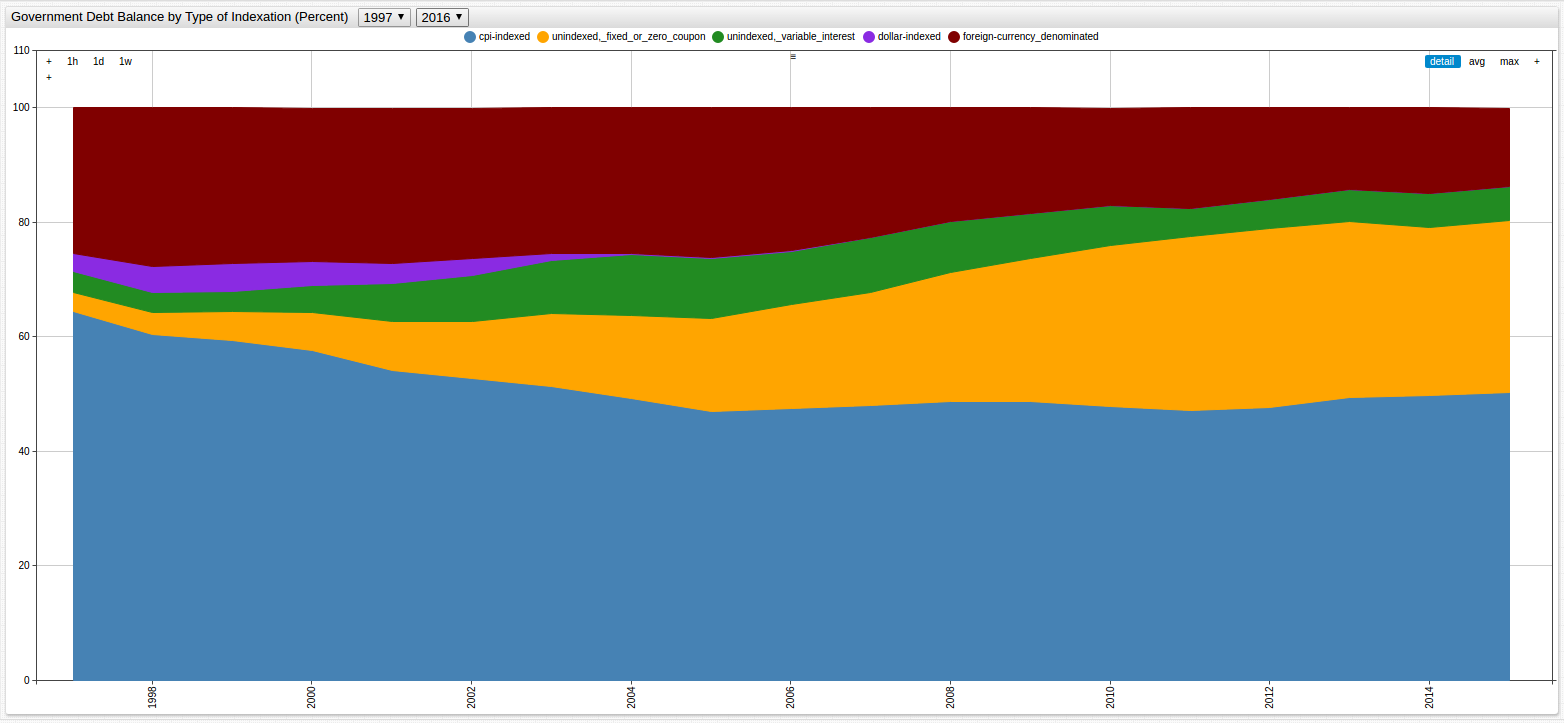
Government Debt Balance by Type of Indexation
SELECT date_format(time, 'yyyy') AS "Date", cpi.value AS "CPI-Indexed", ui1.value AS "Unindexed, Fixed or Zero", ui2.value AS "Unindexed, Variable", di.value AS "Dollar-Indexed", fcd.value AS "Foreign-Currency Denominated"
  FROM "cpi-indexed" AS cpi JOIN "unindexed,_fixed_or_zero_coupon" AS ui1 JOIN "unindexed,_variable_interest" AS ui2 JOIN "dollar-indexed" AS di JOIN "foreign-currency_denominated" AS fcd
GROUP BY 'Date', cpi.value, ui1.value, ui2.value, di.value, fcd.value
  ORDER BY 'Date'
| Date | CPI-Indexed | Unindexed, Fixed or Zero | Unindexed, Variable | Dollar-Indexed | Foreign-Currency Denominated |
|---|---|---|---|---|---|
| 1997 | 64 | 3 | 4 | 3 | 26 |
| 1998 | 60 | 4 | 3 | 4 | 28 |
| 1999 | 59 | 5 | 3 | 5 | 27 |
| 2000 | 58 | 7 | 5 | 4 | 27 |
| 2001 | 54 | 8 | 7 | 4 | 27 |
| 2002 | 53 | 10 | 8 | 3 | 26 |
| 2003 | 51 | 13 | 9 | 1 | 26 |
| 2004 | 49 | 14 | 11 | 0 | 26 |
| 2005 | 47 | 16 | 10 | 0 | 26 |
| 2006 | 48 | 18 | 9 | 0 | 25 |
| 2007 | 48 | 20 | 10 | 0 | 23 |
| 2008 | 49 | 23 | 9 | 0 | 20 |
| 2009 | 49 | 25 | 8 | 0 | 18 |
| 2010 | 48 | 28 | 7 | 0 | 17 |
| 2011 | 47 | 30 | 5 | 0 | 18 |
| 2012 | 48 | 31 | 5 | 0 | 16 |
| 2013 | 49 | 31 | 6 | 0 | 14 |
| 2014 | 50 | 29 | 6 | 0 | 15 |
| 2015 | 50 | 30 | 6 | 0 | 14 |
| 2016 | 51 | 30 | 6 | 0 | 13 |