Calls May be Recorded for Quality or Training Purposes
Introduction
The all too familiar notification that your phone call to almost any call center in the world is being recorded has been heard by enough people enough times that it is probably forgotten almost as quickly as it is processed. But that has not stopped data analysts who work for the companies that operate these call centers from improving customer outcomes with these and other data that they record about client experiences.
One of the first obstacles to maintaining a successful call center is the ability to connect clients to an operator in a timely manner, never mind the companies now trying to use personality metrics to connect clients to a similar operator or one they predict meshes with the customer. A low call response time is essential to starting client interactions off on the right foot and sets the tone for the entire interaction.
But what exactly is a low response time? How long is the average person willing to wait on hold before speaking to someone on the other line?
Methodology
Using public call center data from the San Francisco Health Service System, which is an insurance provider to city employees, elected officials, and their families, call abandonment rates can be compared to call response times to establish baselines for call center performance and customer patience thresholds. These data are visualized in ChartLab and dissected with SQL Console in ATSD to calculate concrete wait times that are likely to result in an abandoned call.
Data
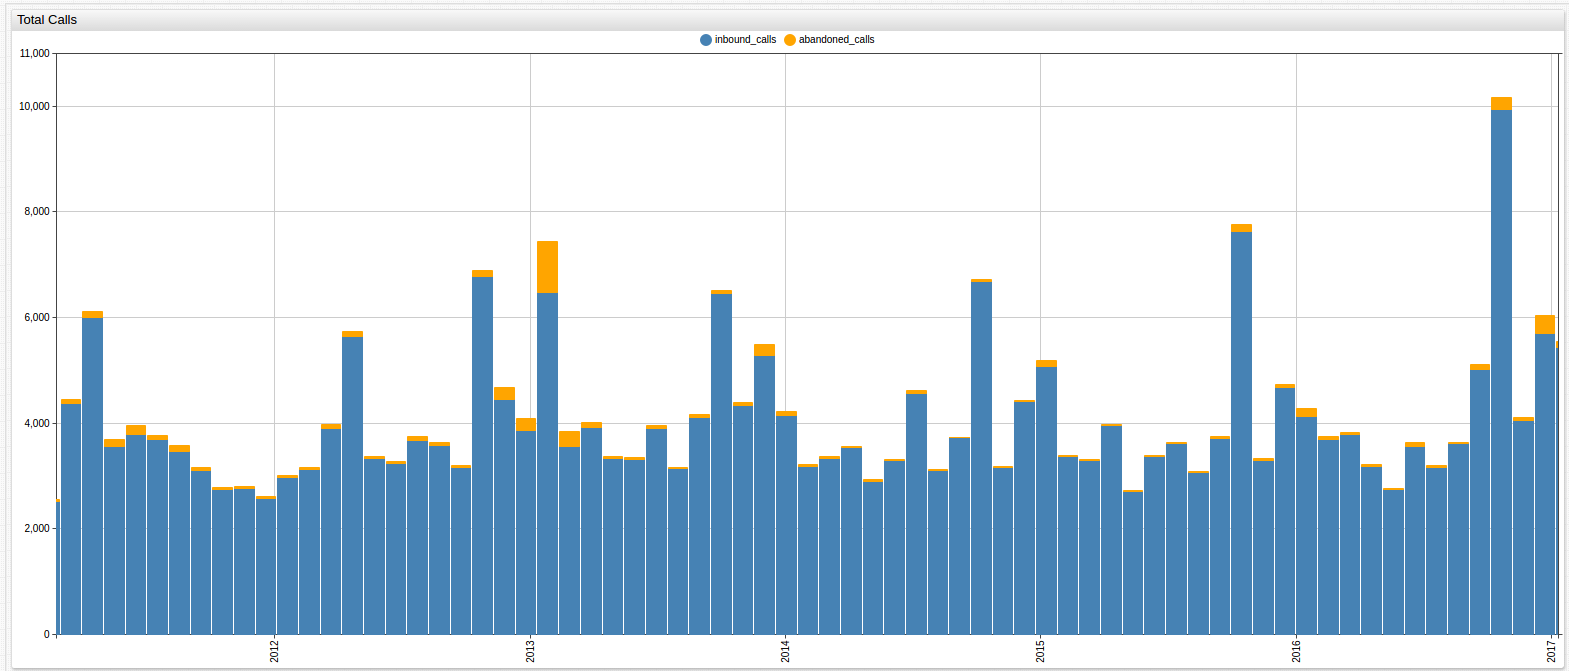

The visualization above shows the total number of calls received by the Health Service System over the entire observed period, which began in January 2011 and continues until June 2017. Abandoned calls are shown in orange. Retrieve data using the query below. See the complete dataset in the Appendix.
SELECT datetime AS "Date", ibc.value AS "Inbound Calls", abc.value AS "Abandoned Calls", car.value AS "Abandonment Rate"
  FROM "inbound_calls" AS ibc JOIN "abandoned_calls" AS abc JOIN "call_abandonment_rate" AS car
| Date       | Inbound Calls | Abandoned Calls | Abandonment Rate |
|------------|---------------|-----------------|------------------|
| 2017-01-01 | 5438          | 105             | 1.9              |
| 2017-02-01 | 4122          | 53              | 1.3              |
| 2017-03-01 | 4521          | 33              | 0.7              |
| 2017-04-01 | 3084          | 29              | 0.9              |
| 2017-05-01 | 3402          | 28              | 0.8              |
| 2017-06-01 | 3425          | 65              | 1.9              |
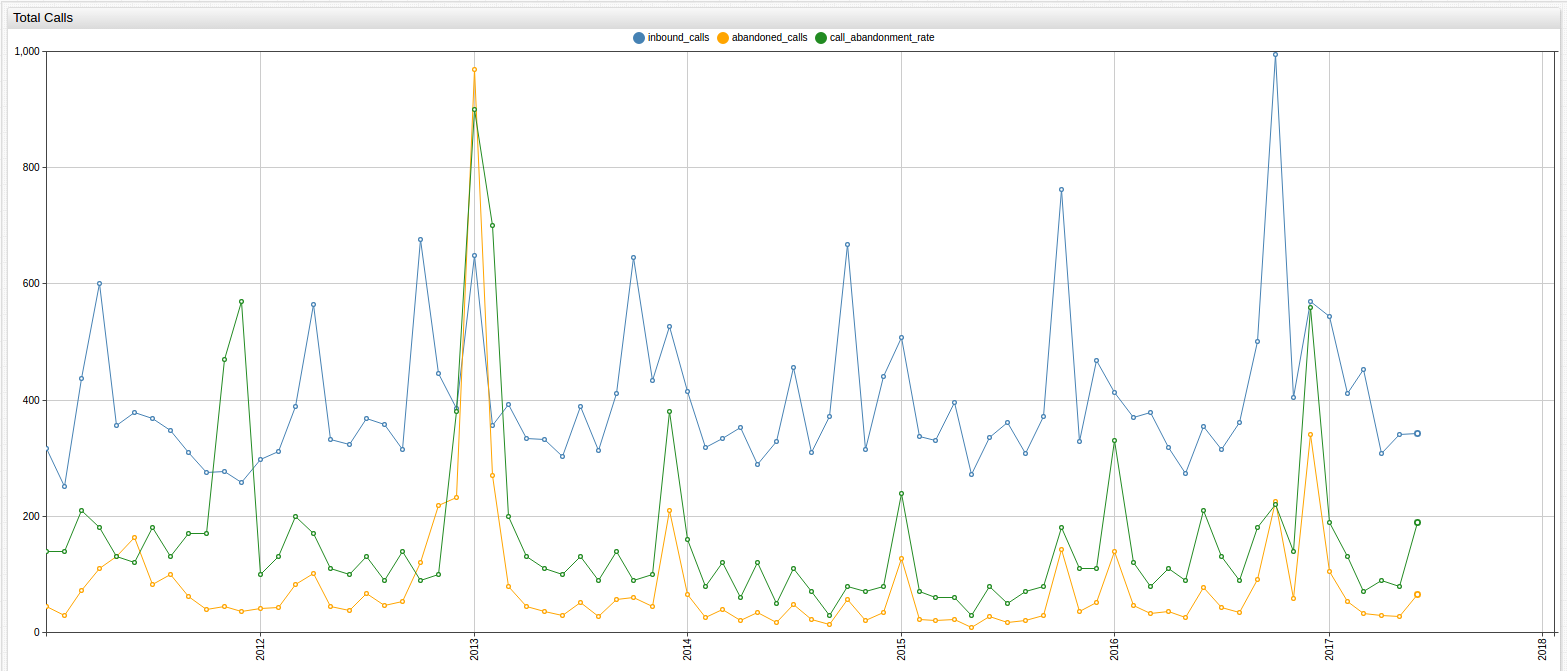
When scaled appropriately, the relationships between the three values contained in the above visualization are noticeable. Although tempting to conclude that an increased call volume immediately results in an increased call abandonment rate, which is simply the calculated percent of total calls that are abandoned, is an invalid oversimplification.
Scale Modifications:
inbound_calls = value/10call abandonment rate = value*100
To learn more about ad hoc data modification in ChartLab, see Charts Documentation.
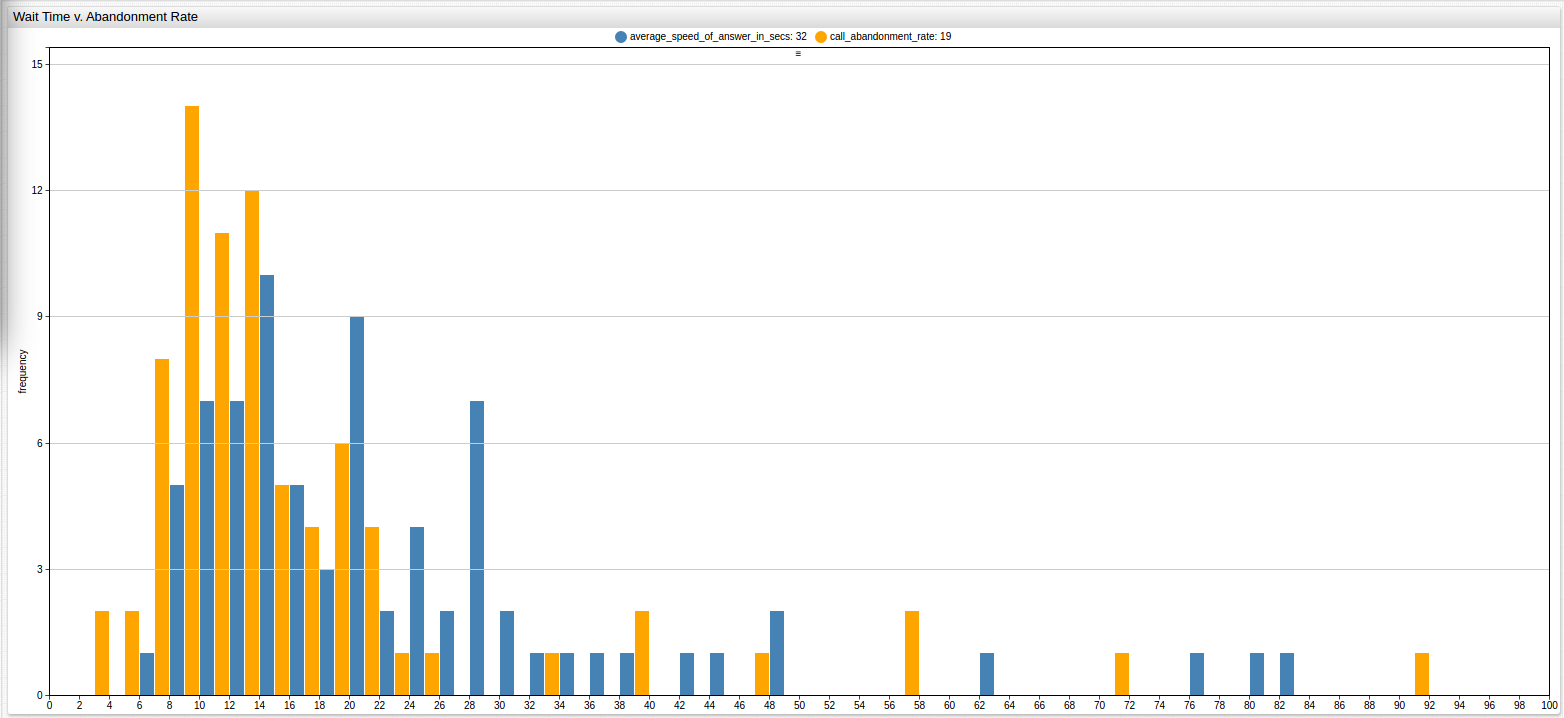
Although an increased call volume results in increased abandonment rates several times throughout the observed period, several local maxima in call volume are not matched by a corresponding maxima in abandoned calls. The visualization below compares call wait time to call abandonment rate.
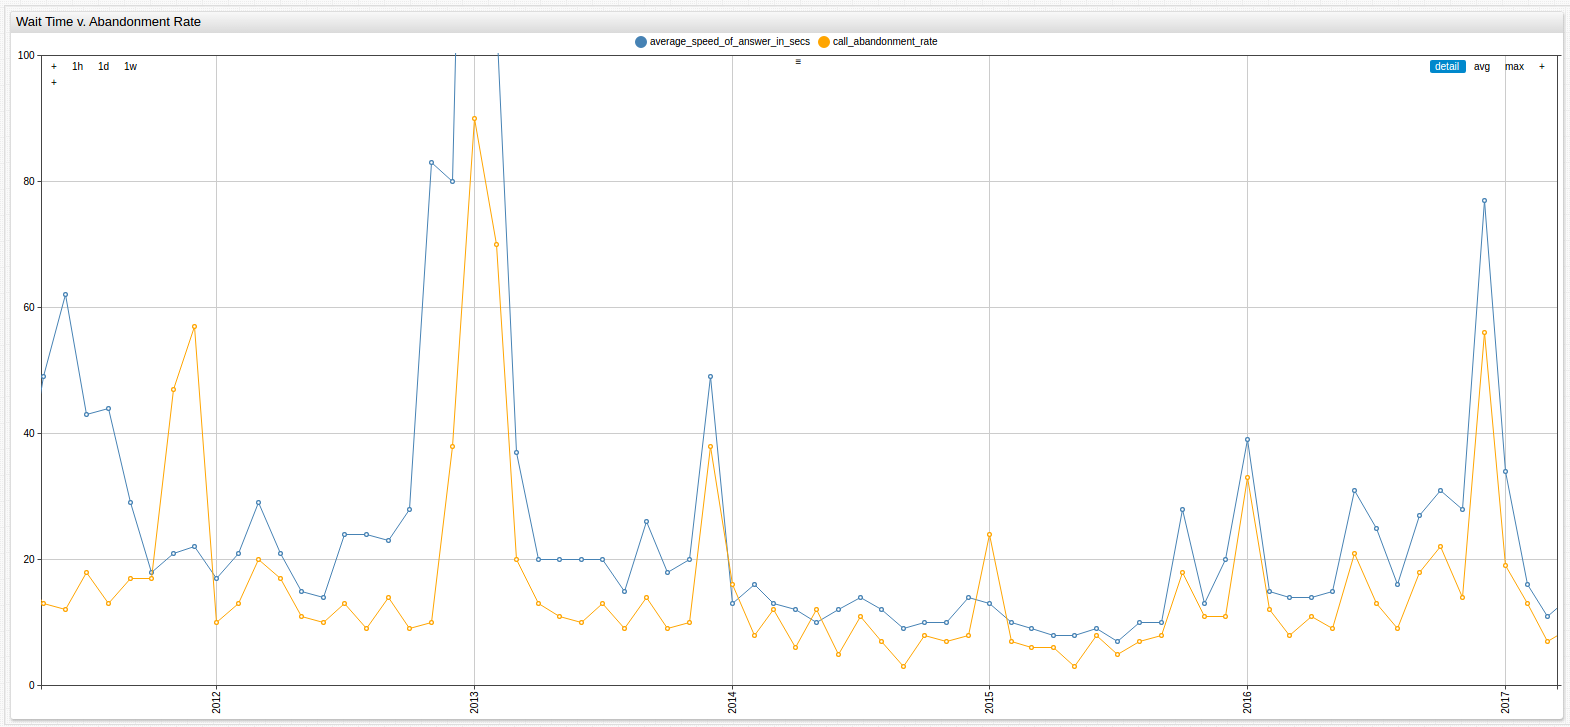
The scale of this visualization has been intentionally modified to exclude the 2013 absolute maxima to avoid distorting the rest of the data.
call_abandonment_rate = value*100
There is a visible relationship between call wait time and call abandonment rate. The associated SQL query is below:
SELECT datetime AS "Date", car.value AS "Call Abandonment Rate", ROUND(cwt.value, 0) AS "Call Wait Time"
  FROM "call_abandonment_rate" AS car JOIN "average_speed_of_answer_in_secs" AS cwt
| Date       | Call Abandonment Rate | Call Wait Time |
|------------|-----------------------|----------------|
| 2016-12-01 | 5.6                   | 77             |
| 2017-01-01 | 1.9                   | 34             |
| 2017-02-01 | 1.3                   | 16             |
| 2017-03-01 | 0.7                   | 11             |
| 2017-04-01 | 0.9                   | 14             |
| 2017-05-01 | 0.8                   | 16             |
| 2017-06-01 | 1.9                   | 32             |
View the complete result set in the Appendix
Analysis
The figures below visualize the information as a distribution table to highlight median values of the above data. The first visualization applies the same scale modification as above, while the second has no scale modification.
Scale Modification:
call_abandonment rate = value*10
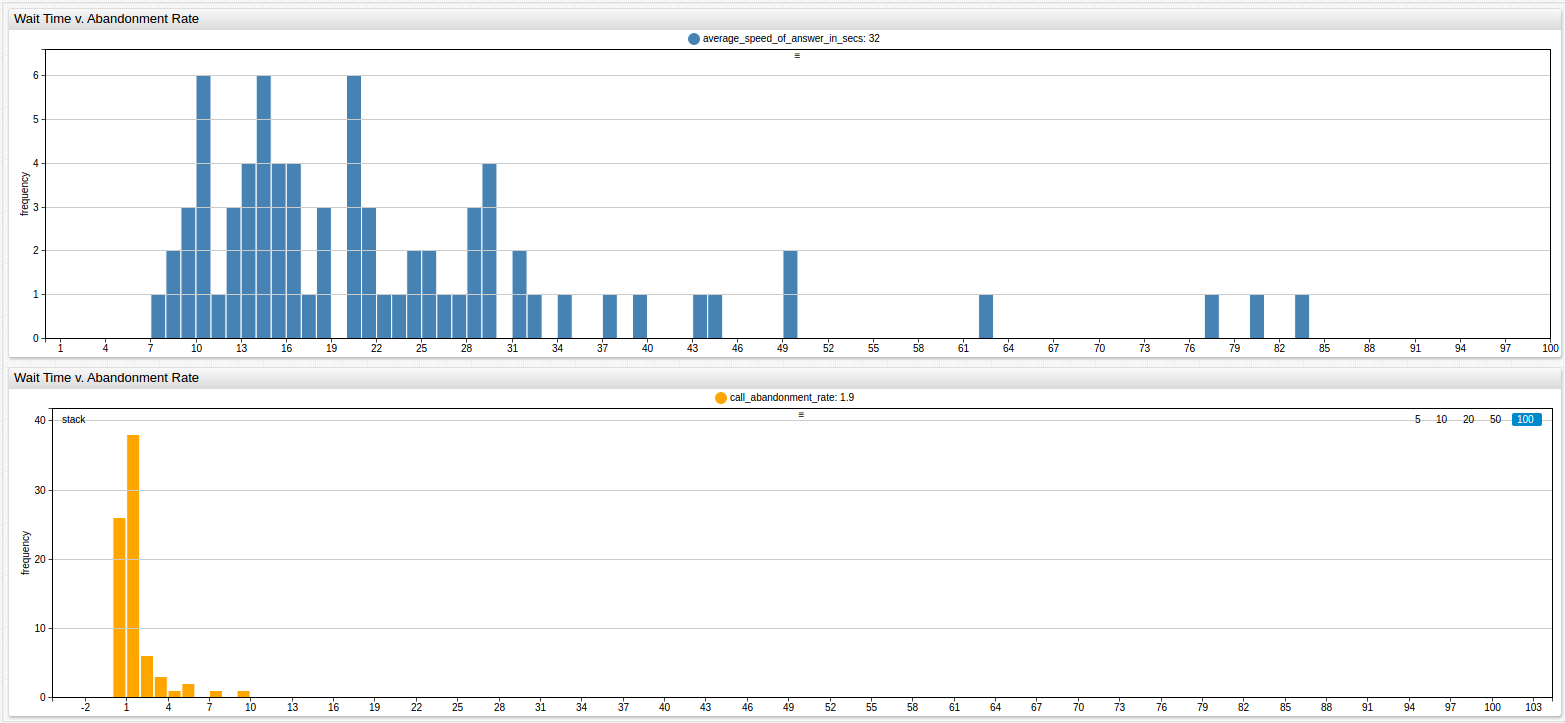
The relatively small deviation in wait times is highlighted by the tight concentration of bars on the lower graph. That data, along with call abandonment rate, are further analyzed below.
SELECT date_format(time, 'yyyy') AS 'Date', AVG(value) AS 'Call Wait Time by Year'
  FROM 'average_speed_of_answer_in_secs'
GROUP BY date_format(time, 'yyyy')
| Date | Call Wait Time by Year |
|---|---|
| 2011 | 32.4 |
| 2012 | 31.6 |
| 2013 | 47.9 |
| 2014 | 12.1 |
| 2015 | 12.1 |
| 2016 | 27.7 |
| 2017 | 20.5 |
Overall average wait time: 26.3 seconds
SELECT date_format(time, 'yyyy') AS "Date", AVG(value) AS "Average Call Abandonment Rate"
  FROM "call_abandonment_rate"
GROUP BY date_format(time, 'yyyy')
| Date | Average Call Abandonment Rate |
|---|---|
| 2011 | 2.2 |
| 2012 | 1.4 |
| 2013 | 2.6 |
| 2014 | 0.9 |
| 2015 | 0.9 |
| 2016 | 1.9 |
| 2017 | 1.2 |
Overall average call abandonment rate: 1.6
The values are ranked, shown outside the table.
To preserve 2016 and 2017 data as holdout data, the values used for modeling exclude 2016 and 2017 data. The new baseline values are shown below:
| Metric | Baseline |
|---|---|
| Wait Time | 32.1 seconds |
| Abandonment Rate | 1.56% |
Reviewing the training data, the first three instances of above 32 second wait times show below average abandonment rates,
indicating a need to adjust the threshold up from the average. In practical terms that means that on average, a person is
willing to wait at least the average wait time before hanging up. However such an adjustment would be passively accepting a 1.56% call abandonment rate as normal and rarely are successful businesses content with the average. The alternative method is to adjust the abandonment rate down and establish a less-than-average call wait time that meets the selected target abandonment rate criteria. Both methods are pursued below.
Model 1: Maintain Abandonment Rate <= 1.56%
Suppose a company is content to maintain the 1.56% call abandonment rate and is simply interested in finding the typical
wait limit of the average client before their call is fielded or abandoned. By averaging the wait time for only months which demonstrated a call abandonment rate of greater than 1.56% with this query:
SELECT datetime AS "Date", car.value AS "Call Abandonment Rate", cat.value AS "Call Wait Time"
  FROM "call_abandonment_rate" AS car JOIN "average_speed_of_answer_in_secs" AS cat WHERE car.value > 1.56 AND datetime < '2016-01-01 00:00:00'
| Date       | Call Abandonment Rate | Call Wait Time |
|------------|-----------------------|----------------|
| 2011-03-01 | 2.1                   | 29             |
| 2011-04-01 | 1.8                   | 29             |
| 2011-07-01 | 1.8                   | 43             |
| 2011-09-01 | 1.7                   | 29             |
| 2011-10-01 | 1.7                   | 18             |
| 2011-11-01 | 4.7                   | 21             |
| 2011-12-01 | 5.7                   | 22             |
| 2012-03-01 | 2                     | 29             |
| 2012-04-01 | 1.7                   | 21             |
| 2012-12-01 | 3.8                   | 80*            |
| 2013-01-01 | 9                     | 224*           |
| 2013-02-01 | 7                     | 106*           |
| 2013-03-01 | 2                     | 37             |
| 2013-12-01 | 3.8                   | 49             |
| 2014-01-01 | 1.6                   | 13             |
| 2015-01-01 | 2.4                   | 13             |
| 2015-10-01 | 1.8                   | 28             |
*Values greater than twice the average wait time are be counted as
64.2seconds, twice the average.
Adjusted average wait time: 33.7 seconds
The training data is visualized below with an alert-expression
included to highlight those months where the call abandonment rate exceeded 1.56%.
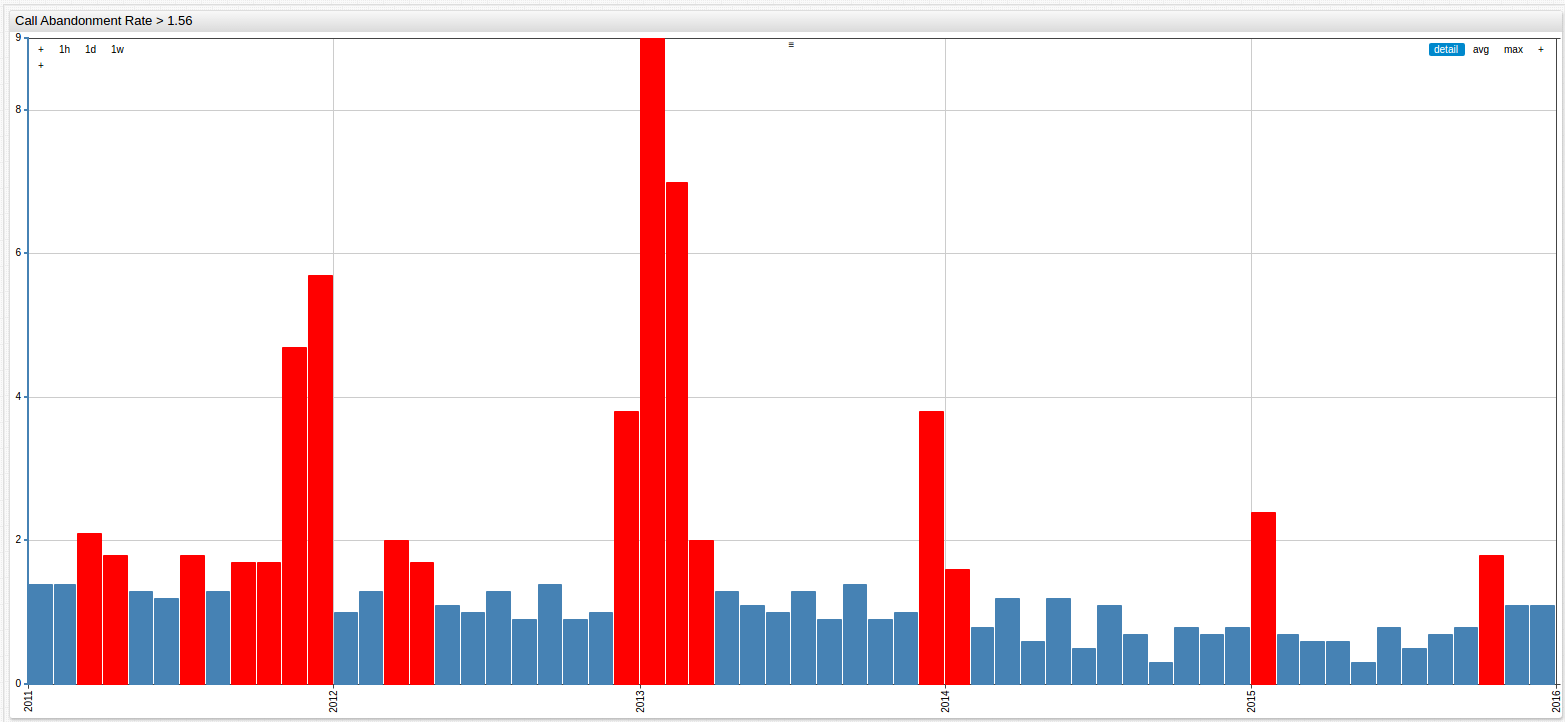
The adjusted average wait time value acts as the threshold by which the 1.56% call abandonment rate may be successfully
maintained and be tested below in the Validation section.
Model 2: Achieve Abandonment Rate <= 1.00%
Suppose the goal of the Health Service System is to have a call abandonment rate no higher than 1%. What is the longest tolerable
wait time before one can be reasonably sure the call is abandoned? The following SQL query summons all instances in the
training data of a call abandonment rate less than or equal to 1%:
SELECT datetime AS "Date", car.value AS "Call Abandonment Rate", cat.value AS "Call Wait Time"
  FROM "call_abandonment_rate" AS car JOIN "average_speed_of_answer_in_secs" AS cat WHERE car.value <= 1 AND datetime < '2016-01-01 00:00:00'
| Date       | Call Abandonment Rate | Call Wait Time |
|------------|-----------------------|----------------|
| 2012-01-01 | 1                     | 17             |
| 2012-06-01 | 1                     | 14             |
| 2012-08-01 | 0.9                   | 24             |
| 2012-10-01 | 0.9                   | 28             |
| 2012-11-01 | 1                     | 83*            |
| 2013-06-01 | 1                     | 20             |
| 2013-08-01 | 0.9                   | 15             |
| 2013-10-01 | 0.9                   | 18             |
| 2013-11-01 | 1                     | 20             |
| 2014-02-01 | 0.8                   | 16             |
| 2014-04-01 | 0.6                   | 12             |
| 2014-06-01 | 0.5                   | 12             |
| 2014-08-01 | 0.7                   | 12             |
| 2014-09-01 | 0.3                   | 9              |
| 2014-10-01 | 0.8                   | 10             |
| 2014-11-01 | 0.7                   | 10             |
| 2014-12-01 | 0.8                   | 14             |
| 2015-02-01 | 0.7                   | 10             |
| 2015-03-01 | 0.6                   | 9              |
| 2015-04-01 | 0.6                   | 8              |
| 2015-05-01 | 0.3                   | 8              |
| 2015-06-01 | 0.8                   | 9              |
| 2015-07-01 | 0.5                   | 7              |
| 2015-08-01 | 0.7                   | 10             |
| 2015-09-01 | 0.8                   | 10             |
*Values greater than twice the average wait time are counted as
64.2, twice the average.
Adjusted average wait time: 15.5 seconds
The training data is visualized below with an alert-expression
included to highlight those months where the call abandonment rate did not exceed 1.00%.
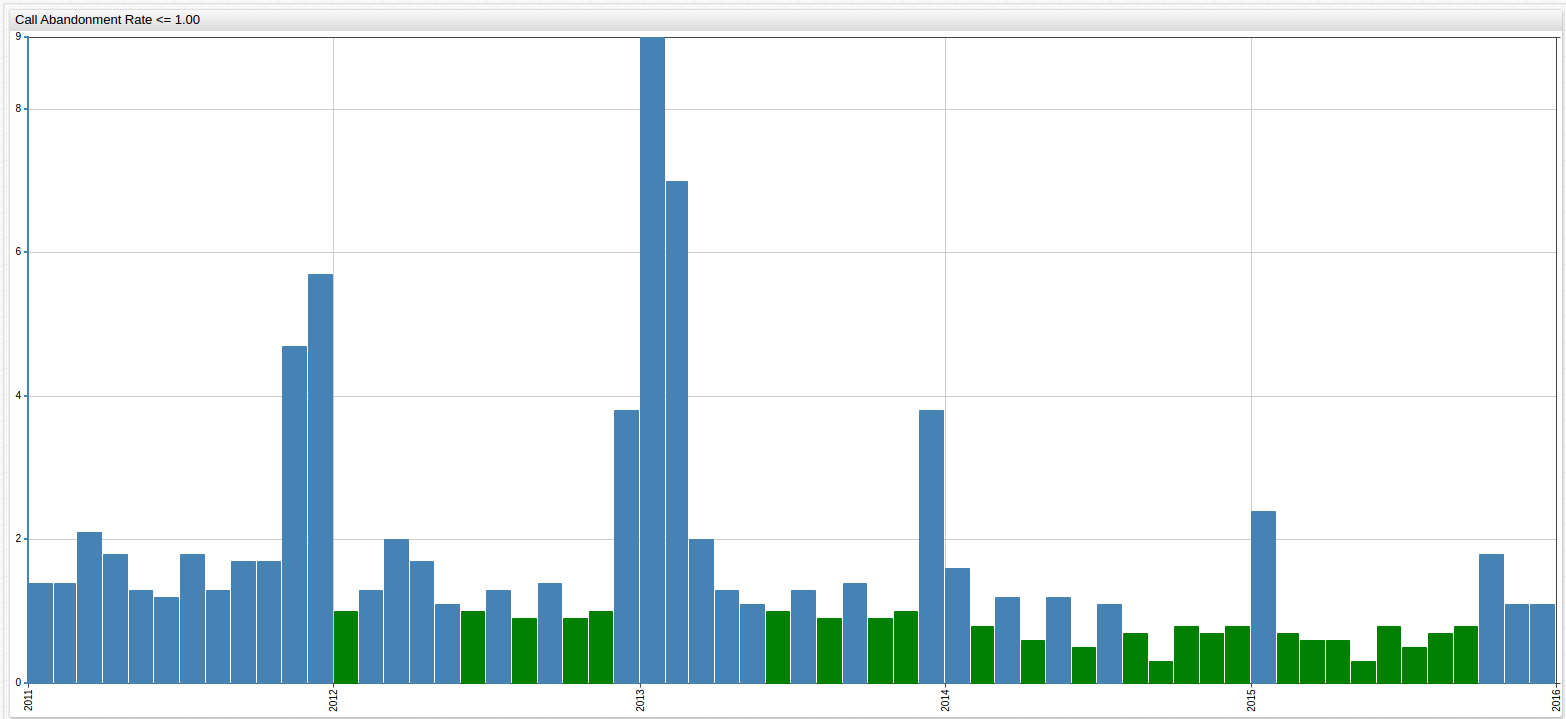
The adjusted average wait time value acts as the threshold by which the 1.00% call abandonment rate may be successfully
achieved and tested in the Validation section.
Validation
| Model Number and Goal | Wait Time (t) Threshold |
|---|---|
Model 1: Maintain 1.56% CAR | t <= 34 seconds |
Model 2: Achieve 1.00% CAR | t <= 16 seconds |
The following SQL query returns the holdout data to test the above thresholds:
SELECT datetime AS "Date", car.value AS "Call Abandonment Rate", cat.value AS "Call Wait Time"
  FROM "call_abandonment_rate" AS car JOIN "average_speed_of_answer_in_secs" AS cat WHERE datetime >= '2016-01-01 00:00:00'
| Date       | Call Abandonment Rate | Call Wait Time |
|------------|-----------------------|----------------|
| 2016-01-01 | 3.3                   | 39             |
| 2016-02-01 | 1.2                   | 15             |
| 2016-03-01 | 0.8                   | 14             |
| 2016-04-01 | 1.1                   | 14             |
| 2016-05-01 | 0.9                   | 15             |
| 2016-06-01 | 2.1                   | 31             |
| 2016-07-01 | 1.3                   | 25             |
| 2016-08-01 | 0.9                   | 16             |
| 2016-09-01 | 1.8                   | 27             |
| 2016-10-01 | 2.2                   | 31             |
| 2016-11-01 | 1.4                   | 28             |
| 2016-12-01 | 5.6                   | 77             |
| 2017-01-01 | 1.9                   | 34             |
| 2017-02-01 | 1.3                   | 16             |
| 2017-03-01 | 0.7                   | 11             |
| 2017-04-01 | 0.9                   | 14             |
| 2017-05-01 | 0.8                   | 16             |
| 2017-06-01 | 1.9                   | 32             |
To create confusion matrices, this table details true positives (p,t), true negatives (n,t), false positives (p,t), and false negatives (n,f): Confusion Matrices
| Model | (p,t) | (n,t) | (p,f) | (n,f) |
|---|---|---|---|---|
1 | 3 | 11 | 0 | 4 |
2 | 9 | 7 | 2 | 0 |
Error Rates
| Model | Probability (p,t) | Probability (n,t) | Probability (p,f) | Probability (n,f) | Total Error Probability |
|---|---|---|---|---|---|
1 | .167 | .611 | 0 | .222 | .222 |
2 | .5 | .389 | .111 | 0 | .111 |
Accuracy
| Model | Accuracy |
|---|---|
| 1 | 77.78% |
| 2 | 88.89% |
Conclusions
Wait time threshold analysis is a common practice among businesses that operate call centers, and has become standard practice for determining staffing and infrastructure requirements. With additional data such as average call time for example, an analyst could determine the amount of time that any given call is likely to take, and then cross reference call volume numbers to staff numbers to determine the capacity of the call center at any given time and make informed decisions about times to increase or decrease operator numbers based on the results. Determining thresholds of caller patience is an essential first step in streamlining a workflow and demonstrates the intrinsic value of maintaining detailed operations data.
Seeing the different kinds of business optimization possible from easy to collect data such as these, corporate motivations to employ analysts and implement data solutions capable of increasing overall profitability are not simply understandable, but required to maintain a competitive edge.
Appendix
Call Abandonment Data
| Date | Inbound Calls | Abandoned Calls | Abandonment Rate |
|---|---|---|---|
| 2011-01-01 | 3171 | 45 | 1.4 |
| 2011-02-01 | 2520 | 30 | 1.4 |
| 2011-03-01 | 4379 | 72 | 2.1 |
| 2011-04-01 | 6009 | 110 | 1.8 |
| 2011-05-01 | 3559 | 130 | 1.3 |
| 2011-06-01 | 3790 | 164 | 1.2 |
| 2011-07-01 | 3685 | 82 | 1.8 |
| 2011-08-01 | 3472 | 100 | 1.3 |
| 2011-09-01 | 3101 | 62 | 1.7 |
| 2011-10-01 | 2752 | 40 | 1.7 |
| 2011-11-01 | 2763 | 45 | 4.7 |
| 2011-12-01 | 2584 | 37 | 5.7 |
| 2012-01-01 | 2970 | 41 | 1 |
| 2012-02-01 | 3117 | 43 | 1.3 |
| 2012-03-01 | 3893 | 83 | 2 |
| 2012-04-01 | 5637 | 102 | 1.7 |
| 2012-05-01 | 3325 | 44 | 1.1 |
| 2012-06-01 | 3242 | 38 | 1 |
| 2012-07-01 | 3682 | 67 | 1.3 |
| 2012-08-01 | 3585 | 46 | 0.9 |
| 2012-09-01 | 3153 | 54 | 1.4 |
| 2012-10-01 | 6771 | 120 | 0.9 |
| 2012-11-01 | 4455 | 219 | 1 |
| 2012-12-01 | 3864 | 233 | 3.8 |
| 2013-01-01 | 6481 | 969 | 9 |
| 2013-02-01 | 3566 | 271 | 7 |
| 2013-03-01 | 3926 | 80 | 2 |
| 2013-04-01 | 3331 | 45 | 1.3 |
| 2013-05-01 | 3317 | 37 | 1.1 |
| 2013-06-01 | 3034 | 30 | 1 |
| 2013-07-01 | 3898 | 51 | 1.3 |
| 2013-08-01 | 3138 | 27 | 0.9 |
| 2013-09-01 | 4108 | 57 | 1.4 |
| 2013-10-01 | 6452 | 60 | 0.9 |
| 2013-11-01 | 4340 | 44 | 1 |
| 2013-12-01 | 5274 | 210 | 3.8 |
| 2014-01-01 | 4150 | 66 | 1.6 |
| 2014-02-01 | 3187 | 25 | 0.8 |
| 2014-03-01 | 3332 | 39 | 1.2 |
| 2014-04-01 | 3535 | 21 | 0.6 |
| 2014-05-01 | 2897 | 34 | 1.2 |
| 2014-06-01 | 3288 | 17 | 0.5 |
| 2014-07-01 | 4563 | 49 | 1.1 |
| 2014-08-01 | 3104 | 23 | 0.7 |
| 2014-09-01 | 3725 | 13 | 0.3 |
| 2014-10-01 | 6674 | 56 | 0.8 |
| 2014-11-01 | 3153 | 21 | 0.7 |
| 2014-12-01 | 4403 | 34 | 0.8 |
| 2015-01-01 | 5070 | 127 | 2.4 |
| 2015-02-01 | 3367 | 23 | 0.7 |
| 2015-03-01 | 3298 | 21 | 0.6 |
| 2015-04-01 | 3957 | 22 | 0.6 |
| 2015-05-01 | 2716 | 9 | 0.3 |
| 2015-06-01 | 3361 | 27 | 0.8 |
| 2015-07-01 | 3611 | 18 | 0.5 |
| 2015-08-01 | 3073 | 21 | 0.7 |
| 2015-09-01 | 3715 | 29 | 0.8 |
| 2015-10-01 | 7625 | 142 | 1.8 |
| 2015-11-01 | 3288 | 36 | 1.1 |
| 2015-12-01 | 4676 | 52 | 1.1 |
| 2016-01-01 | 4133 | 140 | 3.3 |
| 2016-02-01 | 3695 | 46 | 1.2 |
| 2016-03-01 | 3786 | 32 | 0.8 |
| 2016-04-01 | 3184 | 36 | 1.1 |
| 2016-05-01 | 2740 | 25 | 0.9 |
| 2016-06-01 | 3552 | 77 | 2.1 |
| 2016-07-01 | 3153 | 43 | 1.3 |
| 2016-08-01 | 3607 | 34 | 0.9 |
| 2016-09-01 | 5012 | 91 | 1.8 |
| 2016-10-01 | 9943 | 225 | 2.2 |
| 2016-11-01 | 4052 | 58 | 1.4 |
| 2016-12-01 | 5705 | 340 | 5.6 |
| 2017-01-01 | 5438 | 105 | 1.9 |
| 2017-02-01 | 4122 | 53 | 1.3 |
| 2017-03-01 | 4521 | 33 | 0.7 |
| 2017-04-01 | 3084 | 29 | 0.9 |
| 2017-05-01 | 3402 | 28 | 0.8 |
| 2017-06-01 | 3425 | 65 | 1.9 |
Call Wait Time and Call Abandonment Rate
| Date | Call Abandonment Rate | Call Wait Time |
|---|---|---|
| 2011-01-01 | 1.4 | 25 |
| 2011-02-01 | 1.4 | 18 |
| 2011-03-01 | 2.1 | 29 |
| 2011-04-01 | 1.8 | 29 |
| 2011-05-01 | 1.3 | 49 |
| 2011-06-01 | 1.2 | 62 |
| 2011-07-01 | 1.8 | 43 |
| 2011-08-01 | 1.3 | 44 |
| 2011-09-01 | 1.7 | 29 |
| 2011-10-01 | 1.7 | 18 |
| 2011-11-01 | 4.7 | 21 |
| 2011-12-01 | 5.7 | 22 |
| 2012-01-01 | 1 | 17 |
| 2012-02-01 | 1.3 | 21 |
| 2012-03-01 | 2 | 29 |
| 2012-04-01 | 1.7 | 21 |
| 2012-05-01 | 1.1 | 15 |
| 2012-06-01 | 1 | 14 |
| 2012-07-01 | 1.3 | 24 |
| 2012-08-01 | 0.9 | 24 |
| 2012-09-01 | 1.4 | 23 |
| 2012-10-01 | 0.9 | 28 |
| 2012-11-01 | 1 | 83 |
| 2012-12-01 | 3.8 | 80 |
| 2013-01-01 | 9 | 224 |
| 2013-02-01 | 7 | 106 |
| 2013-03-01 | 2 | 37 |
| 2013-04-01 | 1.3 | 20 |
| 2013-05-01 | 1.1 | 20 |
| 2013-06-01 | 1 | 20 |
| 2013-07-01 | 1.3 | 20 |
| 2013-08-01 | 0.9 | 15 |
| 2013-09-01 | 1.4 | 26 |
| 2013-10-01 | 0.9 | 18 |
| 2013-11-01 | 1 | 20 |
| 2013-12-01 | 3.8 | 49 |
| 2014-01-01 | 1.6 | 13 |
| 2014-02-01 | 0.8 | 16 |
| 2014-03-01 | 1.2 | 13 |
| 2014-04-01 | 0.6 | 12 |
| 2014-05-01 | 1.2 | 10 |
| 2014-06-01 | 0.5 | 12 |
| 2014-07-01 | 1.1 | 14 |
| 2014-08-01 | 0.7 | 12 |
| 2014-09-01 | 0.3 | 9 |
| 2014-10-01 | 0.8 | 10 |
| 2014-11-01 | 0.7 | 10 |
| 2014-12-01 | 0.8 | 14 |
| 2015-01-01 | 2.4 | 13 |
| 2015-02-01 | 0.7 | 10 |
| 2015-03-01 | 0.6 | 9 |
| 2015-04-01 | 0.6 | 8 |
| 2015-05-01 | 0.3 | 8 |
| 2015-06-01 | 0.8 | 9 |
| 2015-07-01 | 0.5 | 7 |
| 2015-08-01 | 0.7 | 10 |
| 2015-09-01 | 0.8 | 10 |
| 2015-10-01 | 1.8 | 28 |
| 2015-11-01 | 1.1 | 13 |
| 2015-12-01 | 1.1 | 20 |
| 2016-01-01 | 3.3 | 39 |
| 2016-02-01 | 1.2 | 15 |
| 2016-03-01 | 0.8 | 14 |
| 2016-04-01 | 1.1 | 14 |
| 2016-05-01 | 0.9 | 15 |
| 2016-06-01 | 2.1 | 31 |
| 2016-07-01 | 1.3 | 25 |
| 2016-08-01 | 0.9 | 16 |
| 2016-09-01 | 1.8 | 27 |
| 2016-10-01 | 2.2 | 31 |
| 2016-11-01 | 1.4 | 28 |
| 2016-12-01 | 5.6 | 77 |
| 2017-01-01 | 1.9 | 34 |
| 2017-02-01 | 1.3 | 16 |
| 2017-03-01 | 0.7 | 11 |
| 2017-04-01 | 0.9 | 14 |
| 2017-05-01 | 0.8 | 16 |
| 2017-06-01 | 1.9 | 32 |