Calculated Values with Schema-Based Parsing
Introduction
Data is not always recorded ideally for a given analysis. Perhaps the required metrics are not contained in a given file, or perhaps calculations must be performed upon the given data to arrive to a series which better suits current needs.
Schema-based parsing in ATSD supports modification upon import. Thus, working with any data in SQL Console or ChartLab is more meaningful. Using Bank of Israel foreign trade data as an example, this procedure is explained within this tutorial.
Data
Data Source: Central Bank of Israel
https://www.boi.org.il/en/DataAndStatistics
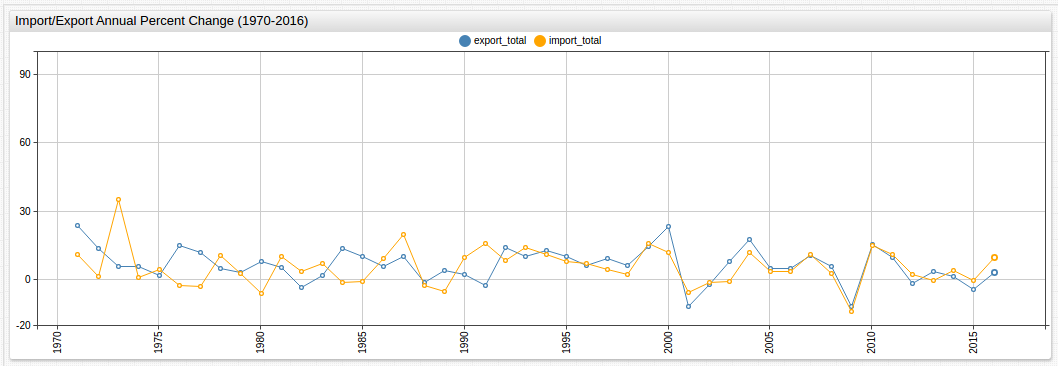
To start, look at the visualization, SQL query, and result set below:
Data has been imported into ATSD without modification.
SELECT date_format(time, 'yyyy') AS "Year", im.value AS "Import Percent Change", ex.value 'Export Percent Change'
  FROM import_total AS "im" JOIN export_total AS "ex"
Expand this section to view query results.
| Year | Import Percent Change | Export Percent Change |
|---|---|---|
| 1970 | 17.7 | 9.7 |
| 1971 | 10.8 | 23.6 |
| 1972 | 1.2 | 13.5 |
| 1973 | 35.2 | 5.5 |
| 1974 | 0.7 | 5.6 |
| 1975 | 4.2 | 1.8 |
| 1976 | -2.8 | 14.7 |
| 1977 | -3.0 | 11.7 |
| 1978 | 10.6 | 4.6 |
| 1979 | 2.8 | 3.0 |
| 1980 | -6.2 | 7.8 |
| 1981 | 10.2 | 5.2 |
| 1982 | 3.6 | -3.5 |
| 1983 | 6.8 | 1.7 |
| 1984 | -1.1 | 13.6 |
| 1985 | -0.9 | 10.0 |
| 1986 | 9.2 | 5.6 |
| 1987 | 19.6 | 10.2 |
| 1988 | -2.8 | -1.5 |
| 1989 | -5.1 | 4.1 |
| 1990 | 9.5 | 2.0 |
| 1991 | 15.8 | -2.8 |
| 1992 | 8.4 | 13.9 |
| 1993 | 14.1 | 10.0 |
| 1994 | 10.8 | 12.9 |
| 1995 | 7.7 | 10.0 |
| 1996 | 7.2 | 6.1 |
| 1997 | 4.2 | 9.1 |
| 1998 | 2.1 | 6.2 |
| 1999 | 15.6 | 14.6 |
| 2000 | 12.0 | 23.4 |
| 2001 | -5.5 | -11.7 |
| 2002 | -1.2 | -2.1 |
| 2003 | -0.8 | 8.1 |
| 2004 | 11.8 | 17.6 |
| 2005 | 3.5 | 4.7 |
| 2006 | 3.4 | 5.0 |
| 2007 | 11.1 | 10.4 |
| 2008 | 2.5 | 5.8 |
| 2009 | -13.9 | -11.8 |
| 2010 | 15.1 | 15.2 |
| 2011 | 11.0 | 9.5 |
| 2012 | 2.1 | -1.9 |
| 2013 | -0.3 | 3.6 |
| 2014 | 3.8 | 1.4 |
| 2015 | -0.5 | -4.3 |
| 2016 | 9.5 | 3.0 |
The dataset shows the annual change in the amount of foreign trade done by Israel for each year from 1970 to 2016 denominated by 2010 New Israeli Shekel (NIS) value. These values are a calculated percent and the following key applies for 2016 information:
NIS Million at 2010 Prices:
2016: Total Import: 367,246; Total Export: 341,267
Only the percent change value without the raw figures is stored in dataset. Using this method, the 2010 NIS Million value can be applied to the above dataset. Thus, users can see concrete import and export figures shown by change in 2010 NIS Million, instead of percentile value.
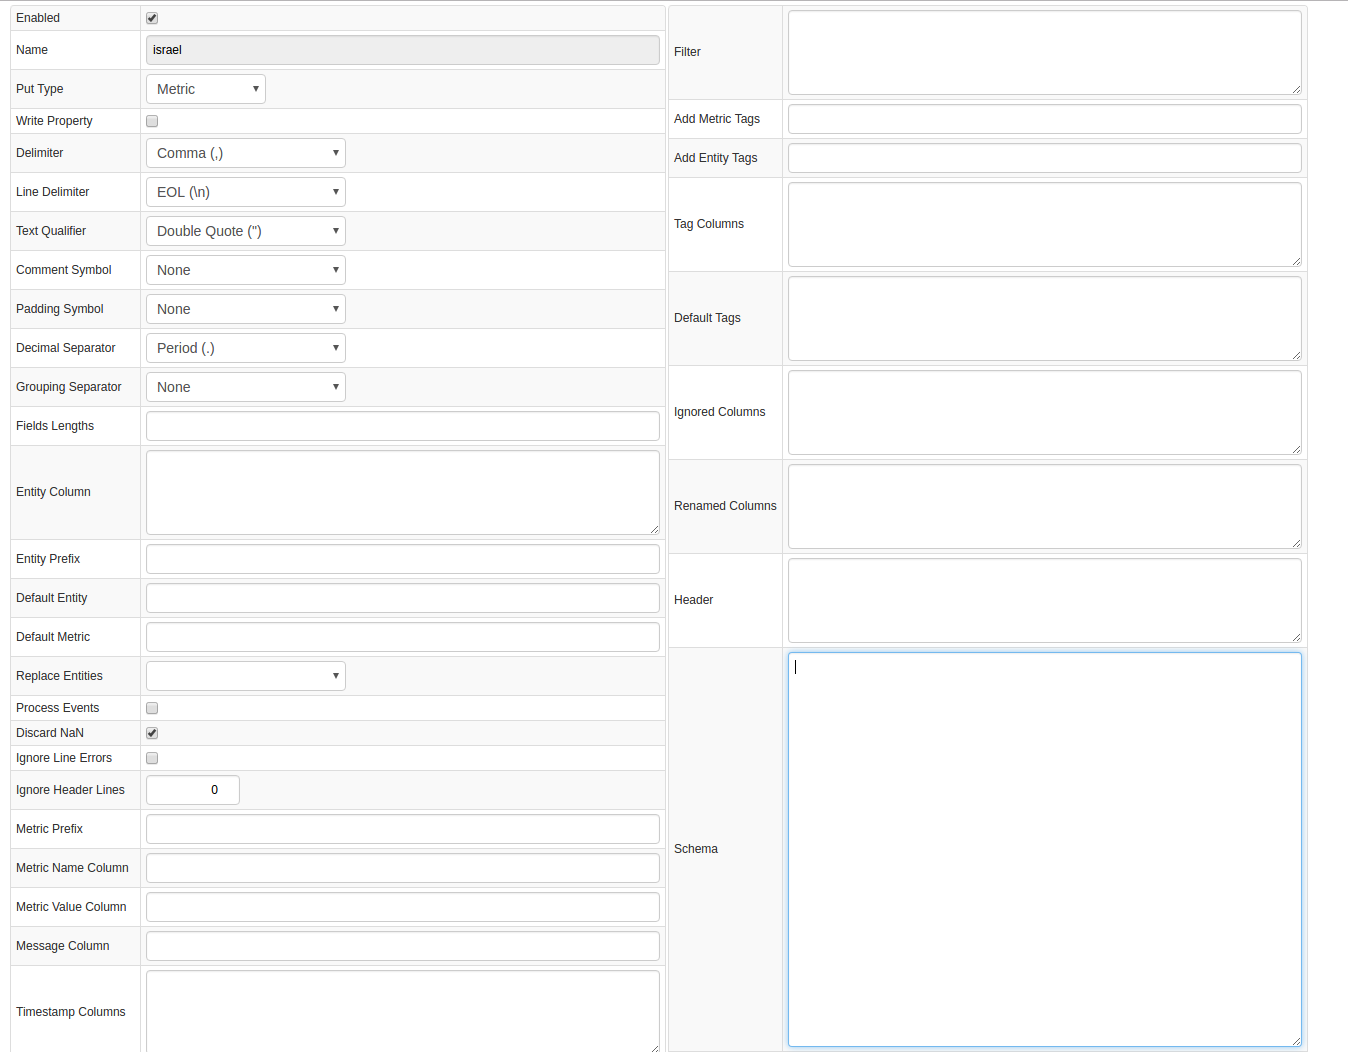
In a local instance of ATSD navigate to Data > CSV Parsers, scroll to the bottom of the page, expand the split-button, and click Create. Copy the schema showed below to the Schema field.
var dataPer2016 = ['2016',341267,319631,183461,135824,15268,367246,356431,10984,268057,89354,21465]; // numbers for 2016
function calcAccumulatedPercent(row, col) {
    var accCoef = 1;
    for (var i = row - 1; i > 1; --i) {
        var value = cell(i, col);
        if (!value) {
            return null;
        }
        accCoef = accCoef * 100 / (100 + 1.0 * changeSeparator(value));
    }
    return accCoef;
}

function calcValueForRow(row, col) {
    if (cell(row, col)) {
        return dataPer2016[col - 1] * calcAccumulatedPercent(row, col);
    }
    return null;
}

function changeSeparator(numAsStr) {
    return numAsStr ? numAsStr.replace(',', '.') : numAsStr
}

######################################

select("#row=2-*!1").select("#col=2-*!1").
addSeries().
metric(cell(1, col) + "_actual").
entity('israel_trade').
timestamp(cell(row,1)).
value(calcValueForRow(row, col)).
addSeries().
timestamp(cell(row,1)).
entity('israel_trade').
metric(cell(1,col)).
value(changeSeparator(cell(row, col)))
By manually entering the actual values provided in the data set as a var group and writing a program to convert the percent change values into 2010 NIS values, before submitting the data into the ATSD, the parser calculates and inserts new values without modifying the originals.
The script below the comment line ###### is the schema. For details about writing a custom schema, refer to Uploading CSV Files.
Because ATSD supports schema-based parsing and JavaScript customization, modify data before submission to store and insert data exactly as needed.
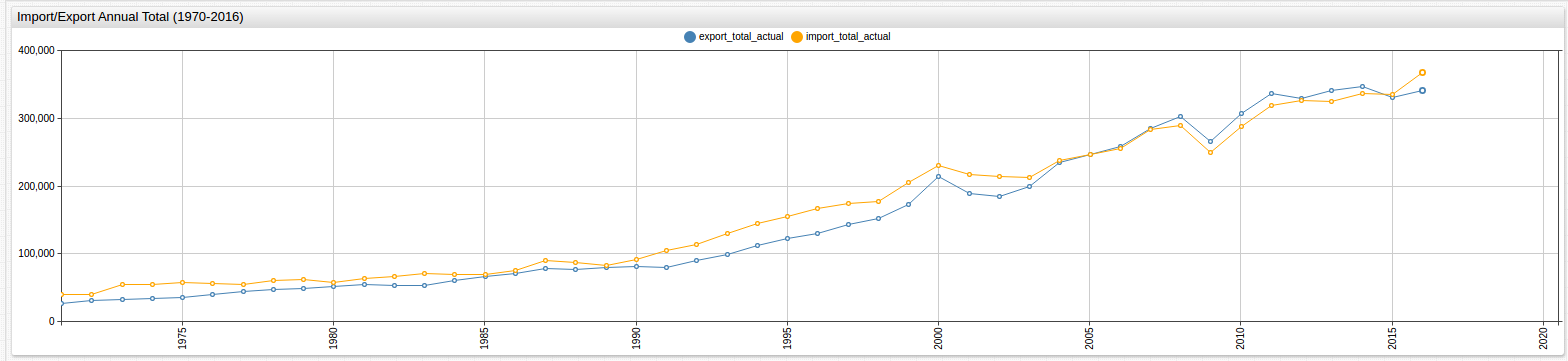
An enhanced SQL query and visualization are shown below, featuring newly calculated values:
SELECT date_format(time, 'yyyy') AS "Year", ima.value AS "Import Total", im.value AS "Import Percent Change", exa.value AS "Export Total", ex.value 'Export Percent Change'
  FROM import_total AS "im" JOIN import_total_actual AS "ima" JOIN export_total AS "ex" JOIN export_total_actual AS "exa"
Expand this section to view query results.
| Year | Import Total | Import Percent Change | Export Total | Export Percent Change |
|---|---|---|---|---|
| 1970 | 36111.9 | 17.7 | 21892.3 | 9.7 |
| 1971 | 40011.9 | 10.8 | 27058.9 | 23.6 |
| 1972 | 40492.1 | 1.2 | 30711.9 | 13.5 |
| 1973 | 54745.3 | 35.2 | 32401.0 | 5.5 |
| 1974 | 55128.5 | 0.7 | 34215.5 | 5.6 |
| 1975 | 57443.9 | 4.2 | 34831.4 | 1.8 |
| 1976 | 55835.5 | -2.8 | 39951.6 | 14.7 |
| 1977 | 54160.4 | -3.0 | 44625.9 | 11.7 |
| 1978 | 59901.4 | 10.6 | 46678.7 | 4.6 |
| 1979 | 61578.7 | 2.8 | 48079.1 | 3.0 |
| 1980 | 57760.8 | -6.2 | 51829.2 | 7.8 |
| 1981 | 63652.4 | 10.2 | 54524.3 | 5.2 |
| 1982 | 65943.9 | 3.6 | 52616.0 | -3.5 |
| 1983 | 70428.1 | 6.8 | 53510.5 | 1.7 |
| 1984 | 69653.3 | -1.1 | 60787.9 | 13.6 |
| 1985 | 69026.5 | -0.9 | 66866.7 | 10.0 |
| 1986 | 75376.9 | 9.2 | 70611.2 | 5.6 |
| 1987 | 90150.8 | 19.6 | 77813.6 | 10.2 |
| 1988 | 87626.6 | -2.8 | 76646.3 | -1.5 |
| 1989 | 83157.6 | -5.1 | 79788.8 | 4.1 |
| 1990 | 91057.6 | 9.5 | 81384.6 | 2.0 |
| 1991 | 105444.7 | 15.8 | 79105.9 | -2.8 |
| 1992 | 114302.0 | 8.4 | 90101.6 | 13.9 |
| 1993 | 130418.6 | 14.1 | 99111.7 | 10.0 |
| 1994 | 144503.8 | 10.8 | 111897.1 | 12.9 |
| 1995 | 155630.6 | 7.7 | 123086.9 | 10.0 |
| 1996 | 166836.0 | 7.2 | 130595.2 | 6.1 |
| 1997 | 173843.1 | 4.2 | 142479.3 | 9.1 |
| 1998 | 177493.8 | 2.1 | 151313.0 | 6.2 |
| 1999 | 205182.9 | 15.6 | 173404.7 | 14.6 |
| 2000 | 229804.8 | 12.0 | 213981.4 | 23.4 |
| 2001 | 217165.6 | -5.5 | 188945.6 | -11.7 |
| 2002 | 214559.6 | -1.2 | 184977.8 | -2.1 |
| 2003 | 212843.1 | -0.8 | 199960.9 | 8.1 |
| 2004 | 237958.6 | 11.8 | 235154.1 | 17.6 |
| 2005 | 246287.1 | 3.5 | 246206.3 | 4.7 |
| 2006 | 254660.9 | 3.4 | 258516.6 | 5.0 |
| 2007 | 282928.2 | 11.1 | 285402.4 | 10.4 |
| 2008 | 290001.4 | 2.5 | 301955.7 | 5.8 |
| 2009 | 249691.2 | -13.9 | 266324.9 | -11.8 |
| 2010 | 287394.6 | 15.1 | 306806.3 | 15.2 |
| 2011 | 319008.0 | 11.0 | 335952.9 | 9.5 |
| 2012 | 325707.2 | 2.1 | 329569.8 | -1.9 |
| 2013 | 324730.1 | -0.3 | 341434.3 | 3.6 |
| 2014 | 337069.8 | 3.8 | 346214.4 | 1.4 |
| 2015 | 335384.5 | -0.5 | 331327.2 | -4.3 |
| 2016 | 367246.0 | 9.5 | 341267.0 | 3.0 |