Projected Baltimore Employment Figures (2001-2040)
SQL Console and ChartLab from Axibase
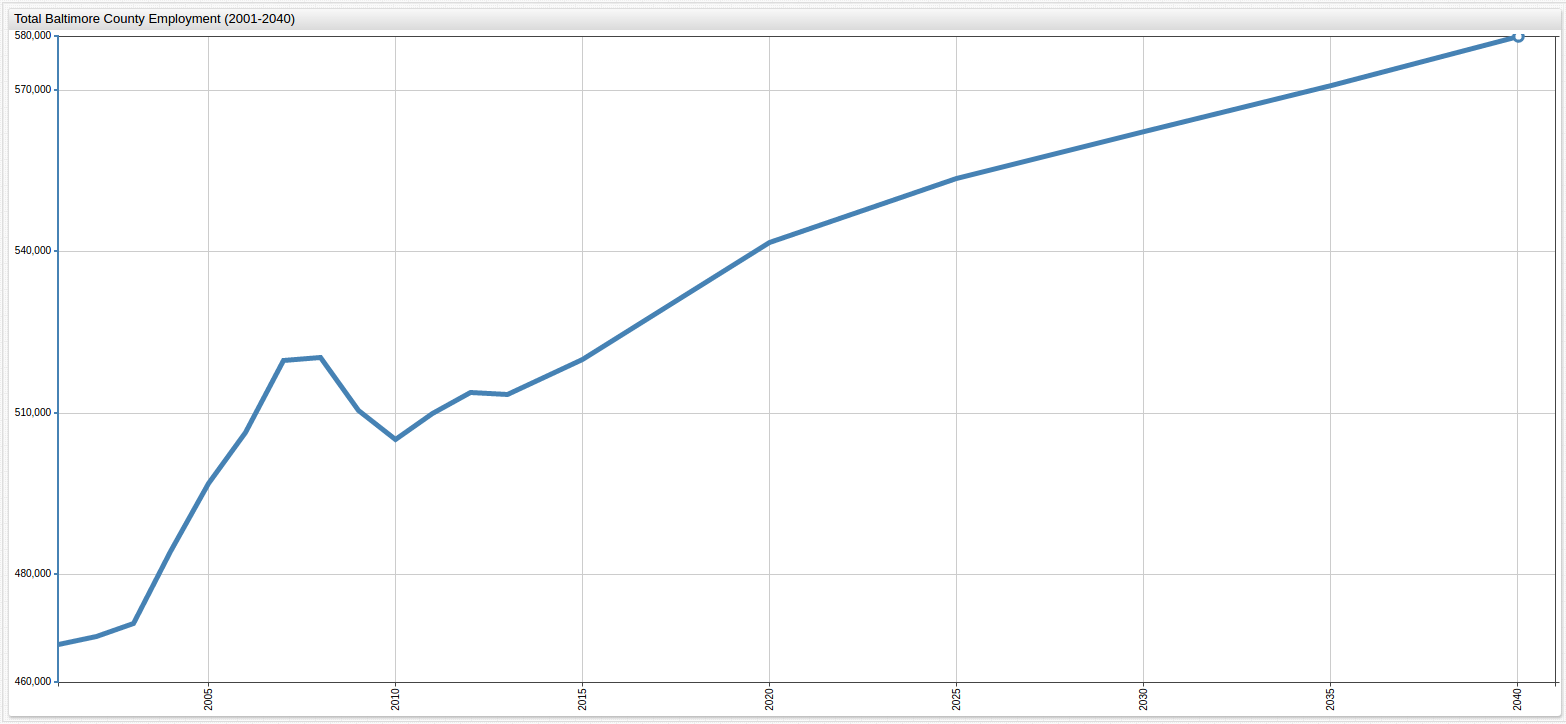
Total Projected Employment Numbers (2001-2040)
SELECT datetime AS "Year", value/1000 AS "Total Jobs (Thousand)"
  FROM atsd_series
WHERE entity = '5w8e-5mc3' AND metric LIKE ('job_title.total_employment')
  GROUP BY datetime, value
ORDER BY 'Year' ASC
  LIMIT 20
| Year | Total Jobs (Thousand) |
|---|---|
| 2001-01-01 | 467.00 |
| 2002-01-01 | 468.42 |
| 2003-01-01 | 470.95 |
| 2004-01-01 | 484.19 |
| 2005-01-01 | 496.97 |
| 2006-01-01 | 506.33 |
| 2007-01-01 | 519.80 |
| 2008-01-01 | 520.36 |
| 2009-01-01 | 510.50 |
| 2010-01-01 | 505.13 |
| 2011-01-01 | 509.85 |
| 2012-01-01 | 513.86 |
| 2013-01-01 | 513.36 |
| 2015-01-01 | 519.90 |
| 2020-01-01 | 541.70 |
| 2025-01-01 | 553.60 |
| 2030-01-01 | 562.30 |
| 2035-01-01 | 570.80 |
| 2040-01-01 | 579.90 |

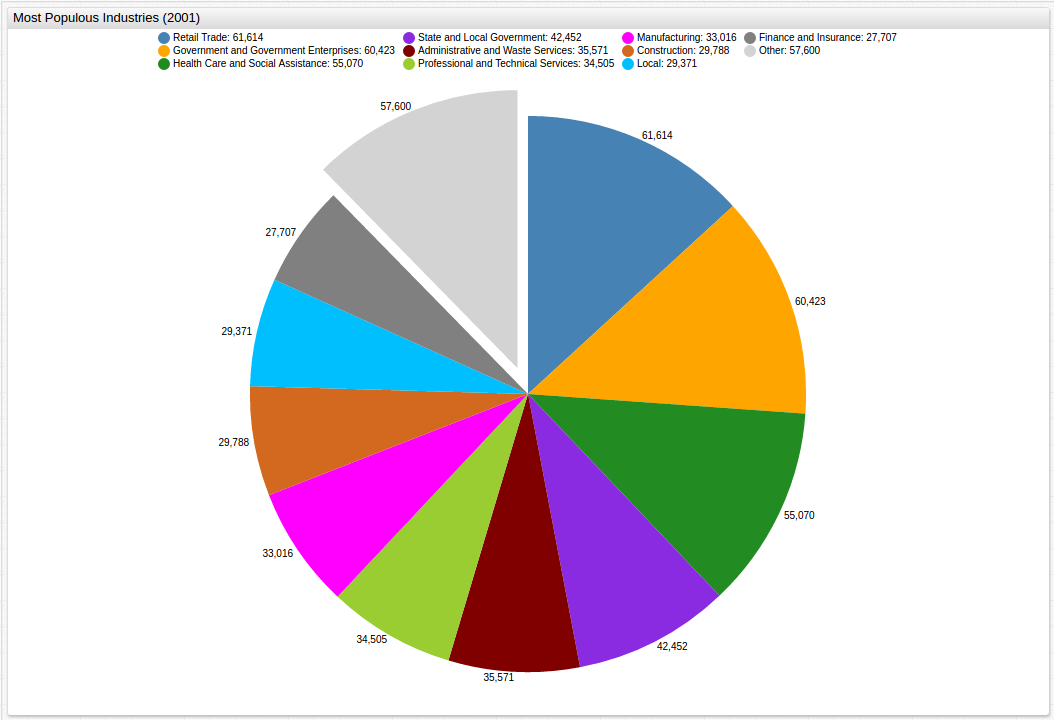
Most Populous Industries (2001)
SELECT metric.label AS "Job Field", first(value)/1000 AS "2001 Total (Thousand)"
  FROM atsd_series
WHERE entity = '5w8e-5mc3' and metric LIKE 'job_title.%' AND metric.label != 'Total Employment'
  GROUP BY 'Job Field'
ORDER BY '2001 Total (Thousand)' DESC
  LIMIT 10
| Job Field | 2001 Total (Thousand) |
|---|---|
| Retail trade | 61.61 |
| Government and government enterprises | 60.42 |
| Health care and social assistance | 55.07 |
| State and local | 42.45 |
| Administrative and waste services | 35.57 |
| Professional and technical services | 34.51 |
| Manufacturing | 33.02 |
| Construction | 29.79 |
| Local | 29.37 |
| Finance and insurance | 27.71 |
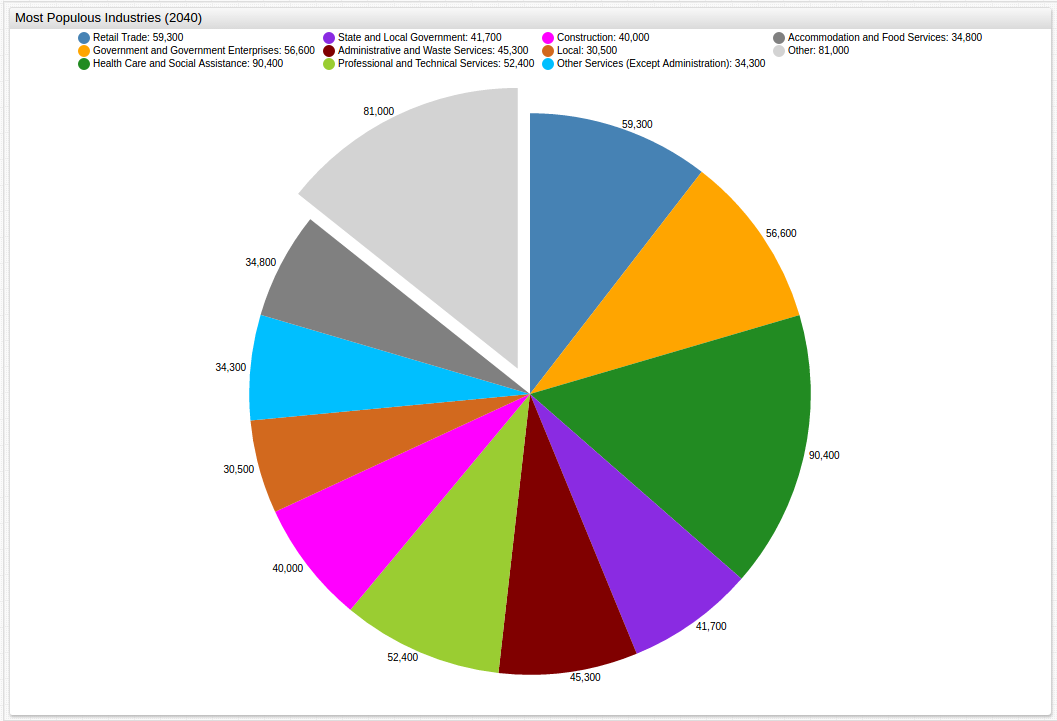
Most Populous Industries (2040)
SELECT metric.label AS "Job Field", last(value)/1000 AS "2040 Total (Thousand)"
  FROM atsd_series
WHERE entity = '5w8e-5mc3' and metric LIKE 'job_title.%' AND metric.label != 'Total Employment'
  GROUP BY 'Job Field'
ORDER BY '2040 Total (Thousand)' DESC
  LIMIT 10
| Job Field | 2040 Total (Thousand) |
|---|---|
| Health care and social assistance | 90.40 |
| Retail trade | 59.30 |
| Government and government enterprises | 56.60 |
| Professional and technical services | 52.40 |
| Administrative and waste services | 45.30 |
| Finance and insurance | 44.00 |
| State and local | 41.70 |
| Construction | 40.00 |
| Accommodation and food services | 34.80 |
| Other services, except public administration | 34.30 |
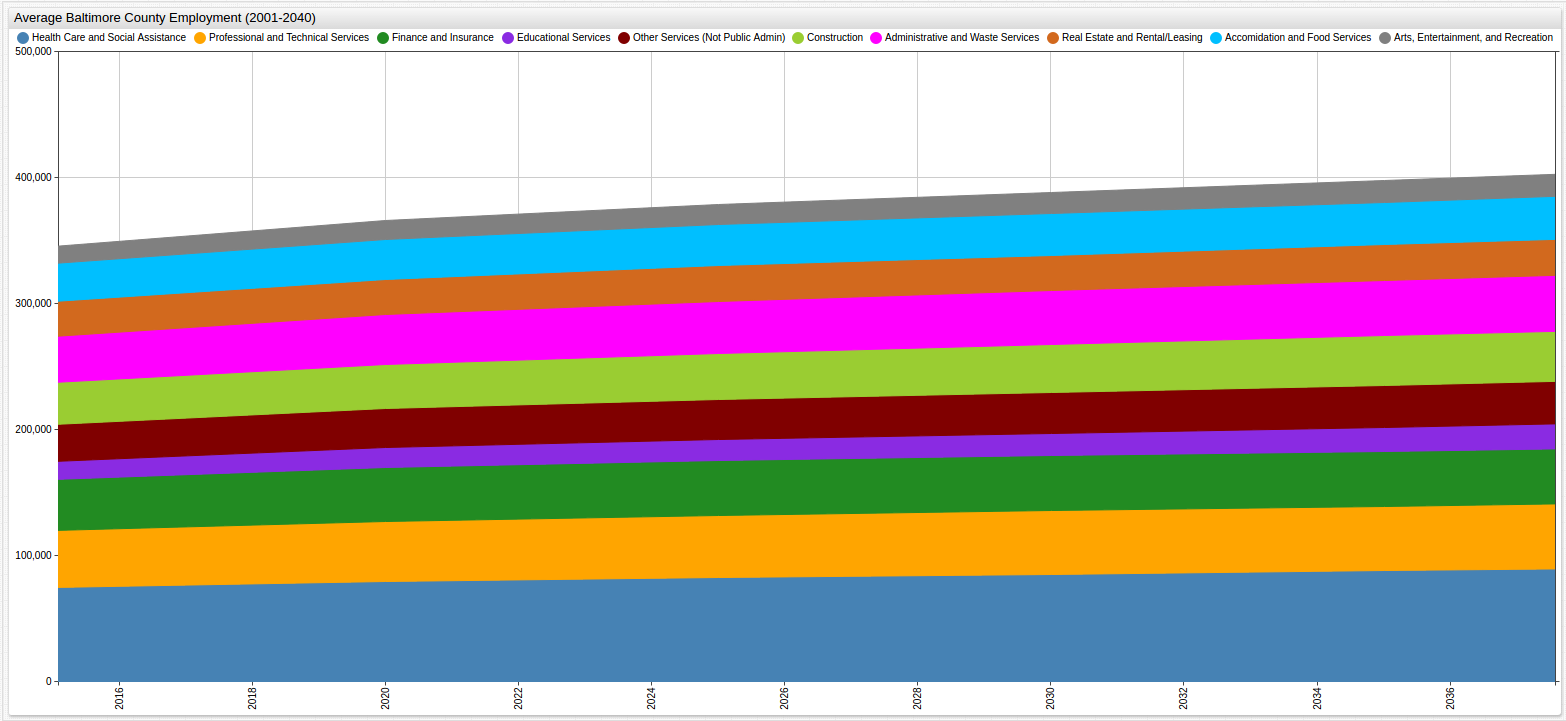
Most Populous Industries (Average) (2001-2040)
SELECT metric.label AS "Job Field", avg(value)/1000 AS "Average Total (Thousand)"
  FROM atsd_series
WHERE entity = '5w8e-5mc3' and metric LIKE 'job_title.%' AND metric.label != 'Total Employment'
  GROUP BY 'Job Field'
ORDER BY 'Average Total (Thousand)' DESC
  LIMIT 10
| Job Field | Average Total (Thousand) |
|---|---|
| Health care and social assistance | 72.04 |
| Government and government enterprises | 59.60 |
| Retail trade | 59.04 |
| Professional and technical services | 43.89 |
| State and local | 41.86 |
| Finance and insurance | 37.47 |
| Administrative and waste services | 36.30 |
| Construction | 33.92 |
| Local | 29.96 |
| Accommodation and food services | 29.79 |
Most Positive Job Outlook (2001-2040)
Job Outlook is a measurement used by economists to describe the tendency of a particular industry to see growth in employment numbers over a given period of time.
SELECT metric.label AS "Job Field", delta(value)/1000 AS "Average Total (Thousand)"
  FROM atsd_series
WHERE entity = '5w8e-5mc3' and metric LIKE 'job_title.%' AND metric.label != 'Total Employment'
  GROUP BY 'Job Field'
ORDER BY 'Average Total (Thousand)' DESC
  LIMIT 10
| Job Field | Average Total (Thousand) |
|---|---|
| Health care and social assistance | 35.33 |
| Professional and technical services | 17.89 |
| Finance and insurance | 16.29 |
| Educational services | 10.75 |
| Other services, except public administration | 10.24 |
| Construction | 10.21 |
| Administrative and waste services | 9.73 |
| Real estate and rental and leasing | 9.12 |
| Accommodation and food services | 8.25 |
| Arts, entertainment, and recreation | 6.96 |
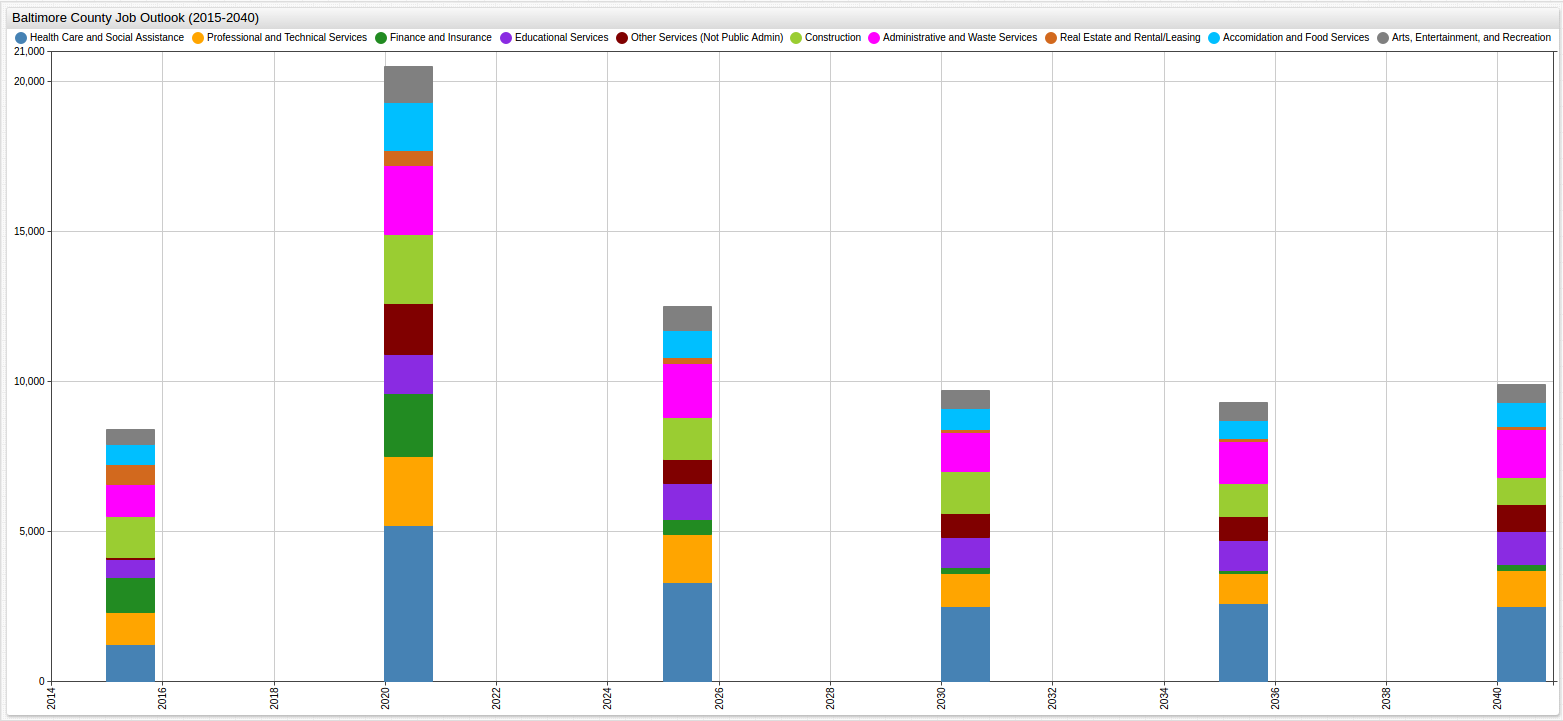
The delta value is shown for each of the ten fields above
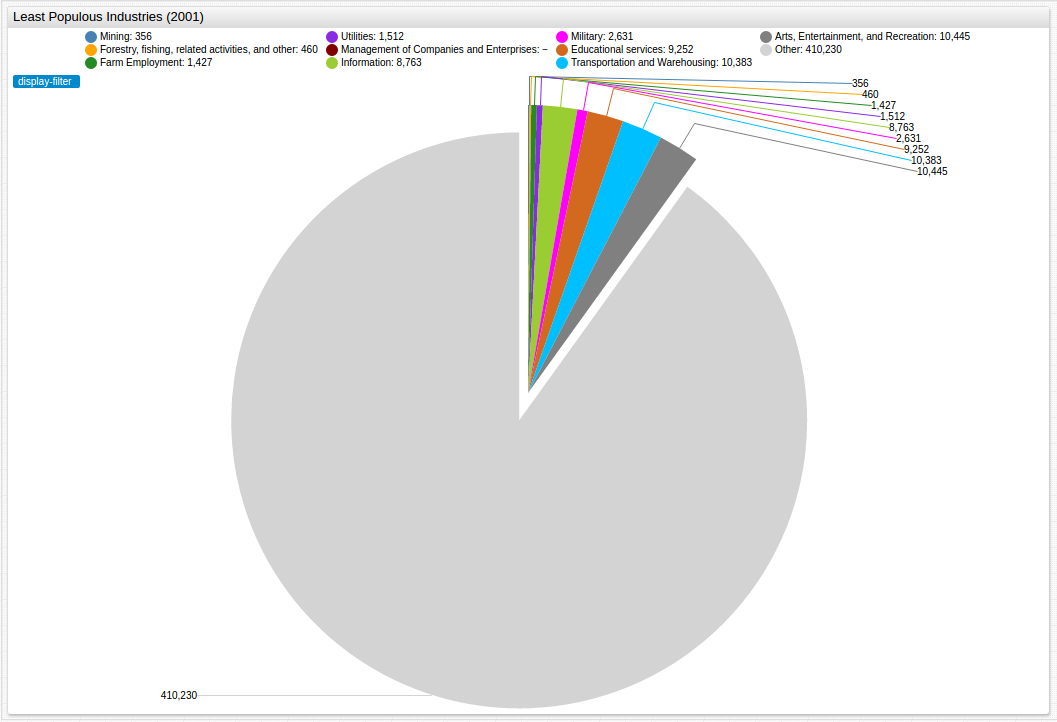
Least Populous Industries (2001)
SELECT metric.label AS "Job Field", first(value)/1000 AS "Average Total (Thousand)"
  FROM atsd_series
WHERE entity = '5w8e-5mc3' and metric LIKE 'job_title.%' AND metric.label != 'Total Employment'
  GROUP BY 'Job Field'
ORDER BY 'Average Total (Thousand)' ASC
  LIMIT 10
| Job Field | Average Total (Thousand) |
|---|---|
| Mining | 0.36 |
| Forestry, fishing, related activities, and other | 0.46 |
| Farm employment | 1.43 |
| Utilities | 1.51 |
| Management of companies and enterprises | 1.54 |
| Military | 2.63 |
| Information | 8.76 |
| Educational services | 9.25 |
| Transportation and warehousing | 10.38 |
| Arts, entertainment, and recreation | 10.45 |
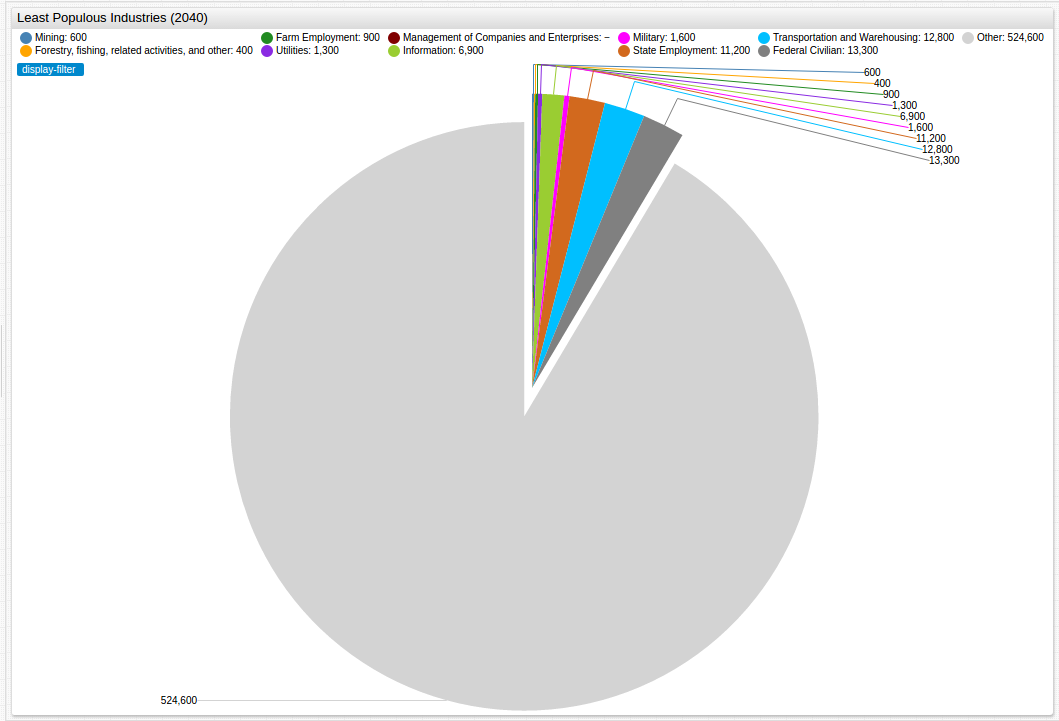
Least Populous Industries (2040)
SELECT metric.label AS "Job Field", last(value)/1000 AS "Average Total (Thousand)"
  FROM atsd_series
WHERE entity = '5w8e-5mc3' and metric LIKE 'job_title.%' AND metric.label != 'Total Employment'
  GROUP BY 'Job Field'
ORDER BY 'Average Total (Thousand)' ASC
  LIMIT 10
| Job Field | Average Total (Thousand) |
|---|---|
| Forestry, fishing, related activities, and other | 0.40 |
| Mining | 0.60 |
| Farm employment | 0.90 |
| Utilities | 1.30 |
| Military | 1.60 |
| Information | 6.90 |
| Management of companies and enterprises | 6.90 |
| Employment State | 11.20 |
| Transportation and warehousing | 12.80 |
| Federal, civilian | 13.30 |
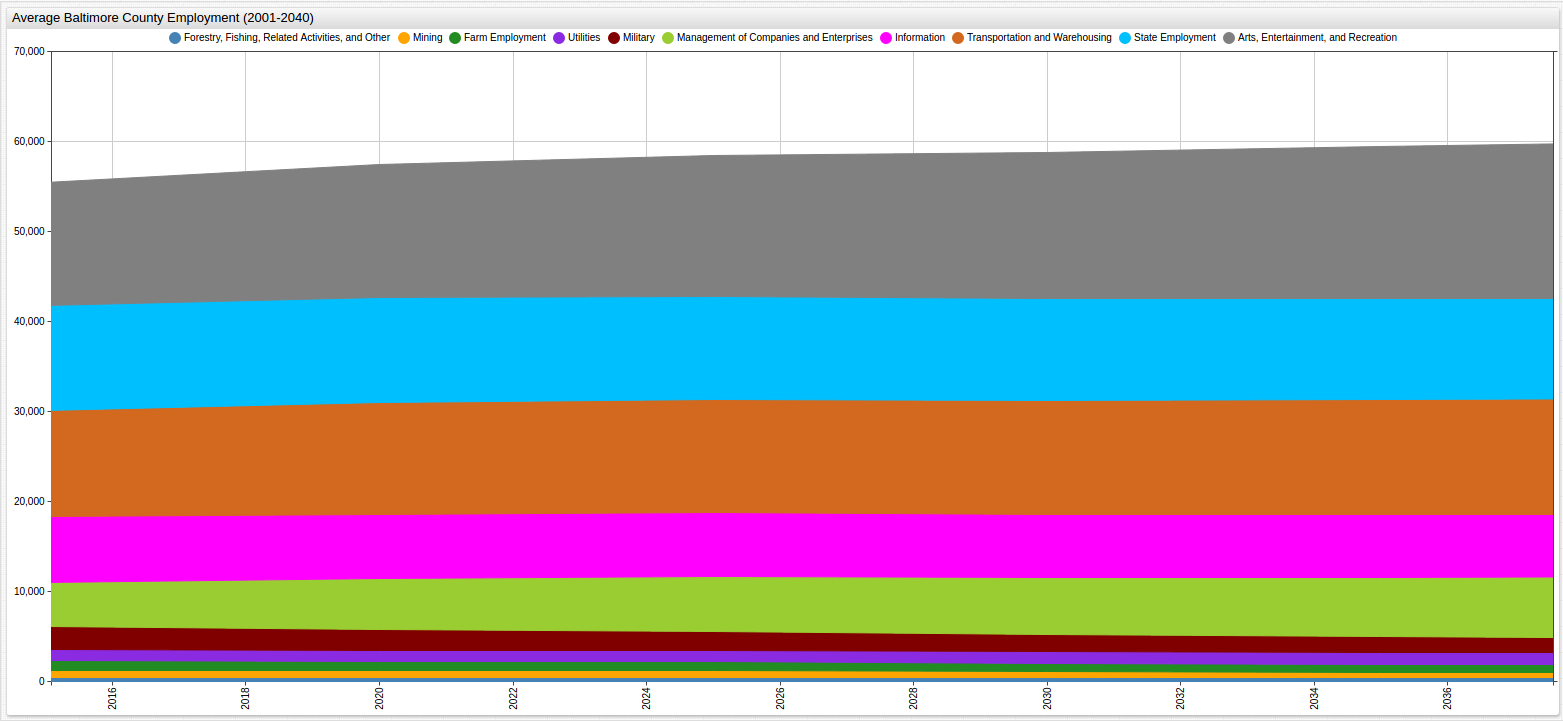
Least Populous Industries (Average) (2001-2040)
SELECT metric.label AS "Job Field", avg(value)/1000 AS "Average Total (Thousand)"
  FROM atsd_series
WHERE entity = '5w8e-5mc3' and metric LIKE 'job_title.%' AND metric.label != 'Total Employment'
  GROUP BY 'Job Field'
ORDER BY 'Average Total (Thousand)' ASC
  LIMIT 10
| Job Field | Average Total (Thousand) |
|---|---|
| Forestry, fishing, related activities, and other | 0.43 |
| Mining | 0.53 |
| Farm employment | 1.09 |
| Utilities | 1.36 |
| Military | 2.33 |
| Management of companies and enterprises | 4.01 |
| Information | 8.15 |
| Transportation and warehousing | 11.79 |
| Employment State | 11.91 |
| Arts, entertainment, and recreation | 12.93 |
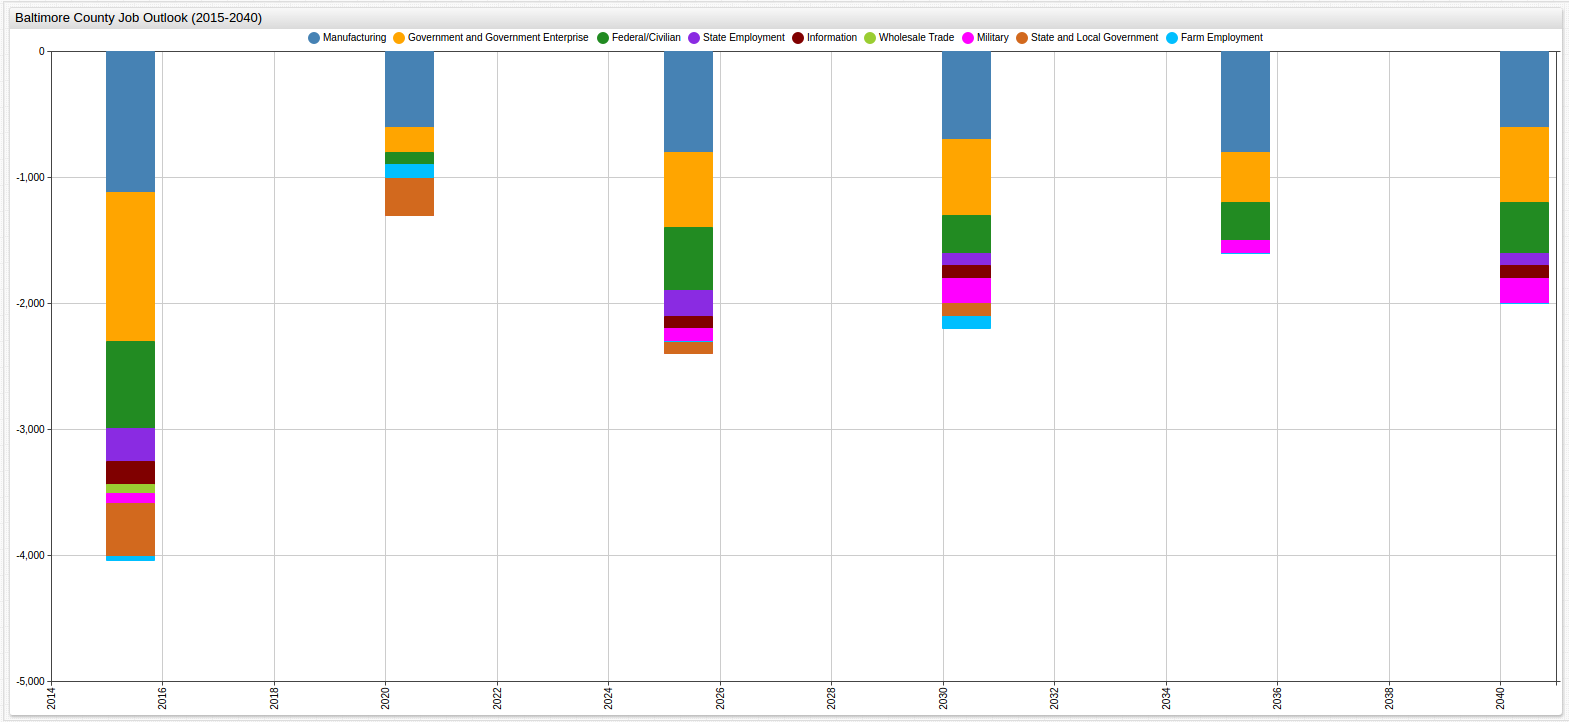
Least Positive Job Outlook (2001-2040)
SELECT metric.label AS "Job Field", delta(value)/1000 AS "Average Total (Thousand)"
  FROM atsd_series
WHERE entity = '5w8e-5mc3' and metric LIKE 'job_title.%' AND metric.label != 'Total Employment'
  GROUP BY 'Job Field'
ORDER BY 'Average Total (Thousand)' ASC
  LIMIT 10
| Job Field | Average Total (Thousand) |
|---|---|
| Manufacturing | -19.42 |
| Government and government enterprises | -3.82 |
| Retail trade | -2.31 |
| Federal, civilian | -2.04 |
| Employment State | -1.88 |
| Information | -1.86 |
| Wholesale trade | -1.68 |
| Military | -1.03 |
| State and local | -0.75 |
| Farm employment | -0.53 |