Data Visualization with ChartLab
Introduction
ChartLab is a versatile online tool which supports the visualization capabilities of ATSD. ChartLab does not require any registration and allows any user to experiment with different widgets and settings prior to deploying it in a local ATSD instance. For front-end developers familiar with JsFiddle, ChartLab shares many of the same properties and characteristics.
This tutorial shows basic ChartLab features and functionality.
ChartLab Features
To start, open a blank ChartLab page.
The ChartLab menu has the following components:
- Editor: Toggle configuration editor.
- Run" Apply and view a portal based on the current configuration in the Editor window.
- Save: Save the current configuration under as new version in the current directory;
- Clone: Save current configuration in a new directory;
- Widget: Append widget template to the selected configuration;
- Source: Switch between data sources; Random or ATSD.
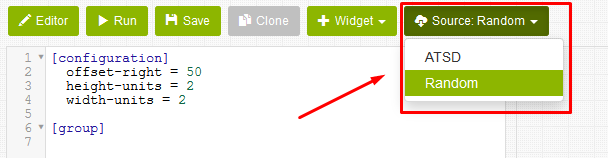
Source
ChartLab supports two data sources:
- Random Data Generator
- Axibase Time Series Database
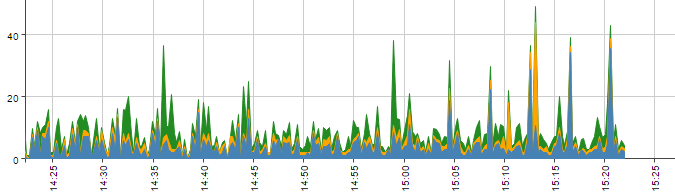
The Random Data Generator is a non-existent dataset which invokes the JavaScript function Math.random().
For more information refer to Mozilla Developer Network Documentation.
This function returns a floating-point, pseudo-random number in the range [0,1], which includes all number from 0 up to, but not including 1. These numbers have no meaning, the function generates a new random number every 60 seconds.
Use the Random Data Generator to explore different widgets and layouts available in ChartLab
The ATSD option sources data stored in ATSD from a variety of entities such as server equipment, network devices, and online resources. Use ChartLab to access public data stored by ATSD or install the database to insert more.
Widget
ChartLab contains a number of Widgets, shown below.
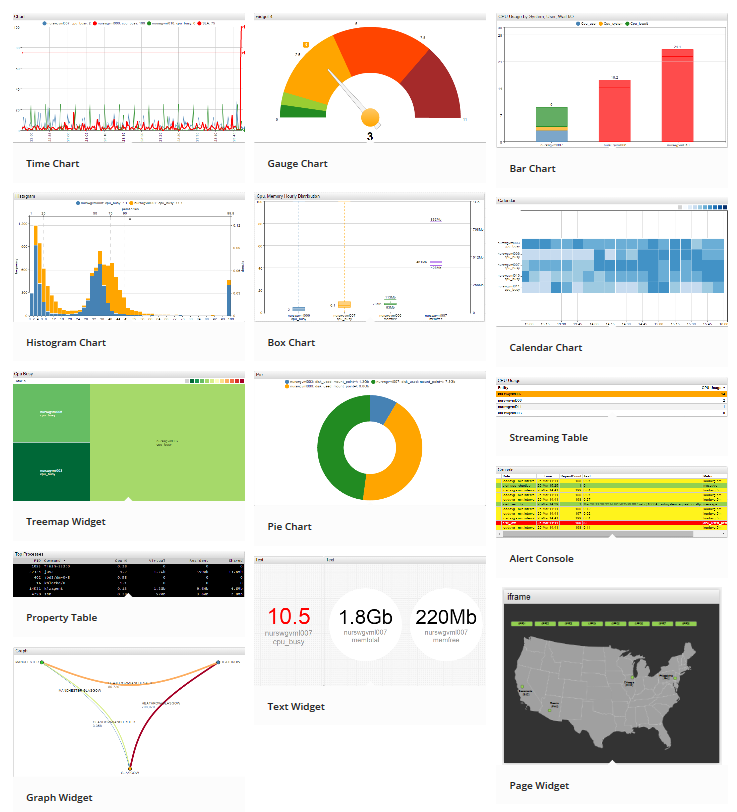
To add a Widget template to the Editor window, open the Widget drop-down list and select a widget.
Run
Once you define a Source and Widget, click Run to render the visualization.
Widget Settings
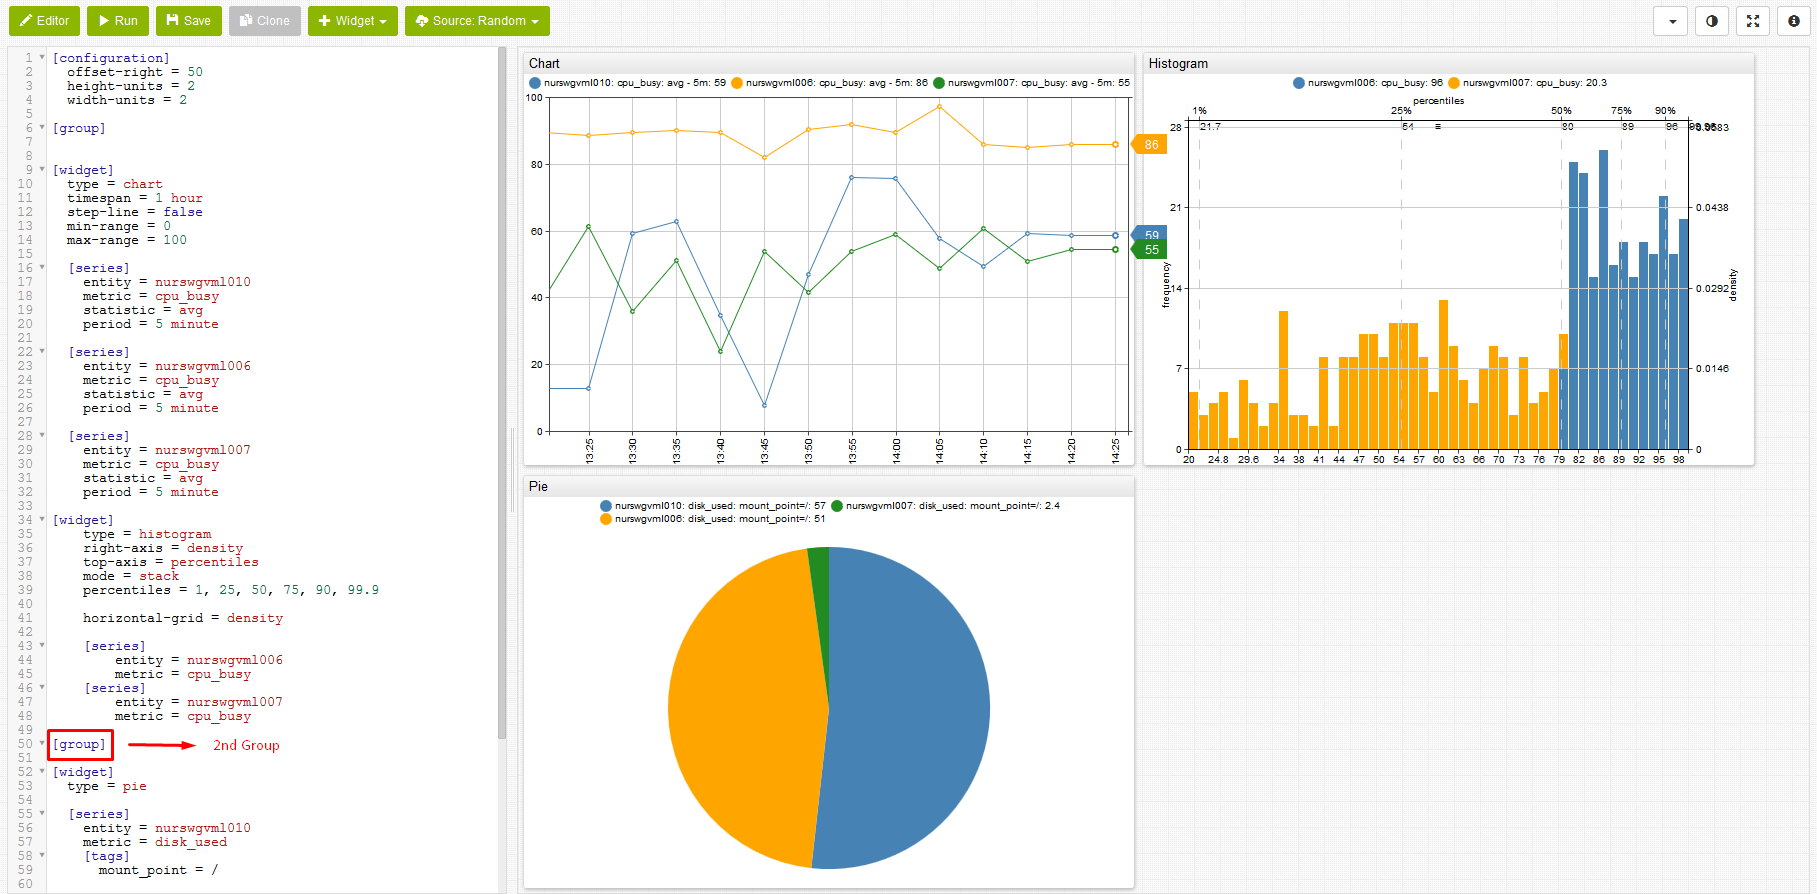
Widgets are visualized chronologically, from top to bottom, based on the order in the Editor window. The figure below displays a Time Chart and Histogram Chart, respectively.
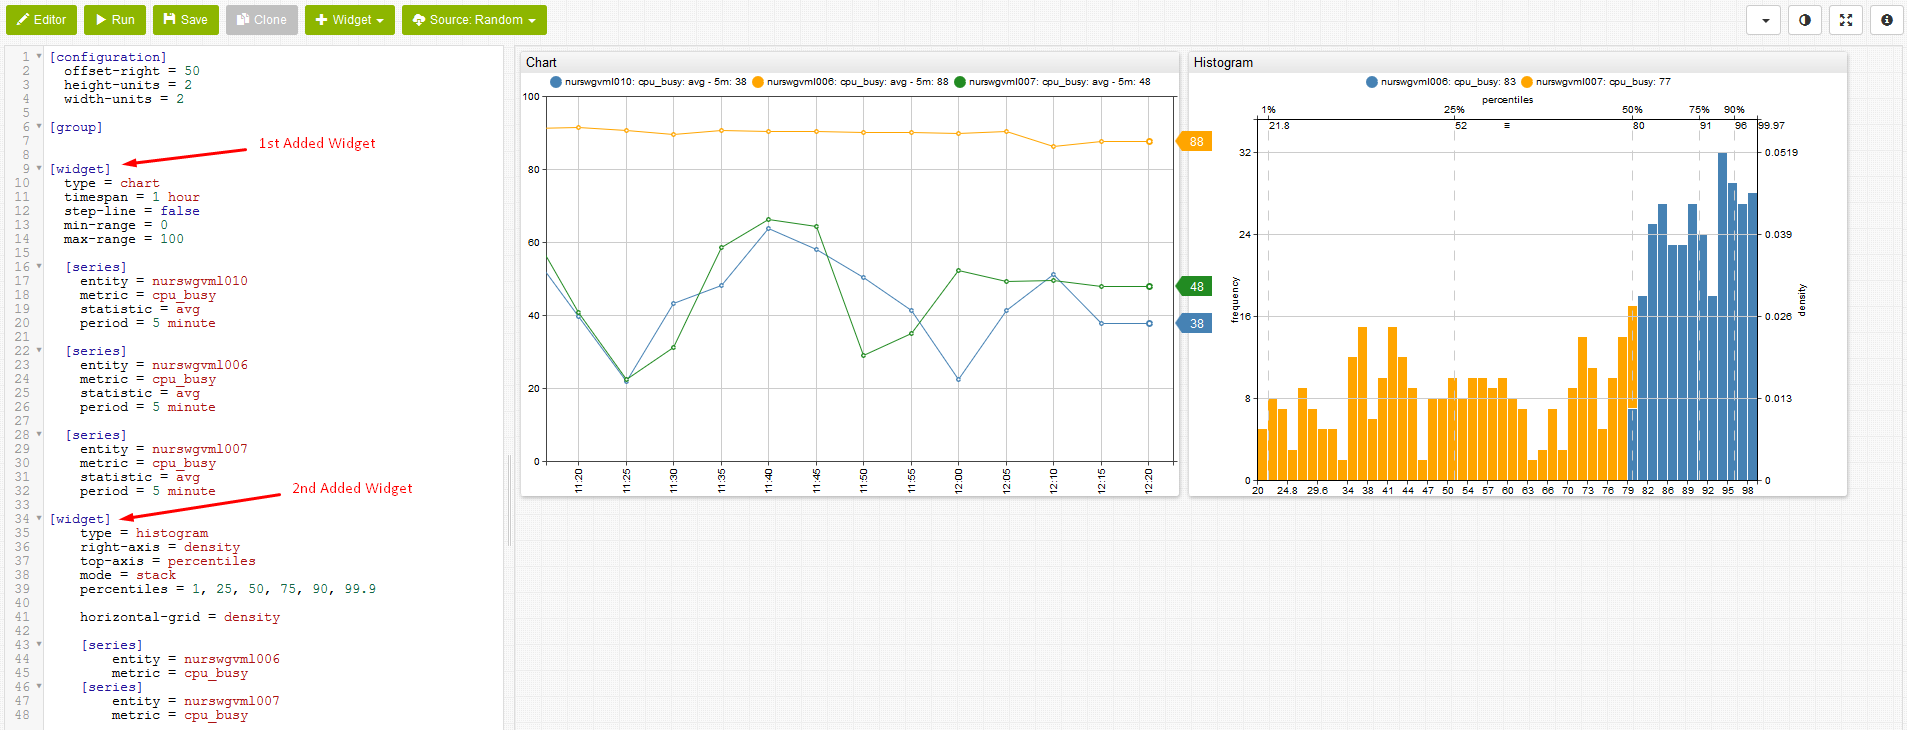
By default, widgets are arranged in a single horizontal row. Add a new [group] header to modify this feature.
In the image below, a Pie Chart is created via the addition of a new [group] and [widget] header.
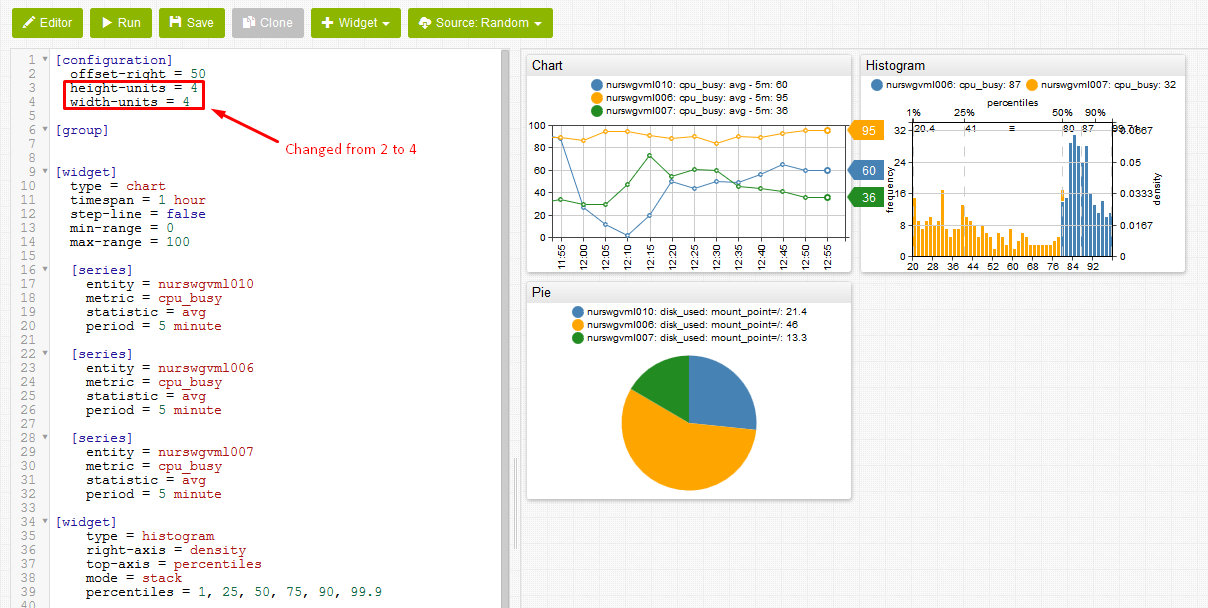
Modify height-units and width-units settings in the Editor window to resize the widgets.
ChartLab supports commenting:
- Single-line comment begin
#. - Multi-line comments begin
/*and end*/.
Quickly reformat all text shown in the Editor window. Select all text and use ctrl + tab.
Save
To create a new version of the current portal by adding a version suffix to the current URL, click Save.
Note that if the visualization has not been saved yet, clicking Save assigns the visualization a new URL.
Use the Versions drop-down list to select a specific iteration of a given chart.

Clone
To save the portal under an entirely new URL click Clone.

The cloned portal is identical to the original with a unique URL. Use this feature to publish a final edition while earlier versions remain hidden.
Editor
Show or hide the Editor window by clicking Editor.
Miscellaneous Features
Use the toolbar at the top of the screen to further customize a visualization.

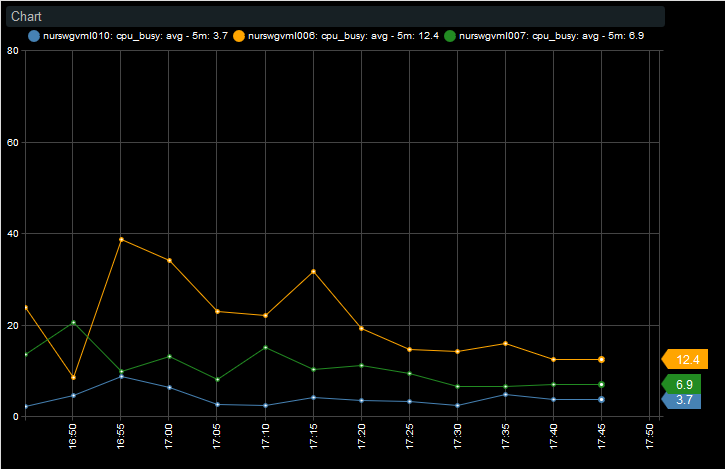
Theme applies one of the available ChartLab themes
Fullscreen toggles the view between standard and fullscreen.
Access Charts Documentation by clicking Information.
User-Defined Functions
ChartLab supports user-defined functions, enabling users to store and re-use statistical functions.
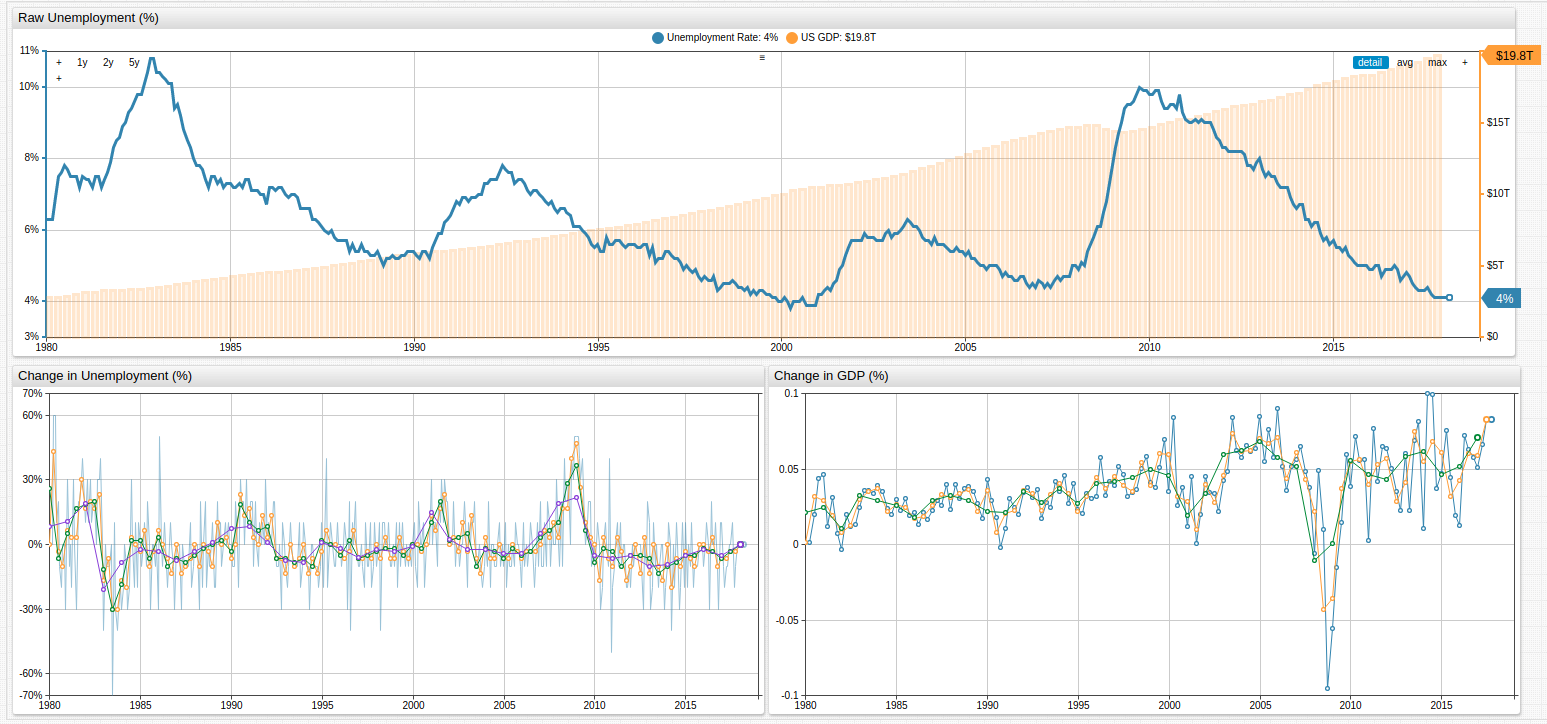

The above visualization applies user-defined functions for each of the series. An abbreviated version of the configuration is shown here:
### On the [configuration] level, the 'import' command is used to load functions from the `fred.js` file
### The library is assigned the name 'fred'.
### Multiple function libraries may be imported into the same portal.

[configuration]
  import fred = fred.js

  offset-right = 50
  height-units = 2
  width-units = 1
  start-time = 1980

  entity = fred.stlouisfed.org
  metric = unrate

[series]
  alias = base
  display = false

[series]
  value = fred.MonthlyChange('base')
Using two series, ChartLab calculates the monthly change as a new series with a value expression which applies MonthlyChange function from the fred library to the series identified with alias base.
fred Library
Any ChartLab user may access the fred.js library, which contains the following functions:
| Function Name | Arguments | Description |
|---|---|---|
MonthlyChange | alias | Month-on-month change |
ChangeFromYearAgo | alias | Year-on-year change |
ChangeByOffset | alias, interval | Customizable interval-on-interval change |
MonthlyPercentChange | alias | Month-on-month percent change |
PercentChangeFromYearAgo | alias | Year-on-year percent change |
PercentChangeByOffset | alias, interval | Customizable interval-on-interval change |
CompoundedAnnualRateOfChange | alias | Geometric-progression ratio which compounds change annually |
ContinuouslyCompoundedRateOfChange | alias | Geometric-progression ratio which continuously compounds change over an infinitesimally small interval |
NaturalLog | alias | Natural Logarithm (loge or ln) |
IndexMax | alias | Maximum series value is used as index value |
Index | alias, time | User-selected value is used as index value |
Open any of the visualizations above to see syntax and visual demonstrations of each function.
Further Reading
For more detailed information about ATSD, the underlying mechanics, or download instructions refer to ATSD Documentation.
Reach out with questions, comments, or suggestions by raising an issue on the Axibase GitHub page.