Connecticut Prison Populations
ChartLab in ATSD
Total Connecticut Prison Population by Quarter (2009 - 2017)
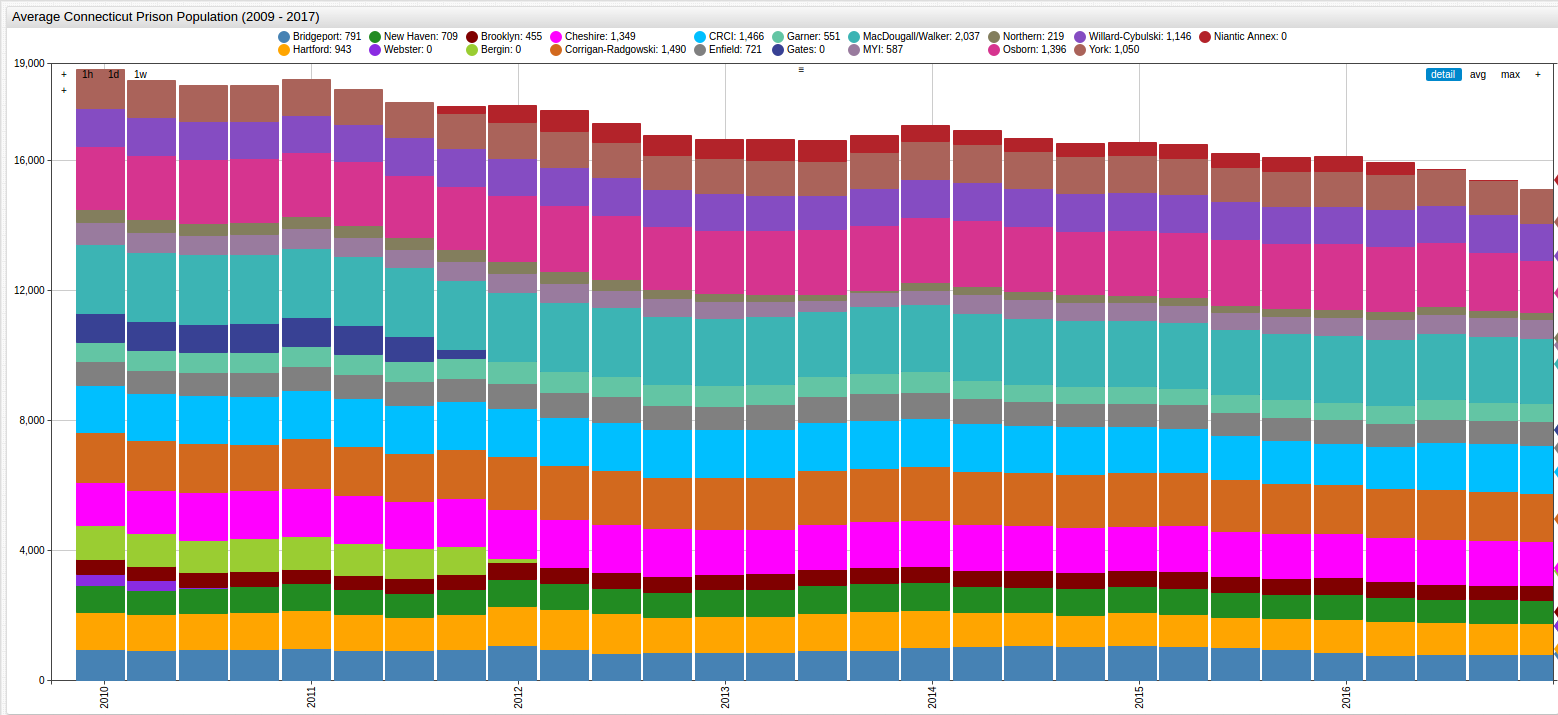
SELECT date_format(time, 'yyyy-MM') AS "Time", sum(value)/1000 AS "Total Population (1000 Persons)"
  FROM average_inmate_population
GROUP BY time
  ORDER BY time, 'Total Population (1000 Persons)'
| Time | Total Population (1000 Persons) |
|---|---|
| 2009-09 | 18.83 |
| 2009-12 | 18.47 |
| 2010-03 | 18.31 |
| 2010-06 | 18.33 |
| 2010-09 | 18.51 |
| 2010-12 | 18.21 |
| 2011-03 | 17.80 |
| 2011-06 | 17.67 |
| 2011-09 | 17.71 |
| 2011-12 | 17.55 |
| 2012-03 | 17.15 |
| 2012-06 | 16.79 |
| 2012-09 | 16.64 |
| 2012-12 | 16.64 |
| 2013-03 | 16.62 |
| 2013-06 | 16.79 |
| 2013-09 | 17.09 |
| 2013-12 | 16.93 |
| 2014-03 | 16.70 |
| 2014-06 | 16.54 |
| 2014-09 | 16.55 |
| 2014-12 | 16.51 |
| 2015-03 | 16.22 |
| 2015-06 | 16.10 |
| 2015-09 | 16.12 |
| 2015-12 | 15.95 |
| 2016-03 | 15.71 |
| 2016-04 | 0.60 |
| 2016-04 | 4.06 |
| 2016-06 | 15.38 |
| 2016-09 | 15.12 |
| 2016-12 | 14.12 |
| 2017-03 | 13.87 |
Average Connecticut Prison Population by Facility (2009 - 2017)
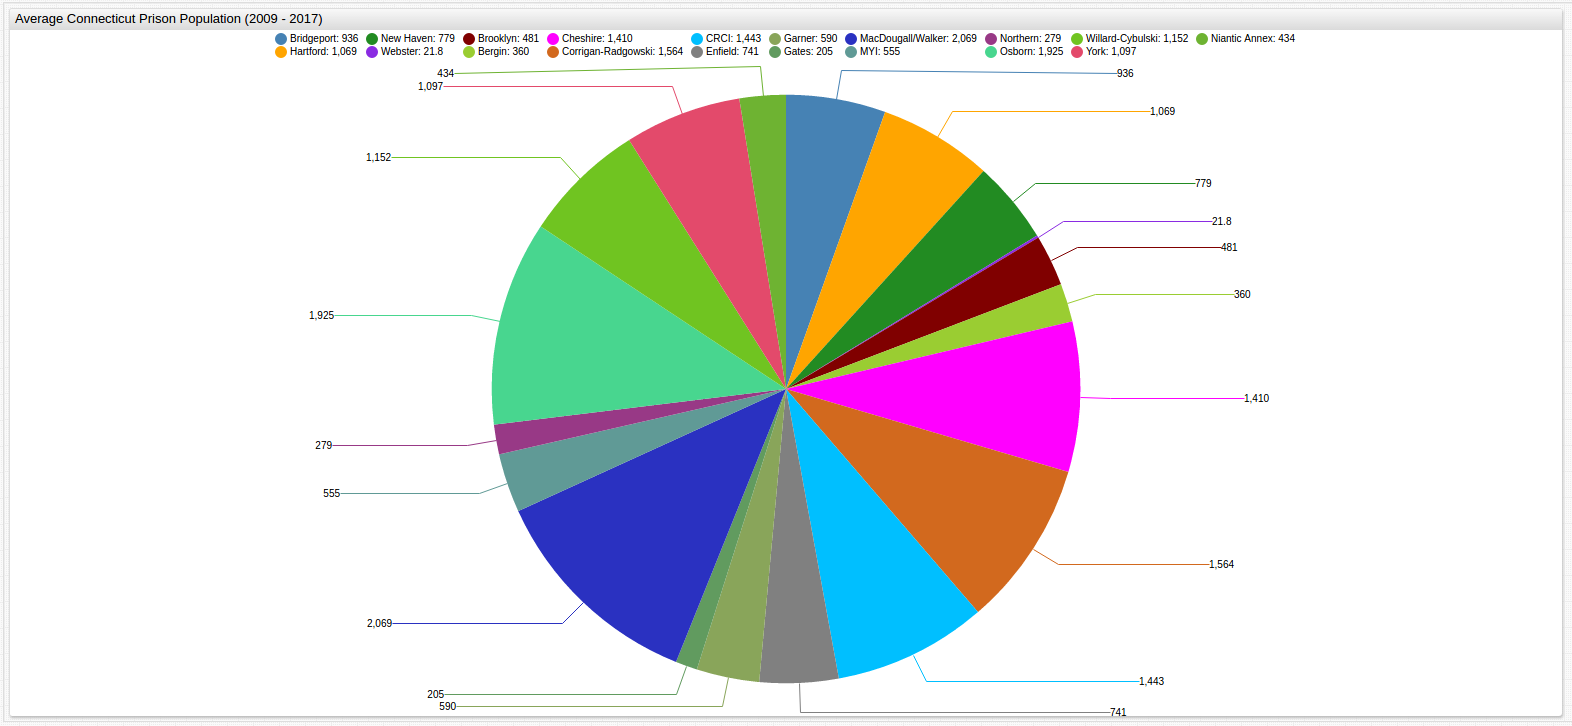
SELECT tags.facility_name AS "Facility Name", avg(value) AS "Population"
  FROM average_inmate_population
GROUP BY 'Facility Name'
   ORDER BY 'Population' DESC, 'Facility Name'
| Facility Name | Population |
|---|---|
| MacDougall/Walker | 2069 |
| Osborn | 1925 |
| Corrigan-Radgowski | 1564 |
| CRCI | 1443 |
| Cheshire | 1410 |
| Willard-Cybulski | 1152 |
| York | 1097 |
| Hartford | 1069 |
| Bridgeport | 936 |
| New Haven | 779 |
| Enfield | 741 |
| Garner | 590 |
| MYI | 555 |
| Brooklyn | 481 |
| Niantic Annex* | 434 |
| Bergin* | 360 |
| Northern | 279 |
| Gates* | 205 |
| Webster* | 22 |
* Bergin, Gates, Niantic Annex, and Webster Prisons closed in 2011, 2011, 2016, and 2010 respectively.
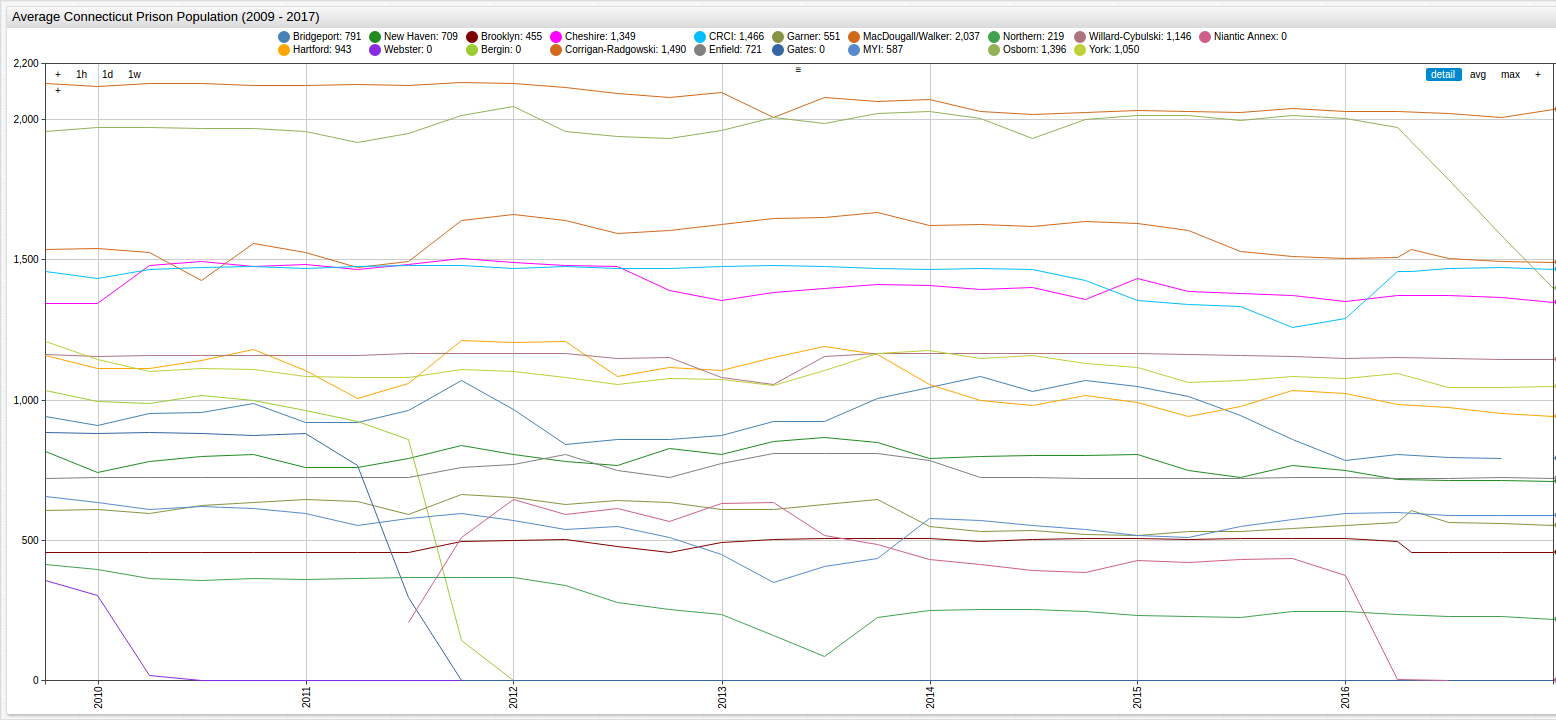
Current Connecticut Prison Population by Facility (2017)
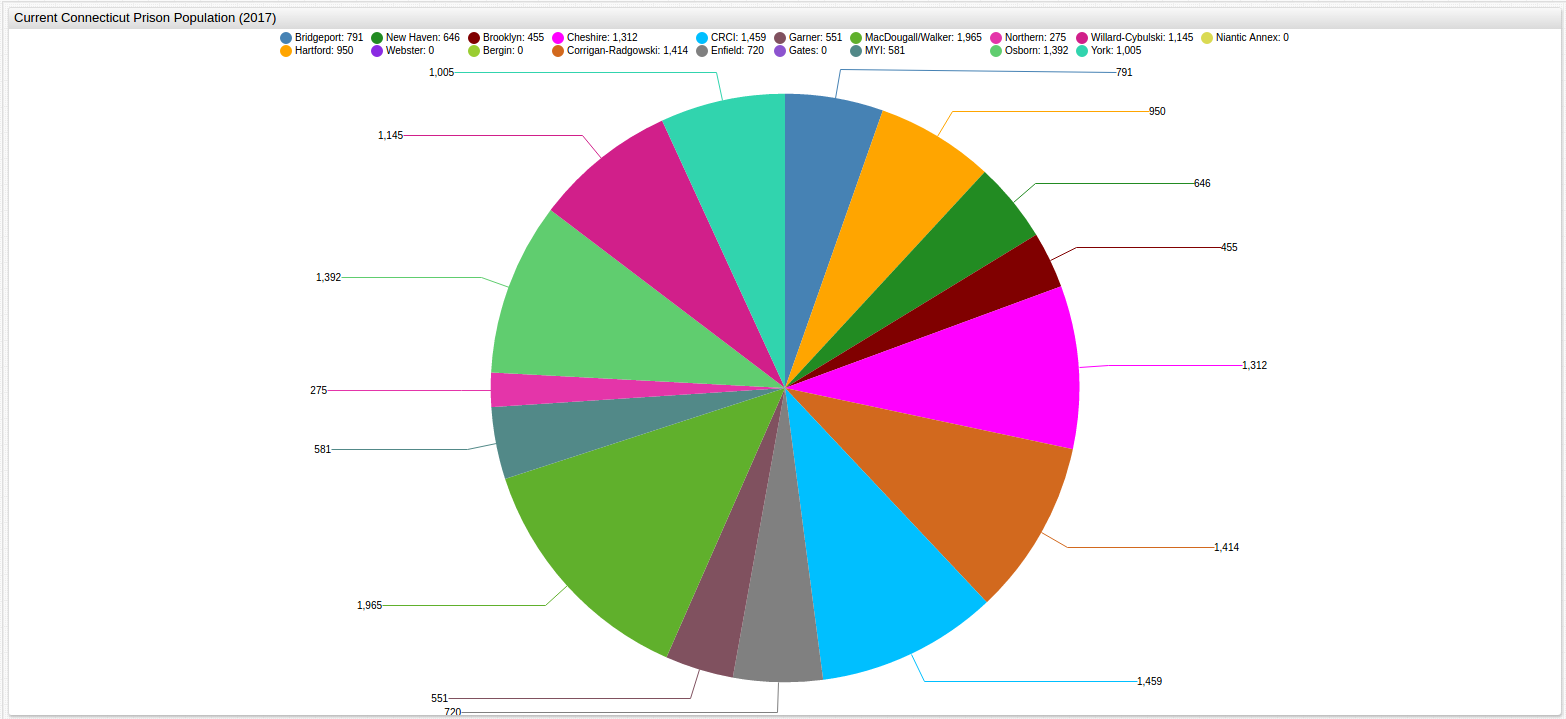
SELECT tags.facility_name AS "Facility Name", last(value) AS "Population"
  FROM average_inmate_population
GROUP BY 'Facility Name'
   ORDER BY 'Facility Name', 'Population'
| Facility Name | Population |
|---|---|
| Bergin | 0 |
| Bridgeport | 791 |
| Brooklyn | 455 |
| CRCI | 1459 |
| Cheshire | 1312 |
| Corrigan-Radgowski | 1414 |
| Enfield | 720 |
| Garner | 551 |
| Gates | 0 |
| Hartford | 950 |
| MYI | 581 |
| MacDougall/Walker | 1965 |
| New Haven | 646 |
| Niantic Annex | 0 |
| Northern | 275 |
| Osborn | 1392 |
| Webster | 0 |
| Willard-Cybulski | 1145 |
| York | 1005 |
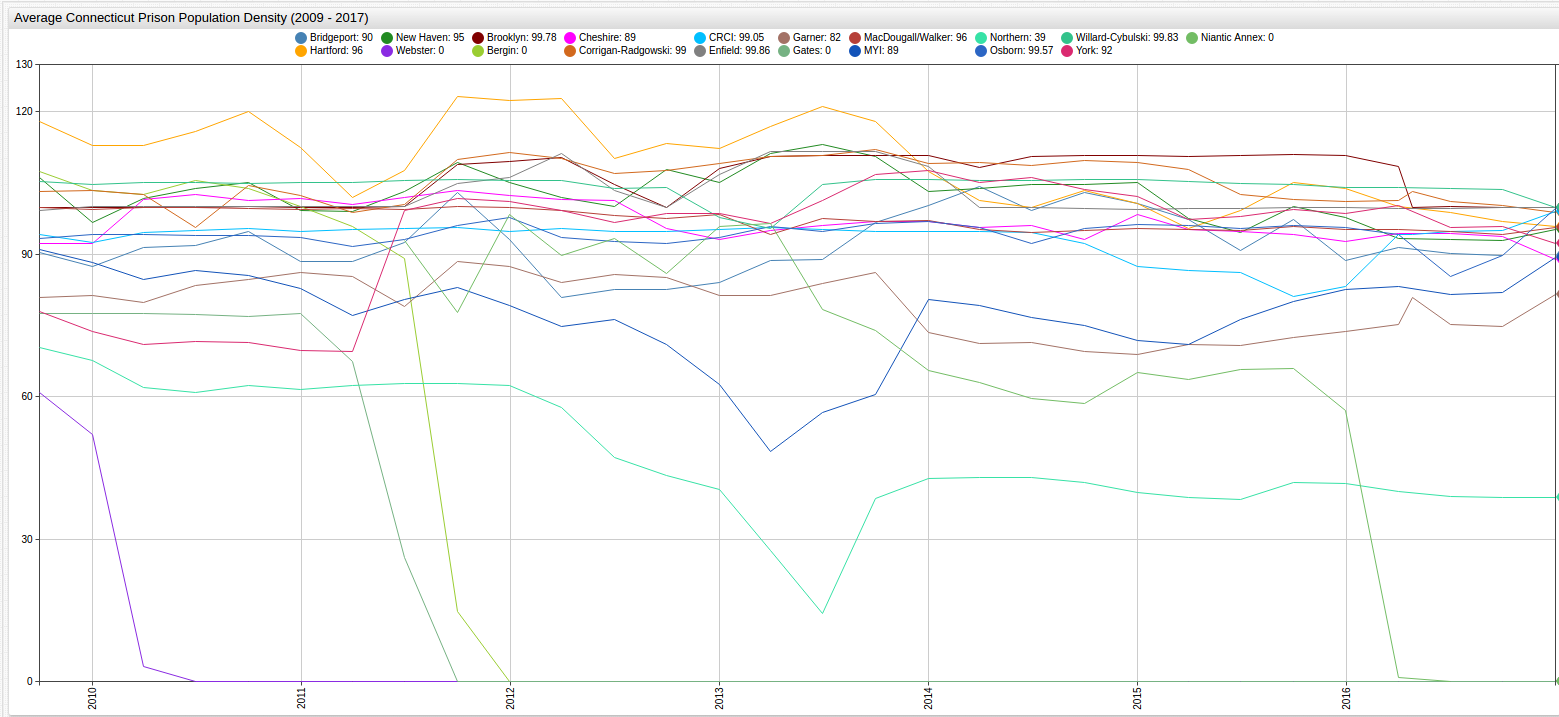
Average Connecticut Prison Population Density by Facility (2009 - 2017)
Density is defined as [(Number of Prisoners)/(Number of Beds)]
SELECT tags.facility_name AS "Facility Name", avg(value) AS "Density"
  FROM inmate_population_density
WHERE tags.facility_name NOT IN ('Bergin', 'Gates', 'Niantic Annex', 'Webster')
  GROUP BY 'Facility Name'
ORDER BY 'Density' DESC
| Facility Name | Density |
|---|---|
| Hartford | 109 |
| Brooklyn | 105 |
| Corrigan-Radgowski | 105 |
| Willard-Cybulski | 104 |
| Enfield | 102 |
| New Haven | 102 |
| MacDougall/Walker | 97 |
| Cheshire | 97 |
| Osborn | 94 |
| CRCI | 93 |
| York | 93 |
| Bridgeport | 92 |
| Garner | 79 |
| MYI | 78 |
| Northern | 48 |
Non-operational prisons have been removed from this query.
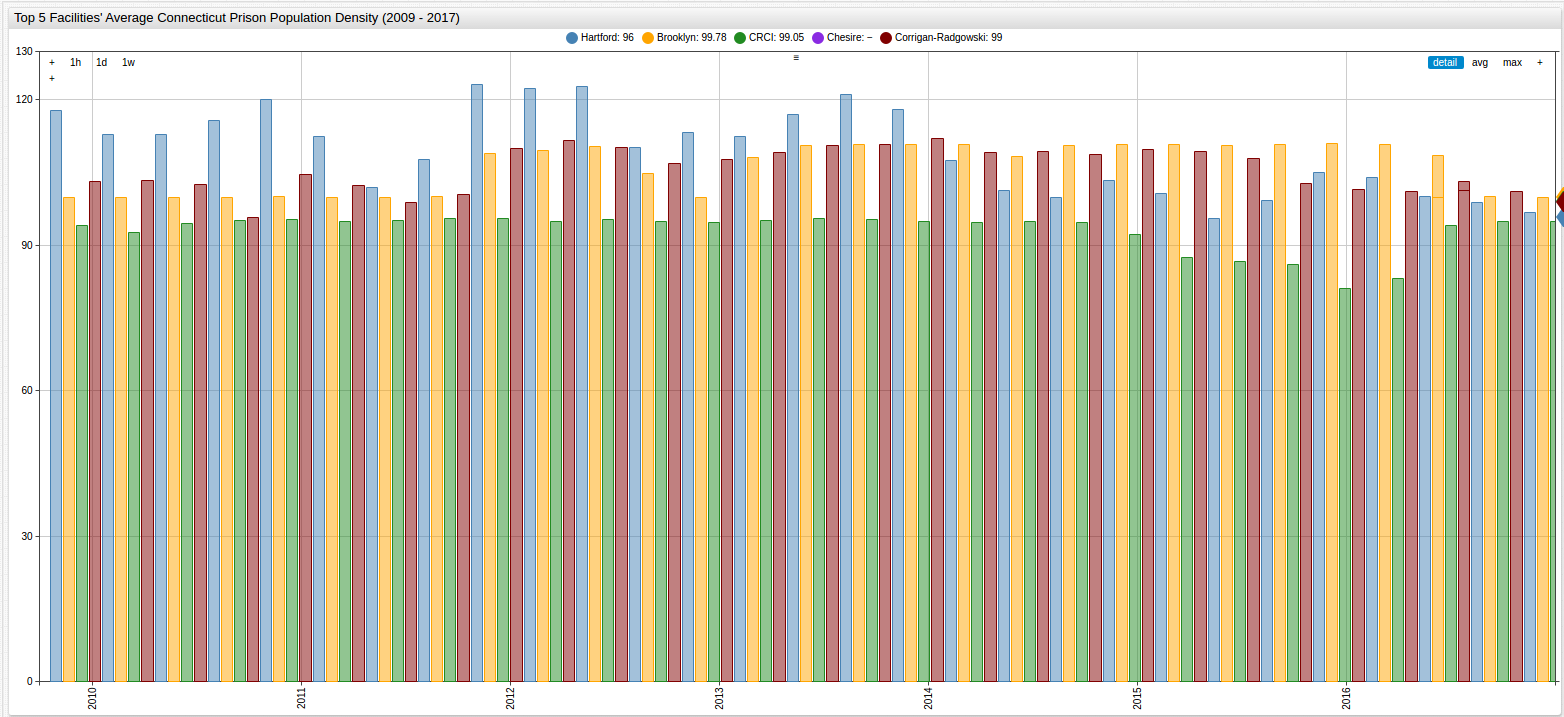
The five most densely-populated Connecticut prisons are shown above.
Current Connecticut Prison Population Density by Facility (2017)
Density is defined as [(Number of Prisoners)/(Number of Beds)]
SELECT tags.facility_name AS "Facility Name", last(value) AS "Density"
  FROM inmate_population_density
WHERE tags.facility_name NOT IN ('Bergin', 'Gates', 'Niantic Annex', 'Webster')
  GROUP BY 'Facility Name'
ORDER BY 'Density' DESC, 'Facility Name'
| Facility Name | Density |
|---|---|
| Brooklyn | 100 |
| Willard-Cybulski | 100 |
| Enfield | 100 |
| Osborn | 99 |
| CRCI | 99 |
| Hartford | 97 |
| Corrigan-Radgowski | 94 |
| MacDougall/Walker | 92 |
| Bridgeport | 90 |
| MYI | 88 |
| York | 88 |
| New Haven | 87 |
| Cheshire | 86 |
| Garner | 82 |
| Northern | 49 |
