United States Dollar International Exchange Rate (2012-2017)
Data Source: Federal Reserve Economic Data (FRED)
Visualizations: ChartLab
Structured Query Language: SQL Console in ATSD
Index
Data is aggregated daily in visualizations, and annually in SQL queries. Favorable dollar exchange rates are shown in green while less favorable exchange rates are shown in red, based on the overall 5-year average exchange rate. Each section is accompanied by a brief analysis to give the data context. Using derived value settings thresholds have been calculated using the underlying data, the upper 25th percentile of a given exchange rate is considered favorable while the lower 25th percentile is considered less than favorable. The data is coded with an ID which is provided in the index as well. Open any ChartLab display below to navigate through time, or change the metric to reflect a different exchange rate.
Europe
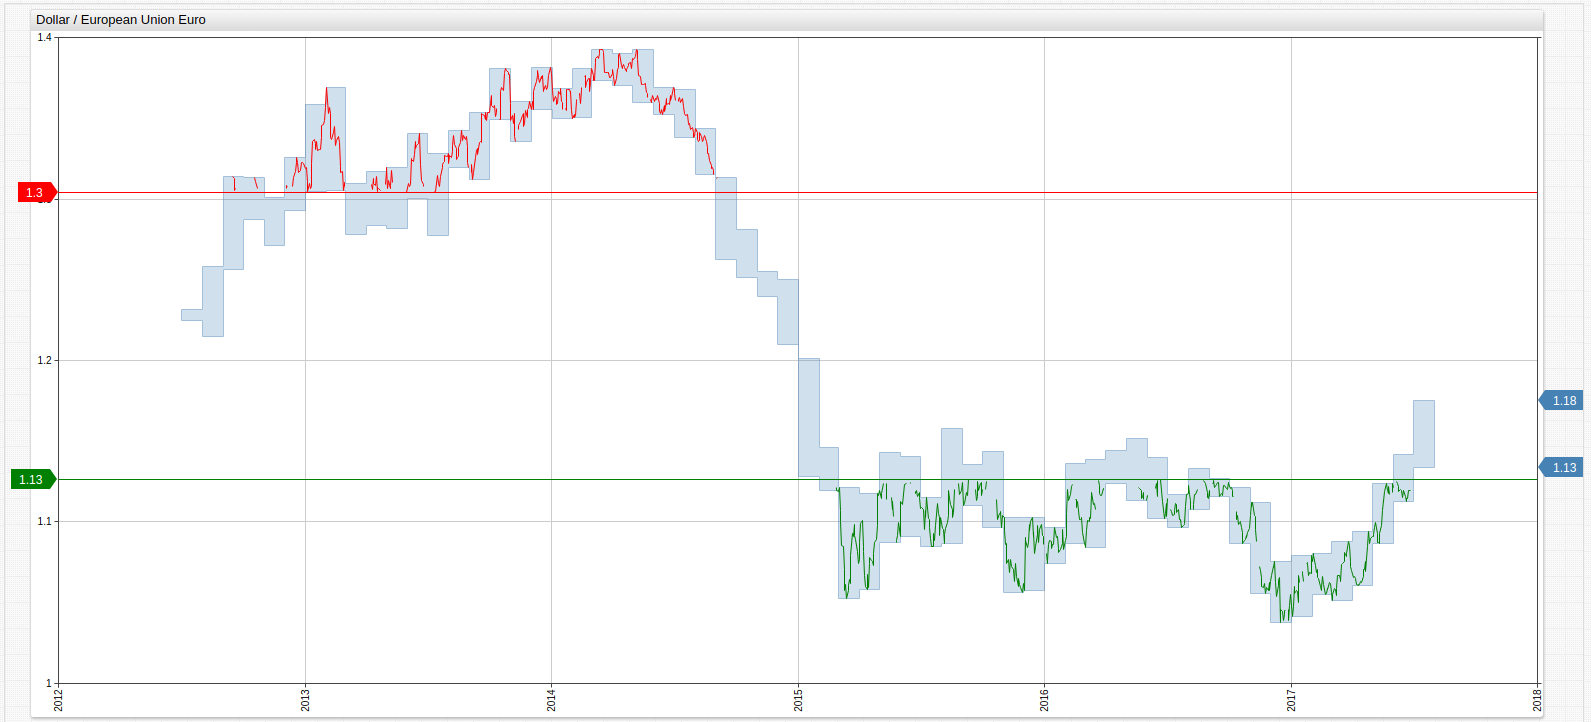
USD v. Euro
As the amount of debt carried by various EU member countries grew to increasingly worrisome heights, the Euro plunged in 2015 losing ground against the dollar. Further, as oil prices slumped the European Central Bank began to compensate by launching a program of government bond purchases. The combination of these factors and the growth of the dollar post-recession have all contributed to the currently favorable exchange rate enjoyed by the dollar.
SELECT date_format(time, 'yyyy') AS "Date", AVG(value) AS "Average Value"
  FROM dexuseu
GROUP BY PERIOD(1 YEAR)
| Date | Average Value |
|---|---|
| 2012 | 1.28 |
| 2013 | 1.33 |
| 2014 | 1.33 |
| 2015 | 1.11 |
| 2016 | 1.11 |
| 2017 | 1.09 |

Open the ChartLab visualization above to navigate through time or select a different currency.
Return to the Index
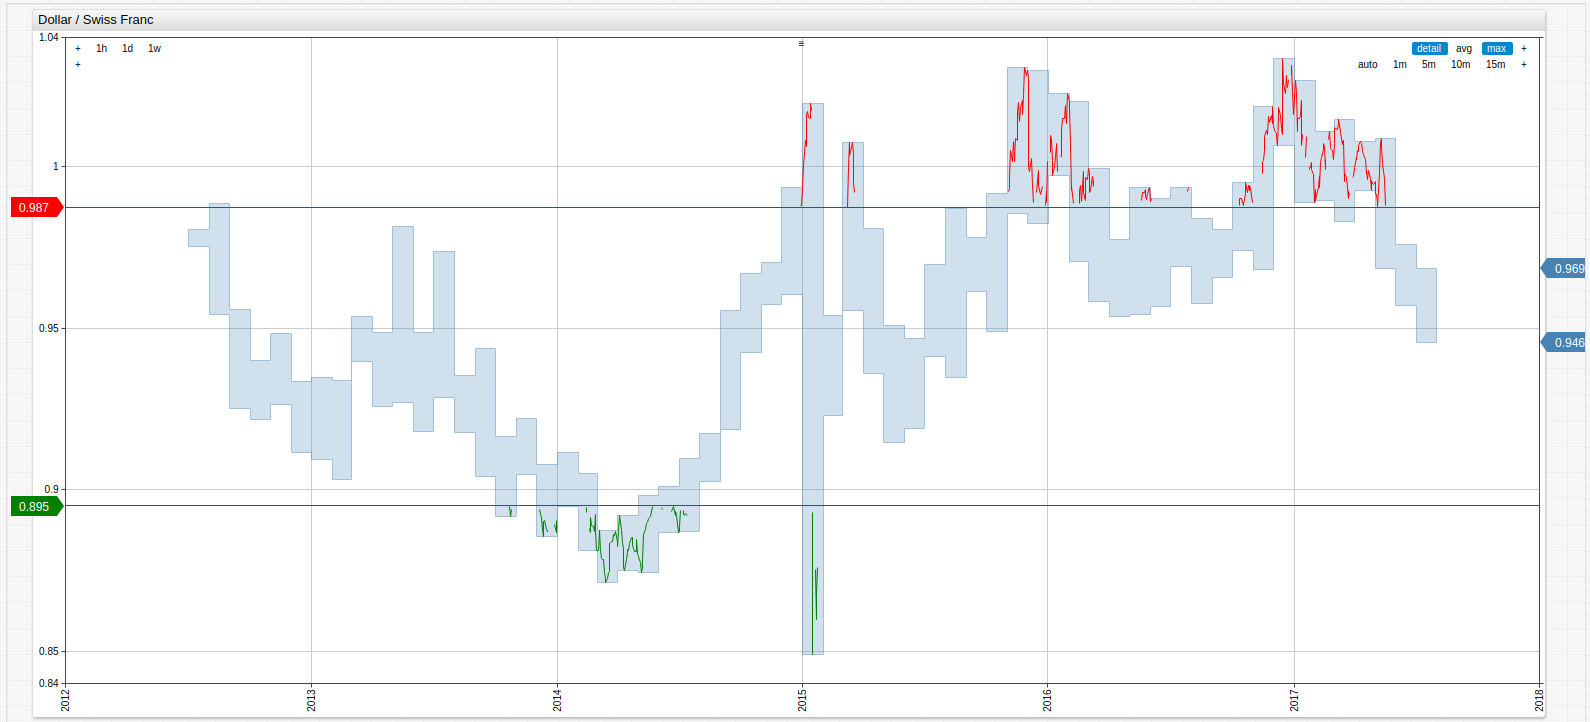
USD v. Swiss Franc
During the worst of the European Debt Crisis which saw European Union per capita debt grow at unprecedented rates across the continent, EU investors sought refuge in the stability of the Swiss Franc, backed by the world-renowned Swiss banking system. Further, the Swiss National Bank removed the peg to the Euro unexpectedly in 2015 causing a huge surge in 2015, clearly visible in the visualization below as a sudden change from a favorable exchange rate for dollar holders to an all-time low for the observed time period.
SELECT date_format(time, 'yyyy') AS "Date", AVG(value) AS "Average Value"
  FROM dexszus
GROUP BY PERIOD(1 YEAR)
| Date | Average Value |
|---|---|
| 2012 | 0.94 |
| 2013 | 0.93 |
| 2014 | 0.91 |
| 2015 | 0.96 |
| 2016 | 0.98 |
| 2017 | 0.99 |
Open the ChartLab visualization above to navigate through time or select a different currency.
Return to the Index
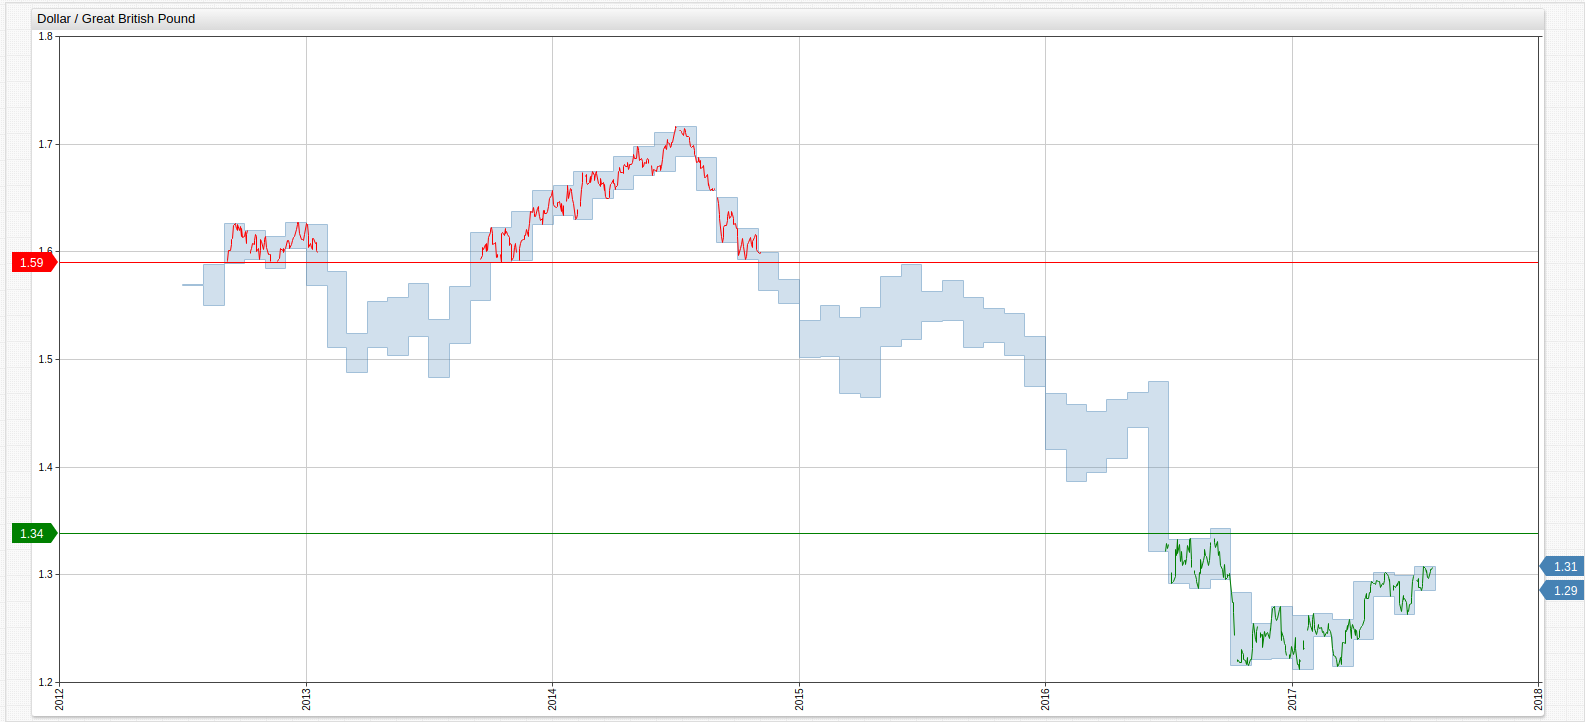
USD v. Great British Pound
Largely influenced by the divisive Brexit vote, the value of the Pound has remained relatively low since the referendum in late June of 2016, which aligns perfectly with the slight depreciation of the Pound in value against the dollar on the chart below.
SELECT date_format(time, 'yyyy') AS "Date", AVG(value) AS "Average Value"
  FROM dexusuk
GROUP BY PERIOD(1 YEAR)
| Date | Average Value |
|---|---|
| 2012 | 1.60 |
| 2013 | 1.56 |
| 2014 | 1.65 |
| 2015 | 1.53 |
| 2016 | 1.36 |
| 2017 | 1.27 |
Average Exchange Rate: 1.50
Open the ChartLab visualization above to navigate through time or select a different currency.
Return to the Index
Asia
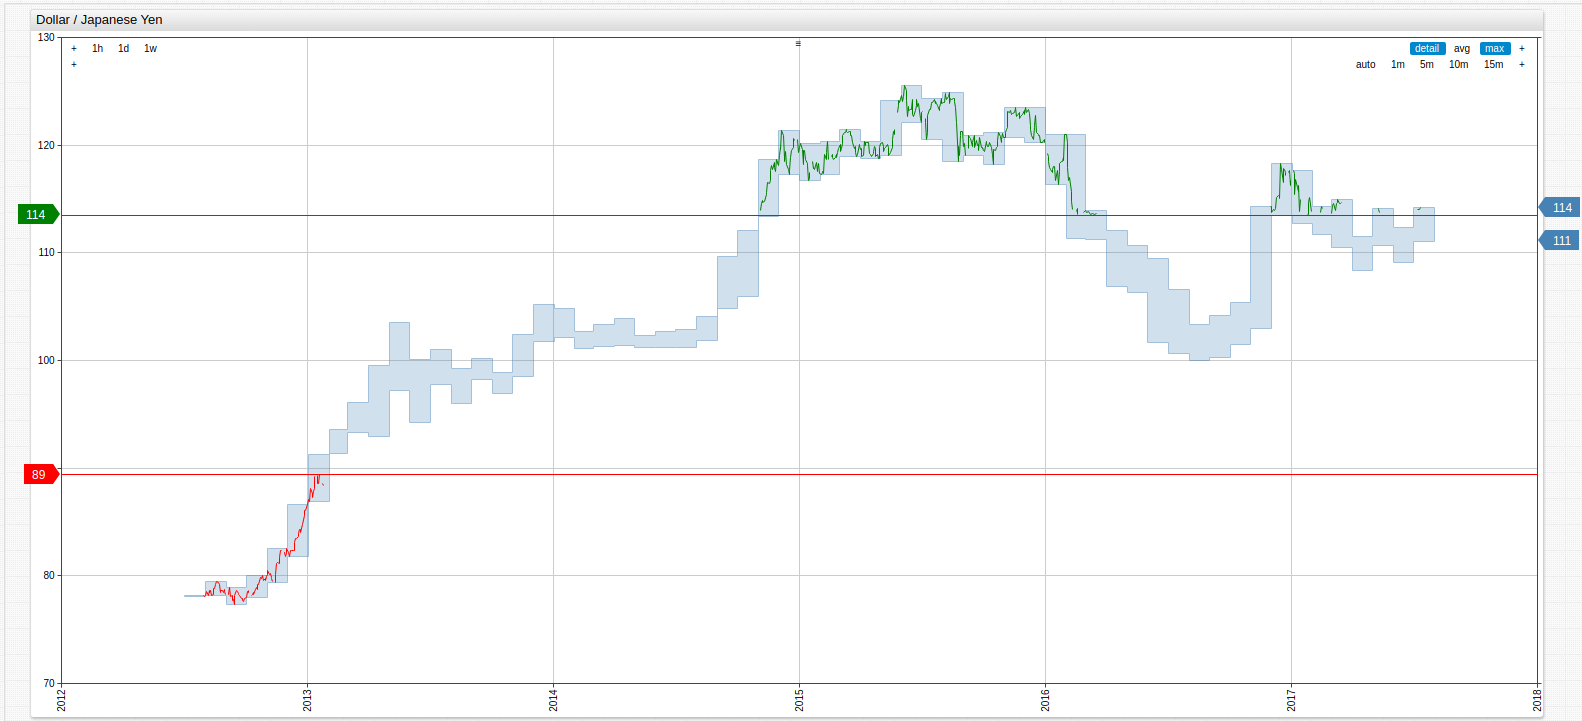
USD v. Japanese Yen
After purchasing trillions of Yen worth of Japanese national debt from the private sector three years ago, the Central Bank of Japan has been watching the gradual decrease in value of the Yen against the dollar. Most analysts, see this fall as controlled and predict a bright future for the Yen as the Central Bank can no longer afford to collect more debt than they already have. However, the rise of the Yen must be managed carefully, as the sudden appreciation of the currency could result in an increase in loan defaults because industries which have taken loans at current Yen prices would be paying them back at a much higher rate.
SELECT date_format(time, 'yyyy') AS "Date", AVG(value) AS "Average Value"
  FROM dexjpus
GROUP BY PERIOD(1 YEAR)
| Date | Average Value |
|---|---|
| 2012 | 80.05 |
| 2013 | 97.60 |
| 2014 | 105.74 |
| 2015 | 121.05 |
| 2016 | 108.66 |
| 2017 | 112.33 |
Open the ChartLab visualization above to navigate through time or select a different currency.
Return to the Index
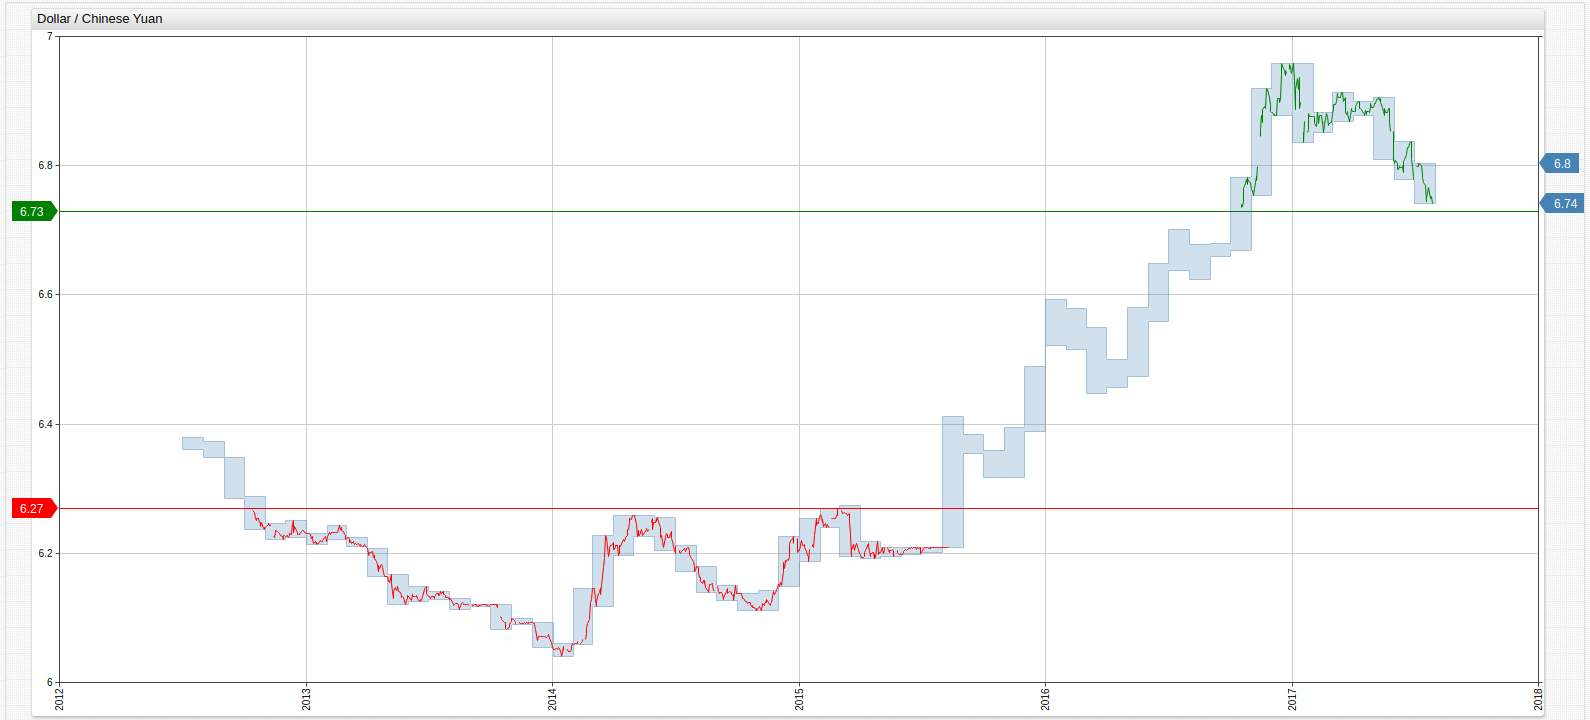
USD v. Chinese Yuan
To prevent dramatic internal inflation, the People's Bank of China closely regulates local, or onshore, trading of the Yuan by fixing the price each day. Although independent officially, the international, or offshore, price of the Yuan usually remains fairly close to its onshore value. Additionally, the PBoC carefully controls the outflow of capital and often hedges their own currency by maintaining positions in international currencies.
SELECT date_format(time, 'yyyy') AS "Date", AVG(value) AS "Average Value"
  FROM dexchus
GROUP BY PERIOD(1 YEAR)
| Date | Average Value |
|---|---|
| 2012 | 6.28 |
| 2013 | 6.15 |
| 2014 | 6.16 |
| 2015 | 6.28 |
| 2016 | 6.64 |
| 2017 | 6.86 |
Open the ChartLab visualization above to navigate through time or select a different currency.
Return to the Index
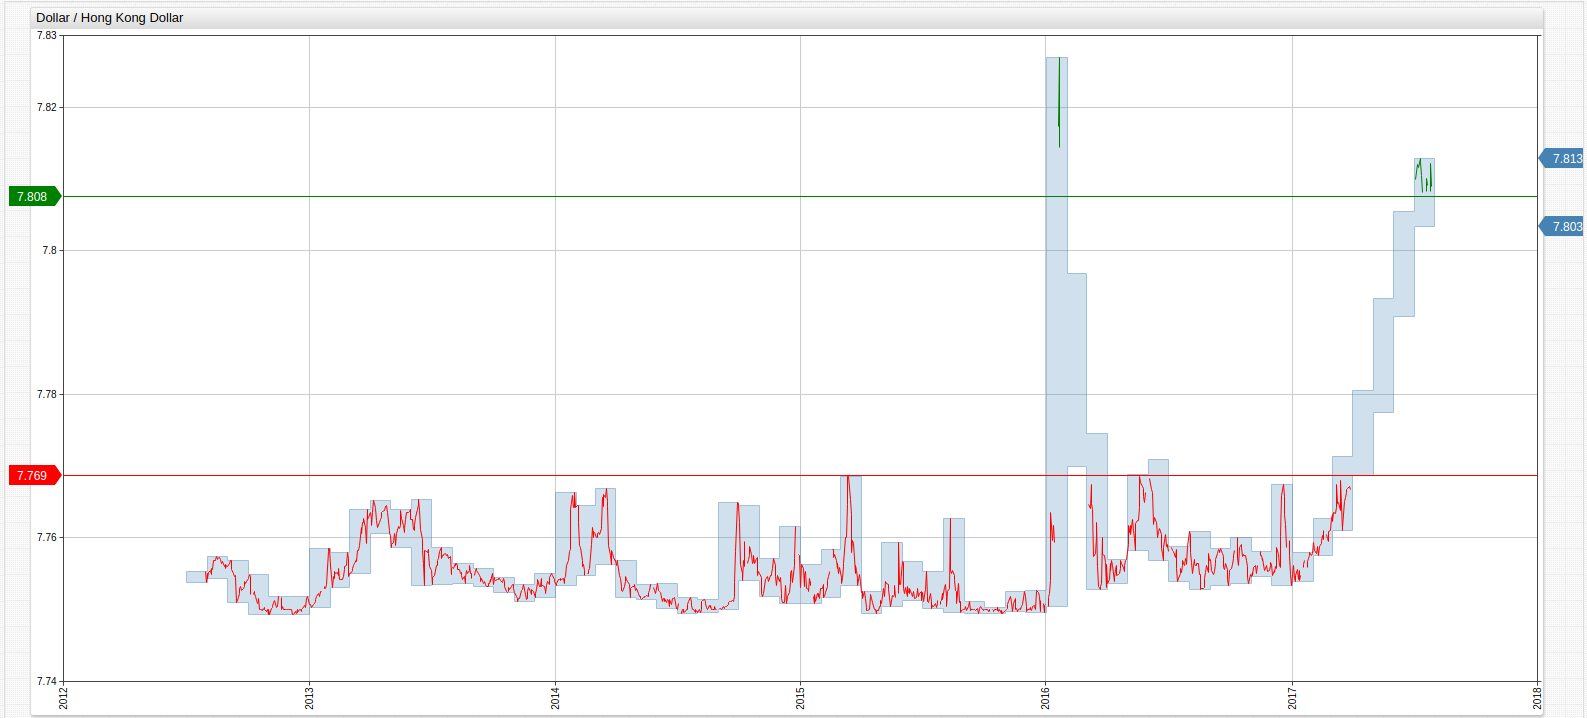
USD v. Hong Kong Dollar
The Hong Kong Dollar is officially pegged to the value of the United States Dollar. Any change in relative value is planned. The "Miracle of the Orient" continues to be one of the most dominant financial markets in the world.
SELECT date_format(time, 'yyyy') AS "Date", AVG(value) AS "Average Value"
  FROM dexhkus
GROUP BY PERIOD(1 YEAR)
| Date | Average Value |
|---|---|
| 2012 | 7.75 |
| 2013 | 7.76 |
| 2014 | 7.75 |
| 2015 | 7.75 |
| 2016 | 7.76 |
| 2017 | 7.78 |
Open the ChartLab visualization above to navigate through time or select a different currency.
Return to the Index
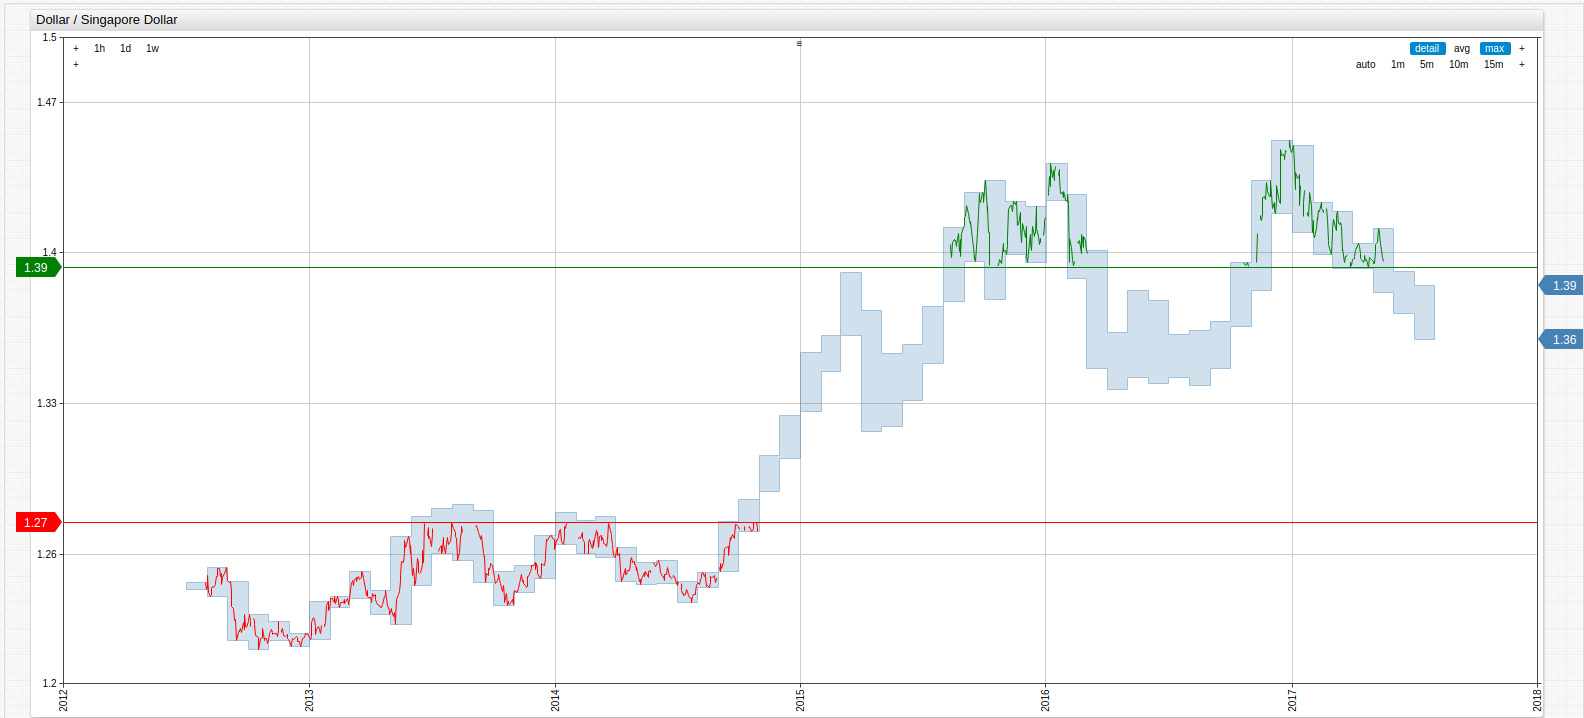
USD v. Singapore Dollar
One of the financial centers of the world, Singapore is home to the second-busiest port in the world and one of the largest oil refining industries worldwide as well. With one of the highest per capita GDP values, Singapore has cemented its place of international importance despite inexplicably loose financial policy whereby the Monetary Authority of Singapore does not regulate currency value by adjusting interest rates, which is common with most central banking systems.
SELECT date_format(time, 'yyyy') AS "Date", AVG(value) AS "Average Value"
  FROM dexsius
GROUP BY PERIOD(1 YEAR)
| Date | Average Value |
|---|---|
| 2012 | 1.23 |
| 2013 | 1.25 |
| 2014 | 1.27 |
| 2015 | 1.37 |
| 2016 | 1.38 |
| 2017 | 1.40 |
Open the ChartLab visualization above to navigate through time or select a different currency.
Return to the Index
North America
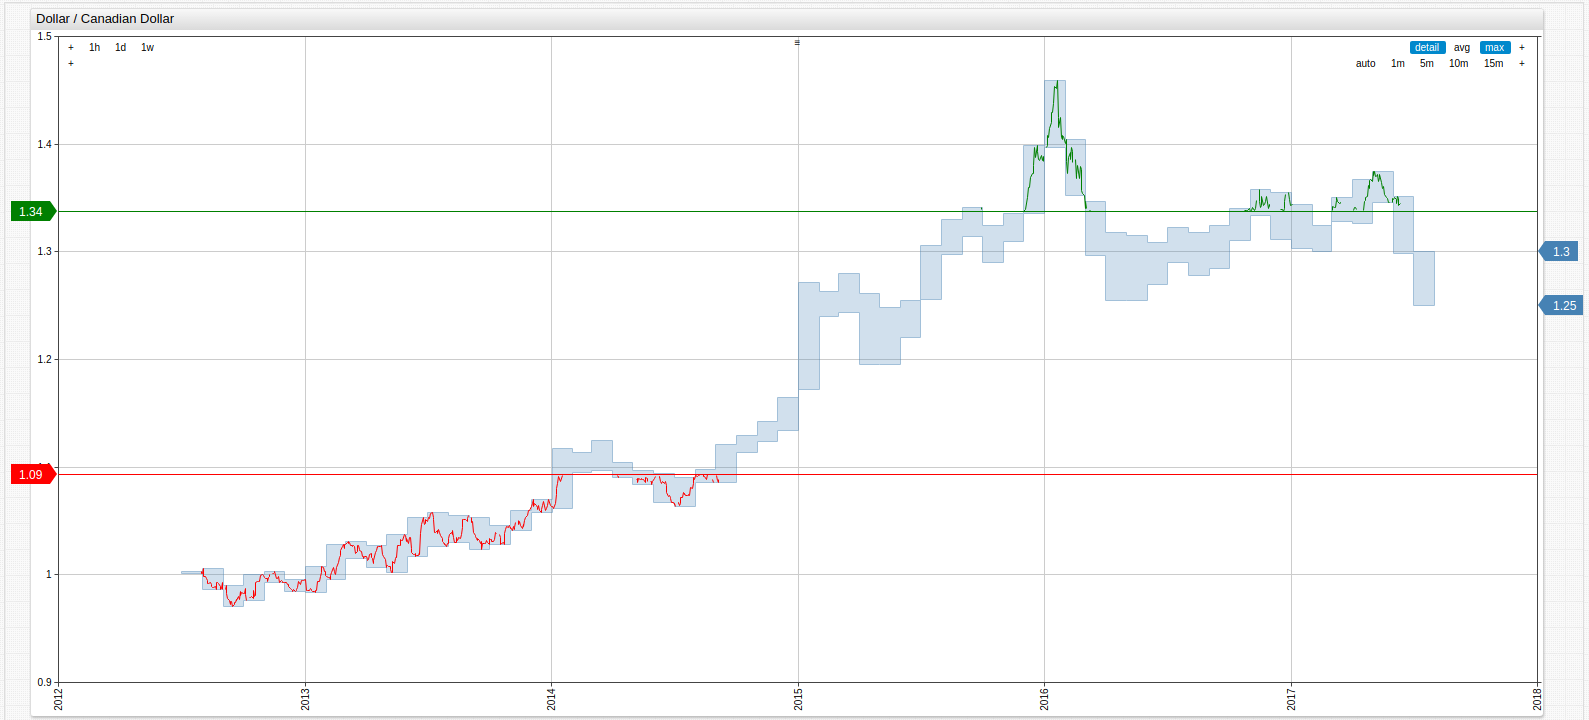
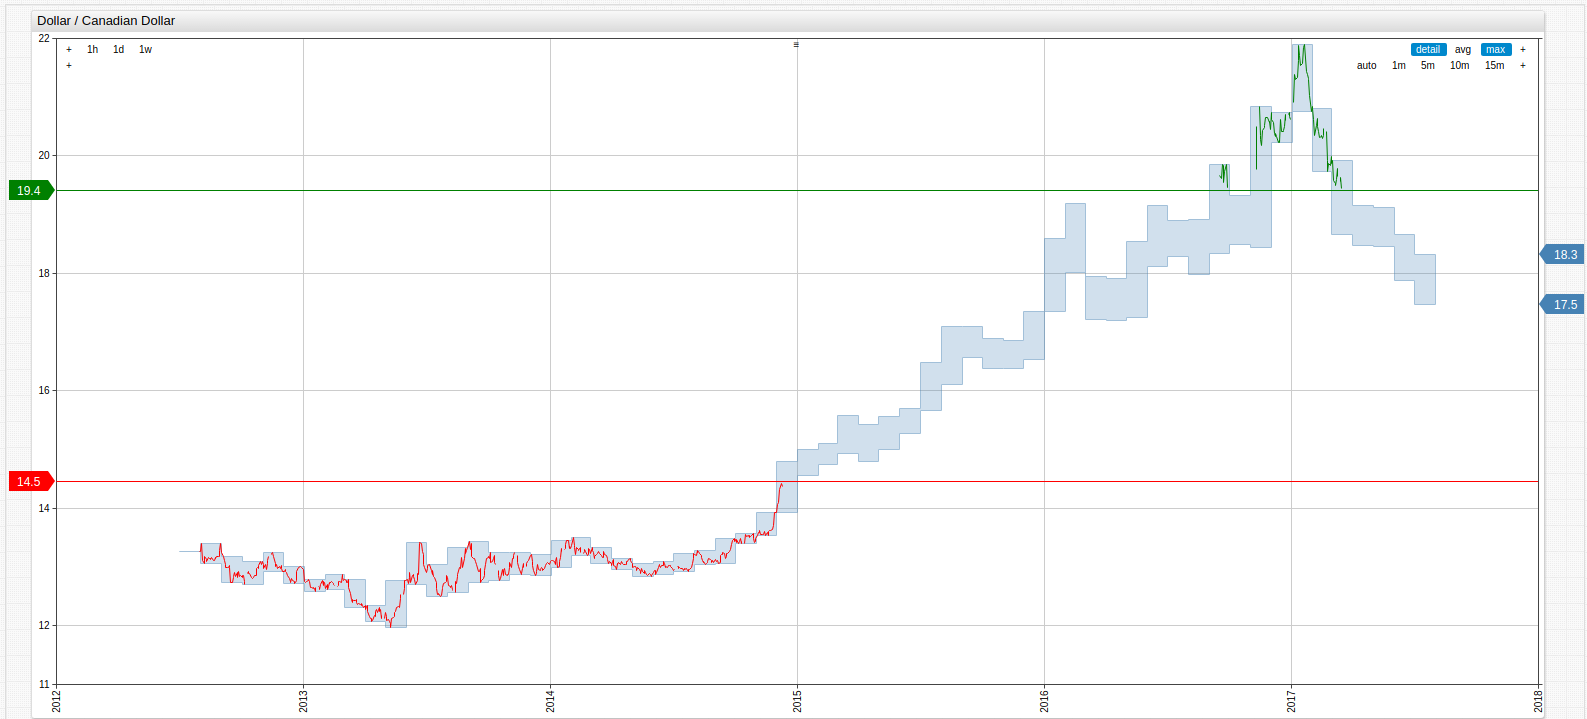
USD v. Canadian Dollar
Relative to the USD, the Canadian dollar has been making a bit of a resurgence in 2017 as United States GDP numbers missed its targets in quarter two. Although dependent on the price of oil due to their large natural reserves, the diverse Canadian economy is one of the few globally-active nations with a significant trade surplus, although that too have been reduced in recent years.
SELECT date_format(time, 'yyyy') AS "Date", AVG(value) AS "Average Value"
  FROM dexcaus
GROUP BY PERIOD(1 YEAR)
| Date | Average Value |
|---|---|
| 2012 | 0.99 |
| 2013 | 1.03 |
| 2014 | 1.10 |
| 2015 | 1.28 |
| 2016 | 1.32 |
| 2017 | 1.33 |
Open the ChartLab visualization above to navigate through time or select a different currency.
Return to the Index
USD v. Mexican Peso
Boasting the highest per capita income of Latin America, the Mexican economy has continued to demonstrate healthy growth over the last several decades. The number one producer of automobiles in North America also enjoys a $46 billion trade surplus with the United States, and is the 9th ranked owner of United States government debt. This dependence on America affords Mexico the ability to spur dramatic internal growth that has led to the creation of a booming electronics sector, but at the cost of a certain amount of reliance on the United States as roughly half of the imports and exports of Mexico originate or end up on U.S. soil.
SELECT date_format(time, 'yyyy') AS "Date", AVG(value) AS "Average Value"
  FROM dexmxus
GROUP BY PERIOD(1 YEAR)
| Date | Average Value |
|---|---|
| 2012 | 13.00 |
| 2013 | 12.76 |
| 2014 | 13.30 |
| 2015 | 15.87 |
| 2016 | 18.67 |
| 2017 | 19.18 |
Open the ChartLab visualization above to navigate through time or select a different currency.
Return to the Index