Norway: Electric Vehicles Close the Gap with Diesel in 2016
The central statistical agency of Norway, SSB, released its annual car registration statistics on March 28, 2017. While the key trends such as the rotation out of gasoline models are still observable, the dataset delivered a few surprises.
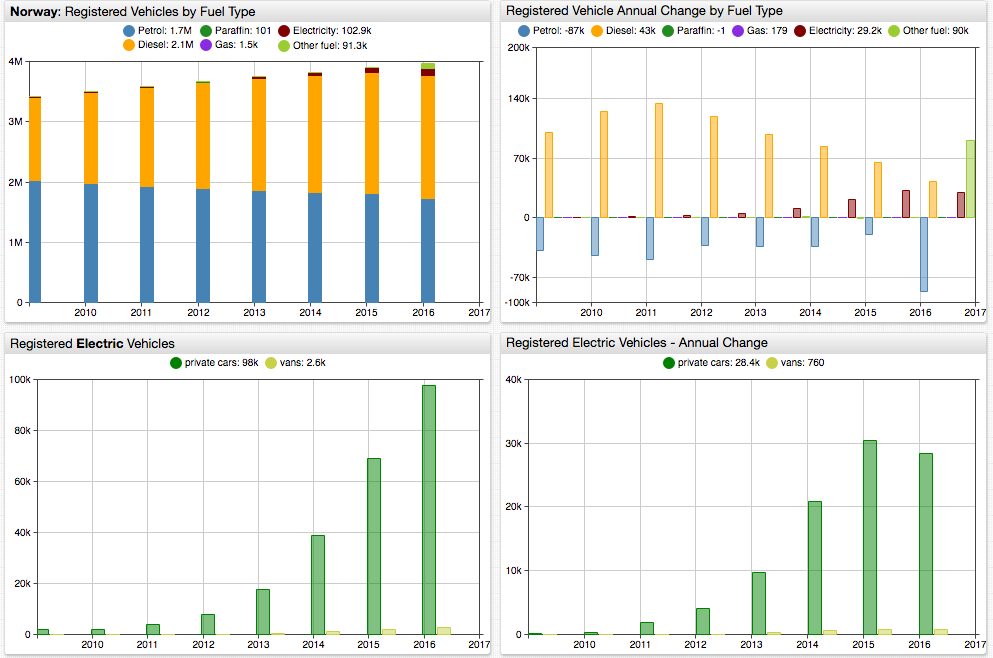
- The electric vehicles (EVs) continued to gain ground however the pace of growth has slowed down. The installed base of EVs reached 100K units, the annual increase is 29,179 vehicles compared to 31,271 vehicles in 2015.
- The unit growth of the EV installed base is getting closer to being on par with the diesel segment: 29179/42824 or 68% in 2016 versus 31271/64708 or 48% in 2015.
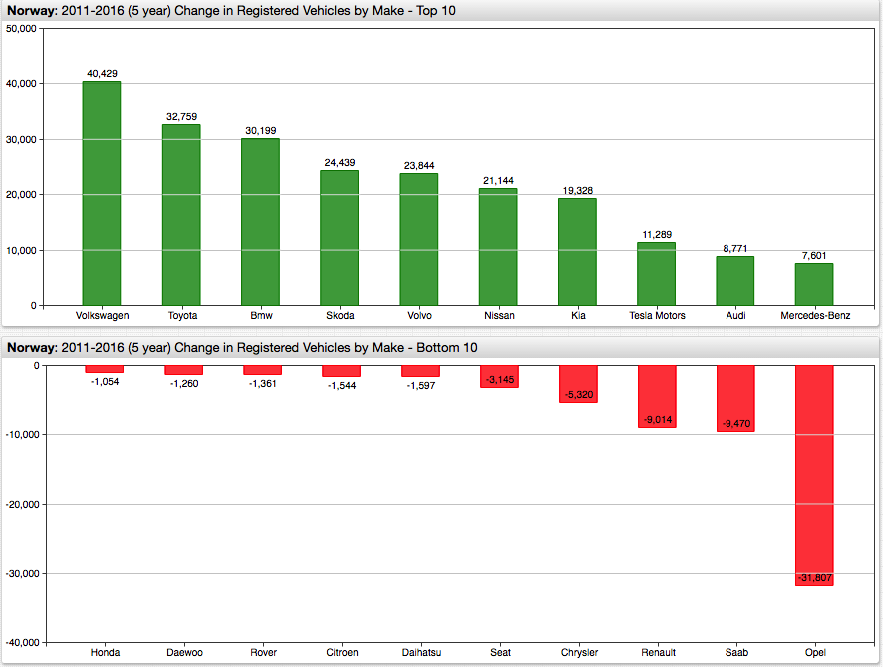
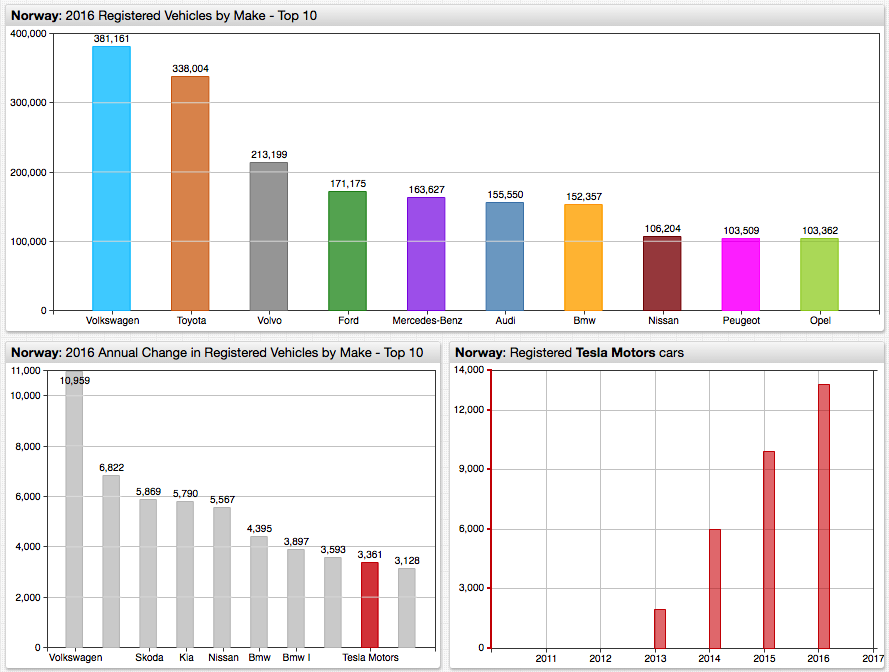
- The total number of registered Tesla Motors cars increased by 3361 units in 2016 compared to 3904 units in 2015, suggesting competition with less expensive EV models. Tesla's share in new EV registrations decreased to 11.5% from 12.5% in 2015 and from 18.7% in 2014.
- Starting with 2016, hybrid cars are classified under the
Other fuelcategory (hence 90077 y-o-y growth) making direct comparisons for the old Petrol category difficult.
Total Registered Vehicles
SELECT date_format(time, 'yyyy') AS "Year",
  sum(value) AS "Vehicles",
  sum(value) - LAG(sum(value)) AS "Change",
  ROUND(100*(sum(value) - LAG(sum(value)))/LAG(sum(value)), 1) AS "Change, %"
FROM nor.registered_vehicles
  WHERE tags.vehicle_type = 'Total'
  GROUP BY time
| Year | Vehicles | Change | Change, % |
|------|----------|--------|-----------|
| 2008 | 3352344  | null   | null      |
| 2009 | 3413877  | 61533  | 1.8       |
| 2010 | 3494873  | 80996  | 2.4       |
| 2011 | 3581905  | 87032  | 2.5       |
| 2012 | 3671885  | 89980  | 2.5       |
| 2013 | 3747489  | 75604  | 2.1       |
| 2014 | 3817783  | 70294  | 1.9       |
| 2015 | 3894267  | 76484  | 2         |
| 2016 | 3969612  | 75345  | 1.9       |
Registered Electric Vehicles
SELECT date_format(time, 'yyyy') AS "Year",
  value AS "Electric Vehicles",
  value - LAG(value) AS "Change",
  ROUND(100*(value - LAG(value))/LAG(value), 1) AS "Change, %"
FROM nor.registered_vehicles
  WHERE tags.fuel_type = 'Electricity'
  -- tags.fuel_type = 'Diesel'
  AND tags.vehicle_type = 'Total'
ORDER BY time
- Electricity
| Year | Electric Vehicles | Change | Change, % |
|------|-------------------|--------|-----------|
| 2008 | 2834              | null   | null      |
| 2009 | 3222              | 388    | 13.7      |
| 2010 | 3946              | 724    | 22.5      |
| 2011 | 6185              | 2239   | 56.7      |
| 2012 | 10706             | 4521   | 73.1      |
| 2013 | 21012             | 10306  | 96.3      |
| 2014 | 42467             | 21455  | 102.1     |
| 2015 | 73738             | 31271  | 73.6      |
| 2016 | 102917            | 29179  | 39.6      |
- Diesel
| Year | Diesel Vehicles | Change | Change, % |
|------|-----------------|--------|-----------|
| 2008 | 1288795         | null   | null      |
| 2009 | 1388716         | 99921  | 7.8       |
| 2010 | 1513639         | 124923 | 9         |
| 2011 | 1647282         | 133643 | 8.8       |
| 2012 | 1765833         | 118551 | 7.2       |
| 2013 | 1863187         | 97354  | 5.5       |
| 2014 | 1946693         | 83506  | 4.5       |
| 2015 | 2011401         | 64708  | 3.3       |
| 2016 | 2054225         | 42824  | 2.1       |
Total Vehicle Registrations by Fuel Type

Installed Base Changes by Make over a 5-year period
Tesla Motors Performance
You can take a closer look at the statistics by following the below steps to install your own ATSD instance.
Install the ATSD database from a Docker image:
docker run \
 --detach \
 --name=atsd \
 --publish 8443:8443 \
 axibase/atsd:latest
Log in to ATSD and configure the pre-defined administrator account.
Import the
csv-parser-nor-configs.xmlparser definitions on Configuration > Parsers: CSV page.Export files from Statbank in Matrix TSV format (see instructions at the end of this article) or upload prepared TSV files as outlined in steps 5 and 6 below.
Upload the
total.tsvfile using thenor-transportparser.Upload the
by-make-1.tsvandby-make-2.tsvfiles using thenor-transport-makeparser.To check that data has been imported, open the SQL Console tab from the side menu and execute this query:
SELECT datetime, value
  FROM nor.registered_vehicles_by_make
WHERE tags.make = 'Tesla Motors'
  ORDER BY datetime
- Execute SQL queries for
nor.registered_vehiclesandnor.registered_vehicles_by_maketo analyze statistics in tabular format using SQL syntax implemented in ATSD. - Create new visualizations on the Configuration > Portals page using chart configurations from the ChartLab examples above.
Feel free to contact Axibase with installation and technical support issues via the feedback form.
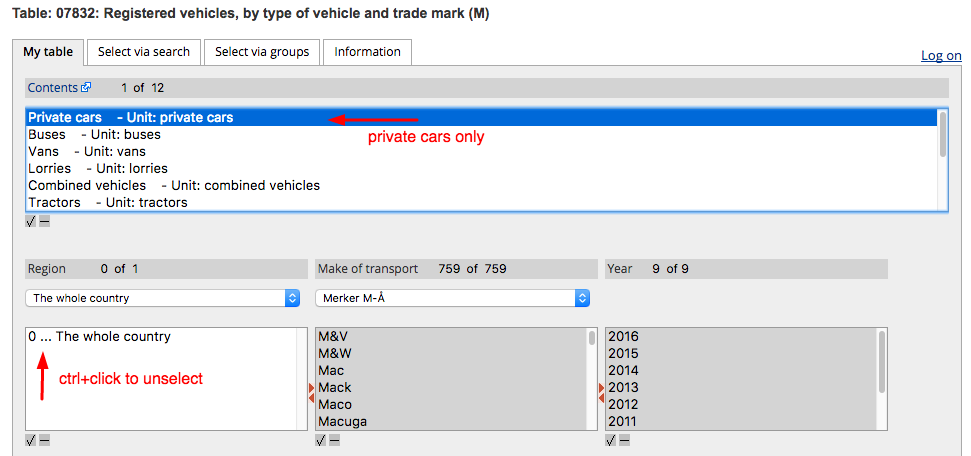
Exporting data from StatBank
- Registered motor vehicles, by type of transport and type of fuel (M).
Configuration Form: link
- Format: Matrix TSV
- Summation: by Contents
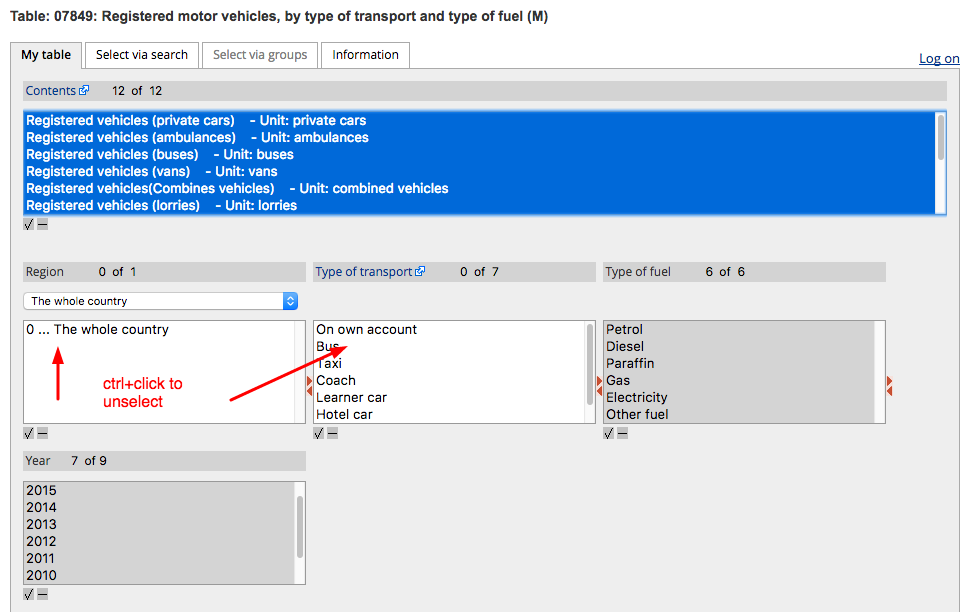
- Registered vehicles, by type of vehicle and trade mark (M).
Configuration Form: link
- Format: Matrix TSV