Climate Change: Back to the Drawing Board

Introduction
The Paris Climate Accords are the most recent iteration of the United Nations Framework Convention on Climate Change, a near-universally recognized treaty ratified by the General Assembly of the United Nations in 1992. Although non-binding, the Paris Agreement is designed to curb greenhouse gas emissions though diplomacy, self-regulation, and what amounts to international peer pressure; the agreement seeks to provide aid for countries which are still developing energy infrastructure.
Proponents of the agreement see the non-binding nature of the pact as an improvement from the now defunct Kyoto Protocol, which promised an imposed action plan for countries which do not meet emissions reduction targets, but detractors claim that this lack of enforceability creates lopsided results; countries like America and Great Britain invest heavily in green options at great personal expense while some of the largest producers of greenhouse gas emissions like China and India, will not even begin to see a peak in their production for up to ten years in the future.
Methodology
With New York State data which examines greenhouse gas emissions from fuel consumption over a time period that begins in 1990 and continues to 2014, Axibase data scientists can examine the efforts of New York to curb domestic greenhouse gas emission, explore the sector as a whole, view the results of the work of many states side by side, and analyze the results of several decades of effort. The New York State data can be extrapolated to serve as a microcosm for the efforts of the entire country.
The data tracks information from diverse sectors of the economy: industrial, residential, commercial, and transportation. Additionally, there are figures which concern energy imported into New York State. This is an interesting and important metric to consider because externally produced energy makes up more than half of the New York State energy market.
Data
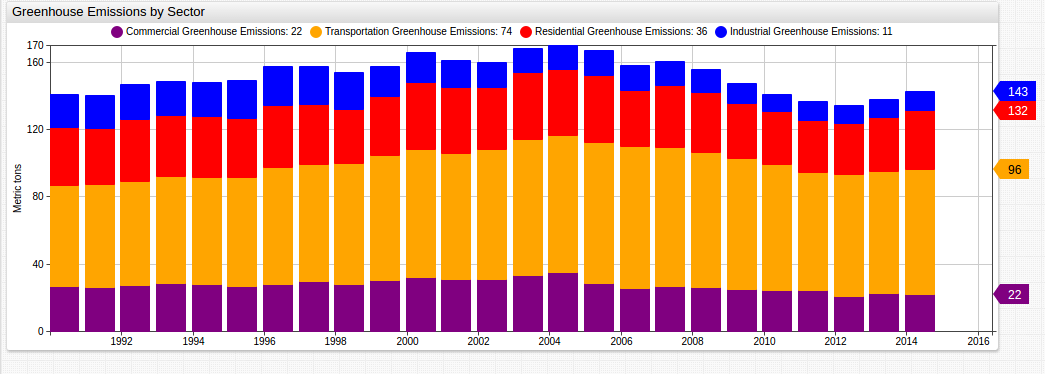

Analyze total emissions from each sector to get a clearer representation of the complete data that a simpler chart would neglect.
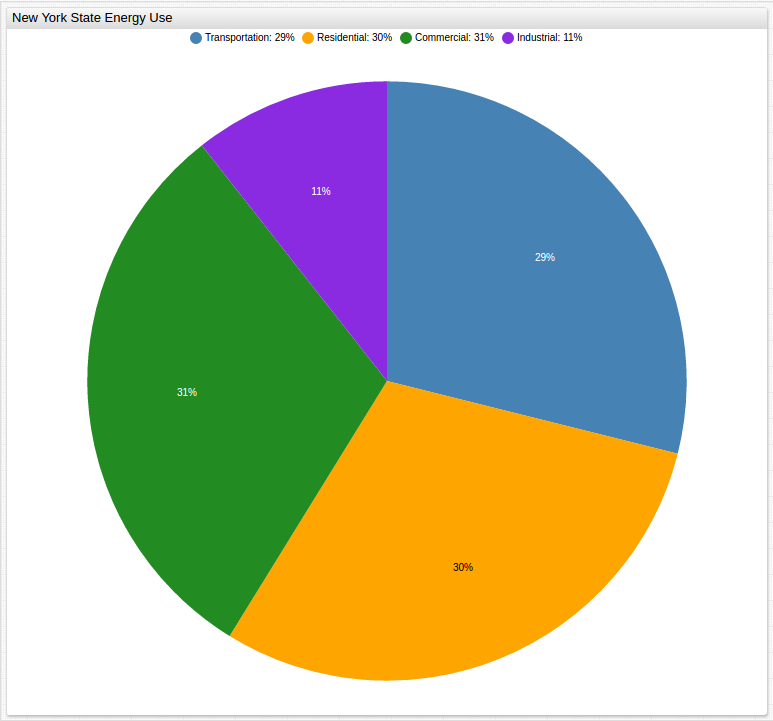
The current picture of New York State energy consumption sorted by end-use sector based on 2015 data from the United States Energy Information Agency.
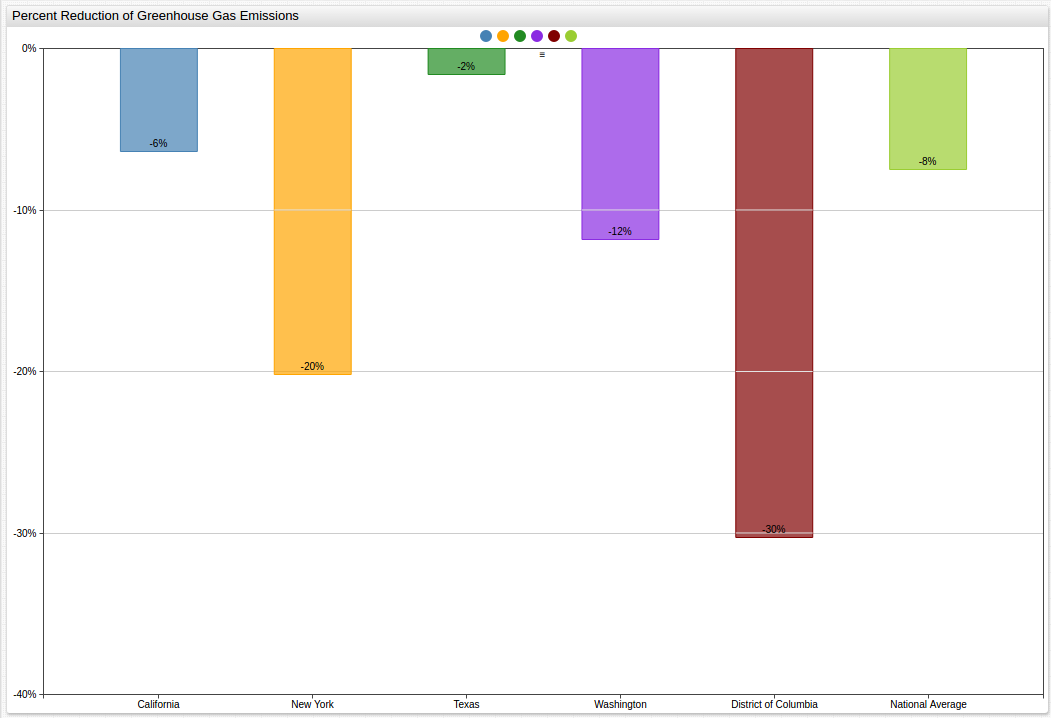
Using time series data from the Energy Information Agency, the results of efforts to reduce greenhouse gas emissions are shown relative to other states and territories from 2000 to 2014 alongside the United States national average.
Advanced charting can be done for side-by-side comparison of relevant data:
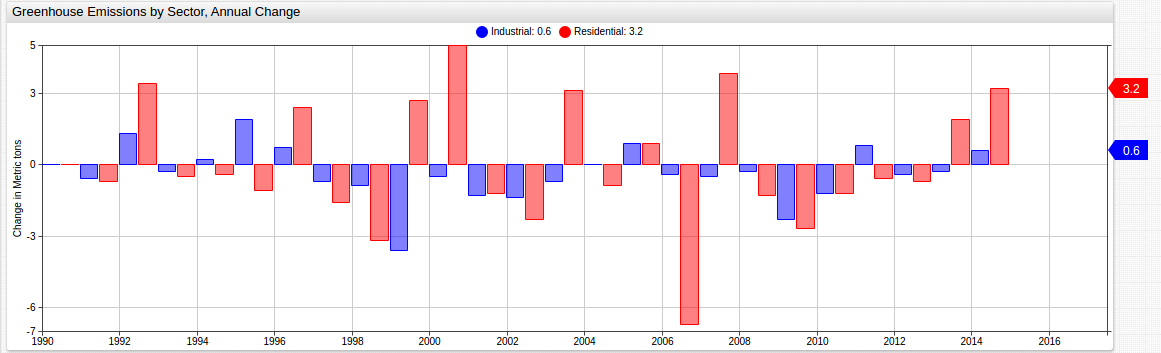
When analyzing emissions from two sectors of the New York State energy market, a simultaneous comparison highlights the achievements of the industrial sector and the shortcomings of the residential sector.
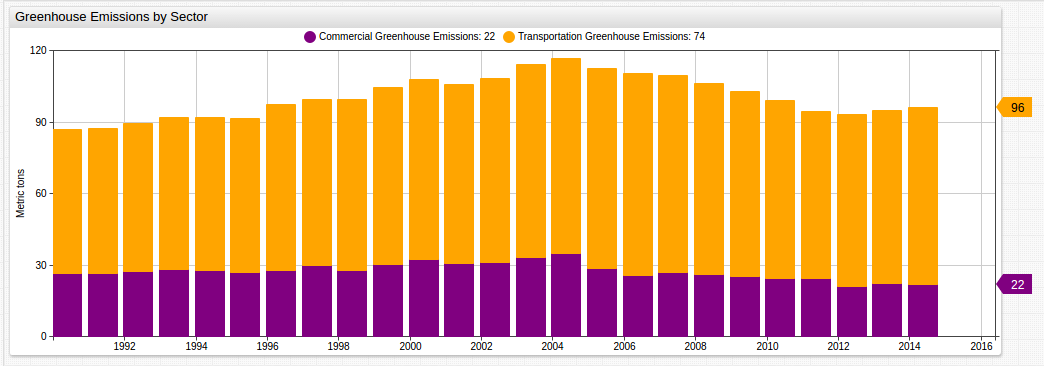
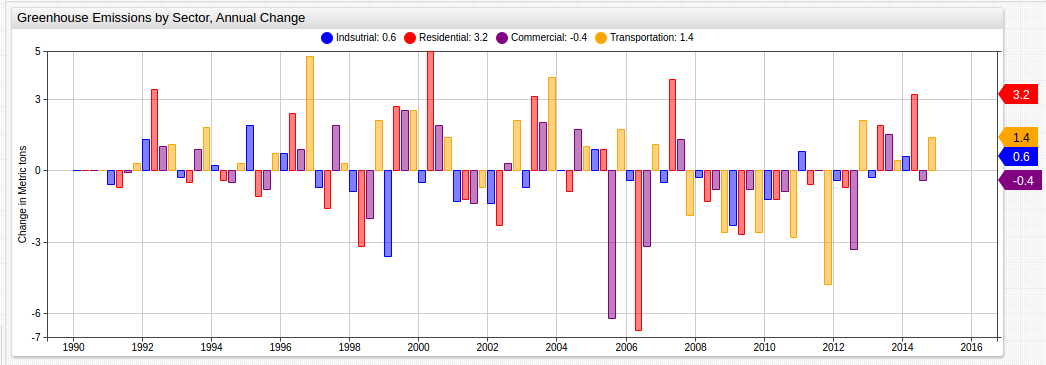
Although similar when comparing percent change, a stacked comparison shows the stark difference in absolute change of two disparate sectors.
A histogram that displays all sectors together highlights trends that may be otherwise missed, such as the sharp decrease in emissions from all sectors between 2007 and 2012.
Analysis
During the observed period, New York State greenhouse gas emissions are shown to decrease noticeably with a difference of more than 20 million metric tons of gas emitted in the year 2014 when compared to 1990 data. Although there is a recent trend indicating an increase in greenhouse gas emission, on the whole, New York State is lauded as a prime example of the power of green legislation, evidenced by a dramatic overall reduction of emissions. The energy sector makes up the largest amount of internal greenhouse gas emission and analysts are encouraged to see an energy market dominated by coal production able to reduce emissions in the production sector by more than 50% over the last two and a half decades.
The consumer sector shows little net improvement throughout the observed period and it is also the source of an ever-growing share of total emissions. Despite a sharp peak in 2004, the State of New York has produced encouraging results in the commercial sector in the last decade. The commercial sector is defined as the emissions from non-residential use of fossil fuels and waste management. New York State has seen the disappearance of over 100,000 manufacturing jobs in the last two decades, many to overseas manufacturers, which contributes to the substantial decrease in greenhouse gas emissions. The effects of the efforts of New York to reduce greenhouse gas emission by increasing bicycle and bus infrastructure have produced noticeable results as well and with the downturn of the coal industry following the subprime mortgage crisis that left former industry titans penniless and facing bankruptcy, the state of New York and its historically coal-heavy energy sector have been forced to find new alternatives to supply their energy needs, including importing energy from neighboring states and Canada.
New York is considered a model state by environmentalists who point to the per capita consumption rate, the second lowest in the nation behind only the District of Columbia, as the gold standard of what is achievable for other populous states like Texas that seem to be lagging behind in the green transition. Considering per sector usage of fossil fuels alongside emissions helps illuminate the concerns of analysts who claim that while America may be making strides on a macro scale, more changes are needed to see the kinds of goals laid out by the previous administration reached in due time.
The largest push from green media shifts the focus of reducing the American carbon footprint to the individual. Low flow toilets, florescent light bulbs, and a host of other green technologies have been steadily making waves on the consumer market, making claims that they are the key to reducing greenhouse gas emission, however an examination of the residential emission data tells another story, showing that emissions by residents of the state in the present are greater than the 1990 numbers. To be fair, that uptick in consumer-level emission is a recent trend, with several years during the early 2010's showing slightly lower greenhouse gas emissions. Nonetheless, residential emissions make up just 12% of total American greenhouse gas emission, and 30% of the state total. This figure does not include emissions from consumer motor vehicles, typically considered to be the most harmful to the environment, which are included in transportation data. Despite earnest intent, it seems that at least on the consumer level, greenhouse gas emissions have not changed dramatically. For the observed period, the standard deviation of the residential sector is 2.82, which accounts for just 7.95% of the observed mean.
Conclusions
The true effects of the President's decision have yet to be seen, as the clause in the Paris Agreement that relates to voluntary withdrawal states a country must give almost half a decade of notice to the other signatories, but some legal experts have theorized that the President may be able to withdraw from the original 1992 framework to bypass the lengthy withdrawal process in as soon as a year. Further, most of the mechanisms of the Paris Agreement are set to begin taking effect in 2020, making them mostly symbolic at present. In the meantime, however, public data provided by states like New York can offer a unique insight to the policies currently in place and help analysts make predictions about the validity of future efforts.
Action Items
Users can replicate data analysis shown here.
Install Docker.
Download the
docker-compose.ymlfile to launch the Axibase Time Series Database (ATSD) container bundle.Launch containers:

- Open ATSD user interface and begin analyzing your data.
Contact Axibase with any questions here.