Storage Finder
ATSD Storage Finder is an alternative to the default Graphite storage finder.
Refer to Graphite and ATSD Storage Finder installation instructions.
ATSD Storage Finder configuration parameters are set in the local_settings.py file.
The configurations are set under ATSD_CONF.
There are two versions of the ATSD Storage Finder:
- ATSD Storage Finder Default – allows you to view metrics as they are stored in ATSD.
- ATSD Storage Finder Virtual – allows you to create custom paths to entities, metrics, and tags.
ATSD Storage Finder settings in local_settings.py:
STORAGE_FINDERS = (
    'atsd_finder.AtsdFinder',
    'atsd_finder.AtsdFinderV',
    'graphite.finders.standard.StandardFinder',
)
ATSD Storage Finder and ATSD Storage Finder Virtual can be used together (their settings can be combined in ATSD_CONF).
ATSD Storage Finder Default
STORAGE_FINDERS = (
    'atsd_finder.AtsdFinder',
)
local_settings.py settings:
| Setting | Description | Default Value |
|---|---|---|
| url | ATSD hostname or IP | localhost:8088 |
| username | ATSD user username | – |
| password | ATSD user password | – |
| entity_folders | List of folders for grouping entities by name. Grouping is done according to the beginning of each entity name. If entity name is matched to a folder name, then the entity name is listed in that folder. For example if an entity name begins with com (like com_axibase)then the entity is listed in the folder called 'com'.If the entity name does not satisfy any of the listed folder names, then the entity is listed in the default _ folder. | 'entity_folders' : 'abcdefghijklmnopqrstuvwxyz_'Generates folders from a to z (iterates through the string). |
| metric_folders | List of folders for grouping metrics by name. Grouping is done according to the beginning of each metric name. If the metric name is matched to a folder name, then the metric is listed in that folder. For example if a metric name begins with statsd (statsd_cpuload_avg5)then the metric is listed in a folder called 'statsd'.If metric name does not satisfy any of the listed folder names, the metric is placed into the "_" folder by default. | 'metric_folders' : 'abcdefghijklmnopqrstuvwxyz_'Generates folders from a to z, iterates through the string. |
| aggregators | List of aggregators. | 'aggregators' : {'avg': 'Average','min': 'Minimum','max': 'Maximum','sum': 'Sum','count': 'Count','first': 'First value','last' : 'Last value','percentile(99.9)': 'Percentile 99.9%','percentile(99)': 'Percentile 99%','percentile(99.5)': 'Percentile 99.5%','percentile(95)': 'Percentile 95%','percentile(90)': 'Percentile 90%','percentile(75)': 'Percentile 75%','median': 'Median','standard_deviation': 'Standard deviation','median_abs_dev': 'Median absolute deviation','delta': 'Delta','wavg' : 'Weighted average','wtavg': 'Weighted time average'} |
If you use an underscore at the beginning of a setting value (entity_folders or metric_folders), then all folders that do not satisfy any other setting are placed there.
For example:
'_other'
Storage Finder Example
local_settings.py example.
ATSD_CONF = {
    'url': 'http://atsd_hostname:8088',
    'username': 'username',
    'password': 'password',
    'entity_folders': ['_other',
                       'com_',
                       'nur',
                       'dkr',
                       'us',
                       'emea-1',
                       'emea-2'],
    'metric_folders': ['_other',
                       'nmon',
                       'collectd',
                       'statsd',
                       'vmware',
                       'wordpress'],
    'aggregators':    {'avg' : 'Average',
                       'min' : 'Minimum',
                       'max' : 'Maximum',
                       'median' : 'Median',
                       'delta' : 'Delta'}
}
ATSD Storage Finder Virtual
STORAGE_FINDERS = (
    'atsd_finder.AtsdFinderV',
)
ATSD Storage Finder Virtual has an additional setting: views.
Under views, use type to control which folders to display in the graphite-web interface.
| Type | Description |
|---|---|
'type': 'entity folder' | Node representing entity filters. |
'type': 'entity' | Node representing entities. |
'type': 'tag' | Node representing tag values. |
'type': 'metric folder' | Node representing metric filters. |
'type': 'metric' | Node representing metrics. |
'type': 'interval' | Node representing selection intervals. |
'type': 'collection' | Node representing different types of nodes. |
'type': 'aggregator' | Node representing statistics. |
'type': 'period' | Node representing statistics periods. |
local_settings.py example with "views"
ATSD_CONF = {
    'views': {'DistributedGeoMon':
    [
        {'type': 'entity folder',
            'value': [{'com.axibase'  : 'com.axibase'},
                    {'com.axibase.*': 'com.axibase.*'}]},
        {'type': 'entity',
            'value': ['*']},
        {'type': 'tag',
            'value': ['path'],
            'global': [{'type': 'metric',
                        'value': ['distgeomon.connect-dns']}]},
        {'type': 'tag',
            'value': ['geo-target', 'geo-source']},
        {'type': 'metric folder',
            'value': [{'distgeomon.response*': 'response'},
                    {'distgeomon.connect*' : 'connect'}]},
        {'type': 'metric',
            'value': ['*']},
        {'type': 'interval',
            'value': [{'count': '30',
                    'unit': 'minute',
                    'label': '30 minutes'},
                    {'count': '2',
                    'unit': 'hour',
                    'label': '2 hours'},
                    {'count': '1',
                    'unit': 'day',
                    'label': '1 day'}]},
        {'type': 'collection',
            'value': [{'type': 'aggregator',
                    'value': [{'detail': 'Detail'}],
                    'is leaf': True},
                    {'type': 'const',
                    'value': ['Aggregate']}]},
        {'type': 'aggregator',
            'value': [{'count'        : 'Count'},
                    {'min'          : 'Minimum'},
                    {'max'          : 'Maximum'},
                    {'avg'          : 'Average'},
                    {'median'       : 'Median'},
                    {'sum'          : 'Sum'},
                    {'percentile(75)': 'Percentile 75%'},
                    {'delta'        : 'Delta'}]},
        {'type': 'period',
            'value': [{'count': '30',
                    'unit': 'second',
                    'label': '30 seconds'},
                    {'count': '10',
                    'unit': 'minute',
                    'label': '10 minutes'},
                    {'count': '1',
                    'unit': 'hour',
                    'label': '1 hour'}],
            'is leaf': True}
        ]
    }
}
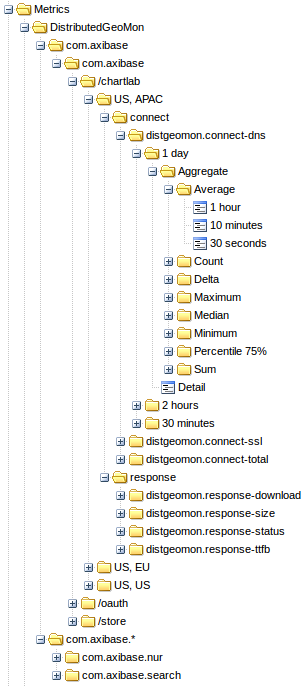
"views" example breakdown

{'type': 'entity folder',
 'value': [{'com.axibase'  : 'com.axibase'},
           {'com.axibase.*': 'com.axibase.*'}]}
Below two entity folders are shown. One filters out only the entity com.axibase. The other one filters out entities that begin with com.axibase.

{'type': 'entity',
 'value': ['*']}
List of entities filtered by the folder they’re in.

{'type': 'tag',
 'value': ['path'],
 'global': [{'type': 'metric',
             'value': ['distgeomon.connect-dns']}]}
Values of the tag path. To retrieve tags we need a metric; however, it has not been established yet. We can make a global token inside this one to make the metric become distgeomon.connect-dns until stated otherwise.

{'type': 'tag',
 'value': ['geo-target', 'geo-source']}
Values of tags geo-target and geo-source separated by a comma.

{'type': 'metric folder',
 'value': [{'distgeomon.response*': 'response'},
           {'distgeomon.connect*' : 'connect'}]}
Two metric folders.
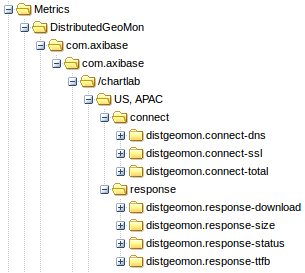
{'type': 'metric',
 'value': ['*']}
List of metrics.

{'type': 'interval',
 'value': [{'count': 30,
            'unit': 'minute',
            'label': '30 minutes'},
           {'count': 2,
            'unit': 'hour',
            'label': '2 hours'},
           {'count': 1,
            'unit': 'day',
            'label': '1 day'}]}
List of aggregation intervals.

{'type': 'collection',
 'value': [{'type': 'aggregator',
            'value': [{'detail': 'Detail'}],
            'is leaf': True},
           {'type': 'const',
            'value': ['Aggregate']}]}
If we want to make two different types of tokens at the same level, for example a leaf and a branch (as shown below), we can create a collection. In this collection, there is a detail aggregator, which is a leaf. Click it and see the chart and an Aggregate folder, which expands the tree further.
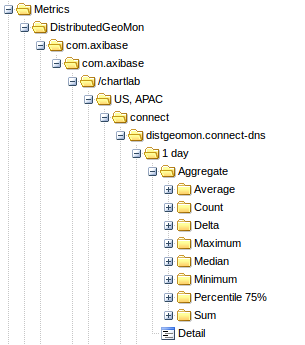
{'type': 'aggregator',
 'value': [{'count'        : 'Count'},
           {'min'          : 'Minimum'},
           {'max'          : 'Maximum'},
           {'avg'          : 'Average'},
           {'median'       : 'Median'},
           {'sum'          : 'Sum'},
           {'percentile(75)': 'Percentile 75%'},
           {'delta'        : 'Delta'}]}
The list of aggregators is provided below. First we create a named ATSD aggregator.
{'type': 'period',
 'value': [{'count': 30,
            'unit': 'second',
            'label': '30 seconds'},
           {'count': 10,
            'unit': 'minute',
            'label': '10 minutes'},
           {'count': 1,
            'unit': 'hour',
            'label': '1 hour'}],
 'is leaf': True}
Final leaf representing possible aggregation periods.
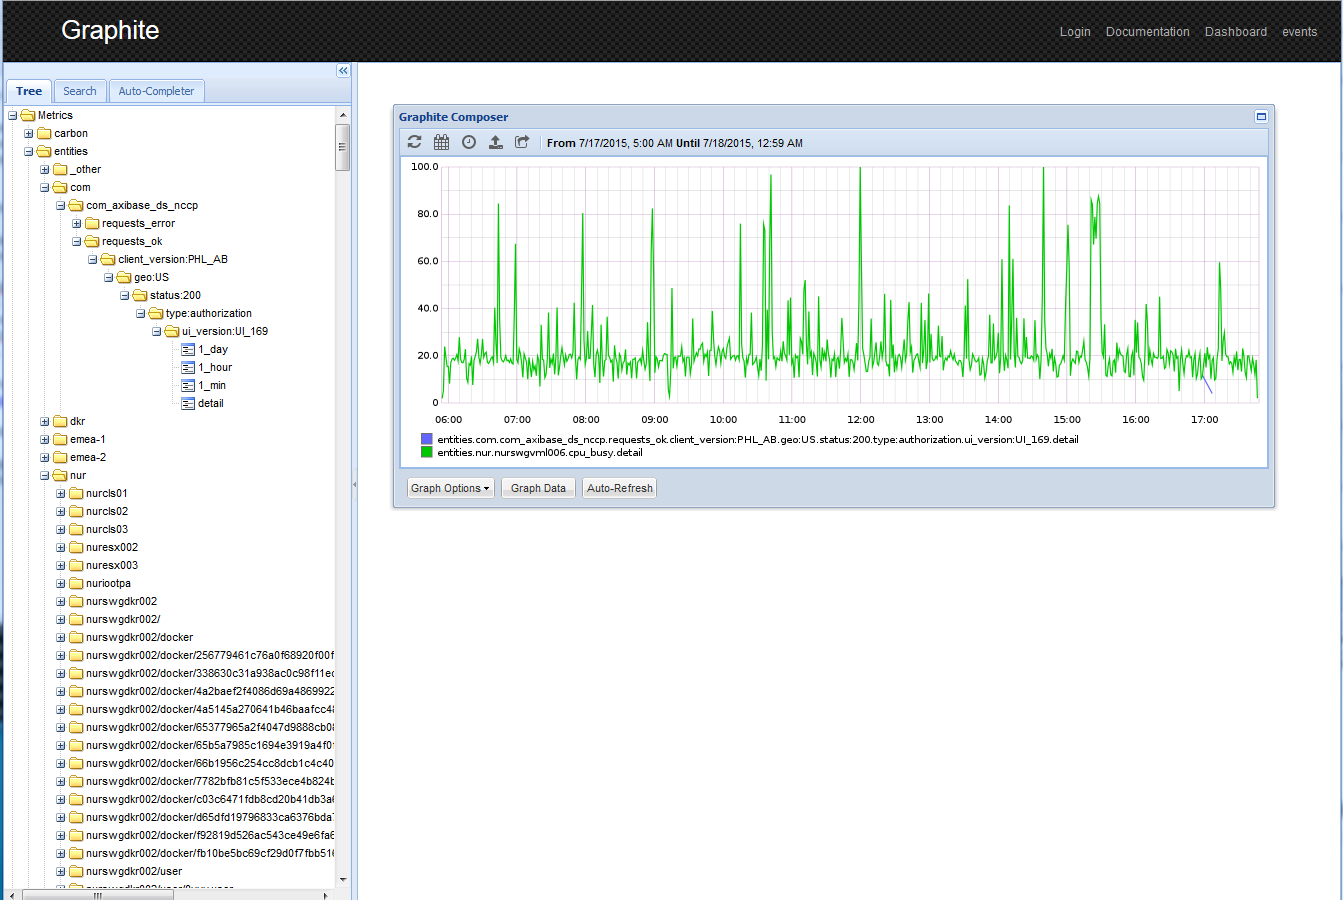
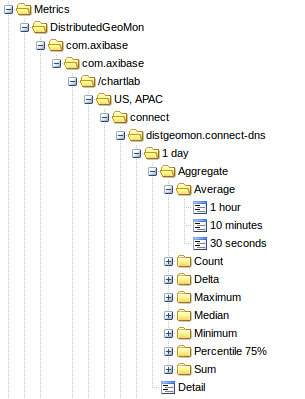
When the storage finder is enabled, metrics from ATSD become available for visualization in the Graphite-web application.
ATSD metrics displayed in Graphite-web application: