StatsD
StatsD is a Node.js network daemon that listens for metrics from applications running on the same server, aggregates metrics into statistics and transmits them to one or more pluggable back-end services.
Setup Backend
Review the backend configuration guide.
Format
The StatsD format is supported in ATSD.
Basic Format:
{metricname}:{value}|{type}
Extended Format:
metric.name:value|type|@sample_rate|#tag1:value,tag2
Installation
Download and install StatsD:
sudo apt-get install git nodejs devscripts debhelper
mkdir ~/build && cd ~/build
git clone https://github.com/etsy/statsd.git
cd statsd
dpkg-buildpackage
Install the resulting package:
cd ..
sudo dpkg -i statsd_0.6.0-1_all.deb
Stop and configure StatsD:
sudo service statsd stop
sudo nano /etc/statsd/localConfig.js
Edit the following fields: graphitePort is the ATSD port for network commands and graphiteHost is the hostname or ip address of ATSD:
{
  graphitePort: 8081
, graphiteHost: "atsd_hostname"
, port: 8125
, graphite: {
    legacyNamespace: false
  , globalPrefix: "customPrefix"
  , globalSuffix: "customSuffix"
  }
}
Start StatsD:
sudo service statsd start
Examples
WordPress Monitoring Example
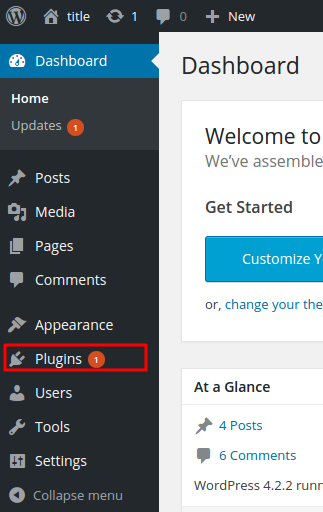
Open the Plugins menu on the WordPress administration page.
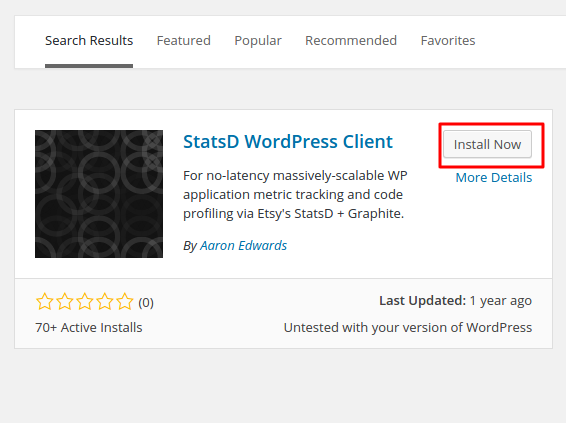
Click Add New. Install the StatsD WordPress Client plugin:
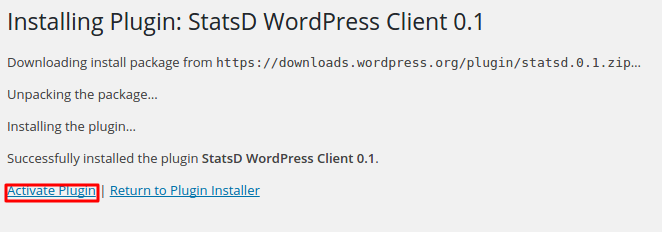
Activate the plugin:
If StatsD is not on the localhost or port, you have to define the local daemon IP in wp-config.php.
Usually wp-config.php is located in /var/www/html/wp-config.php:
define('STATSD_IP', 'x.x.x.x' );
If needed, you can override the default UDP port of 8125 in wp-config.php:
define('STATSD_PORT', xxxx);
Metrics collected by StatsD from WordPress:
Logins (success, fails, logout)
Password resets (attempts/successes)
User count (guage)
Users (registrations, spam, ham)
Posting (publish, trash, delete)
Commenting (received, approved, trashed, spam, unspam)
Attachments (Add, edit, delete)
XML-RPC (every command individually, you can rollup)
Multisite blog count (guage)
Multiiste blog actions (new, spam, ham, archive, unarchive, delete, undelete)
Page generation times
Query count (type + time when SAVEQUERIES defined)
Remote HTTP requests (count, time - by host)
WP Cron calls
WP Emails
etc: instant tracking of any application metric using API
Once collected, these metrics can be found in ATSD under the Entity and Metrics tabs.