Pentaho Data Integration
Overview
Pentaho Data Integration at https://community.hitachivantara.com/community/products-and-solutions/pentaho (PDI) provides a graphical design environment to create and edit ETL (Extract, Transform, Load) jobs and workflows. The following guide includes examples of loading time series data from ATSD, calculating derived time series in PDI and storing the results in ATSD.
Prerequisites
Install PDI
- Install Pentaho Data Integration 7.1
Install ATSD JDBC Driver
- Download ATSD JDBC driver with dependencies.
- Copy the driver
atsd-jdbc-*-DEPS.jarfile into thelibdirectory in the PDI installation directory. - Restart the PDI process
Load Sample Data
To complete this exercise, sample data must be available in your ATSD instance.
- Log into the ATSD web interface
- Open Metrics > Data Entry, open the Commands tab.
- Copy the
seriescommands into the form and click Submit.
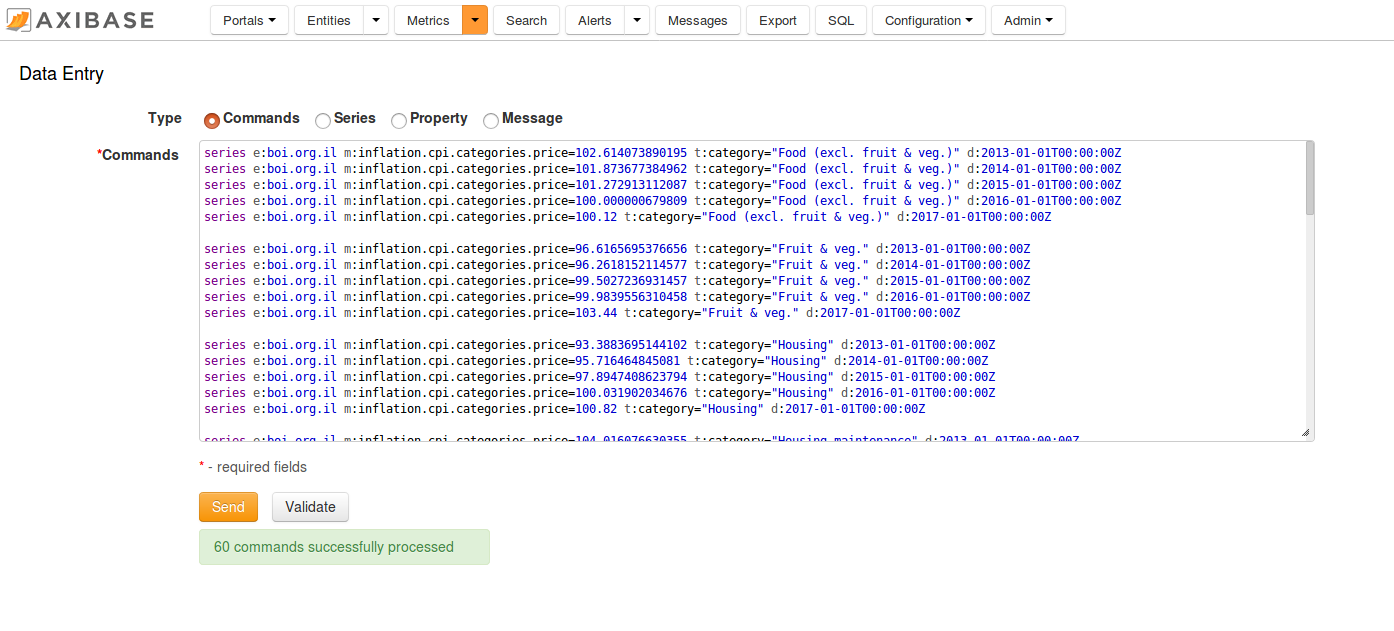
The commands contain the Consumer Price Index (CPI) for each category of items in a consumer basket as well as a weight for each category in the CPI basket. The weights are stored as fractions of 1000. The CPI is tracked from 2013 to 2017 and uses Year 2016 values as the baseline. Weight values are available only for 2017. The underlying data is available in the following Excel file.
To calculate a weighted inflation index we need to multiply the CPI of each category by its weight divided by 1000 and sum the products.
Configure Database Connection
- Create new Transformation by selecting File > New > Transformation
- Open the View pane.
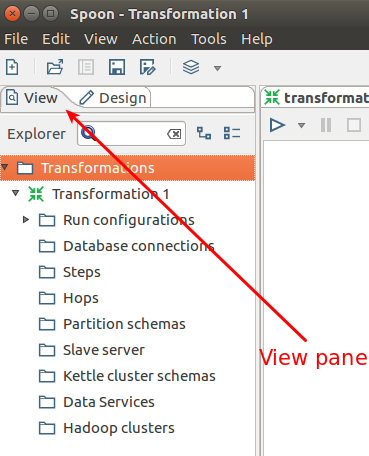
- Right-click Database connections > New.
- Select General in the left menu.
- Select Generic database as Connection Type.
- Select Native (JDBC) as Access.
Configure Connection Properties
Enter JDBC URL into the Custom Connection URL field where
atsd_hostnameis the hostname of the ATSD database instance:jdbc:atsd://atsd_hostname:8443;tables=inflation%
tablesis an optional metric name filter. Review ATSD JDBC URL parameters for additional details.
- Set Custom Driver Class Name field to
com.axibase.tsd.driver.jdbc.AtsdDriver. - Enter ATSD account credentials in the User Name and Password fields.
- Set Connection Name to
ATSD Connection.
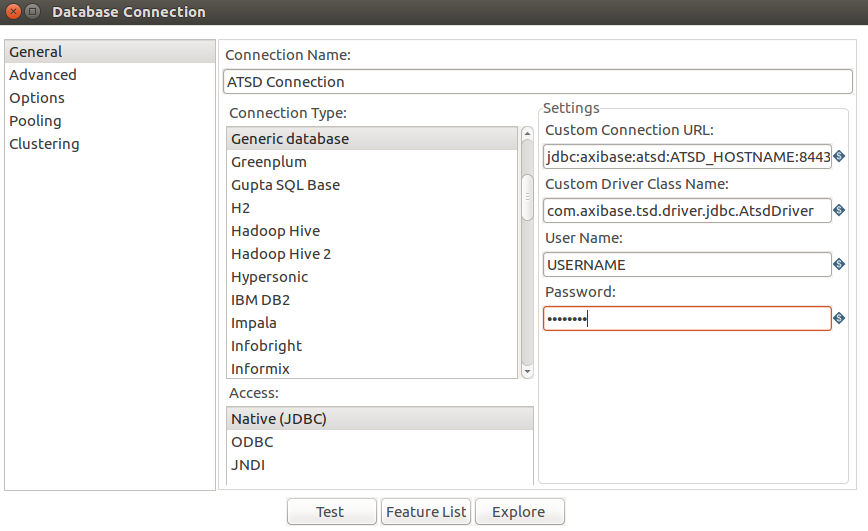
- Click Test to verify connection.
View Schema
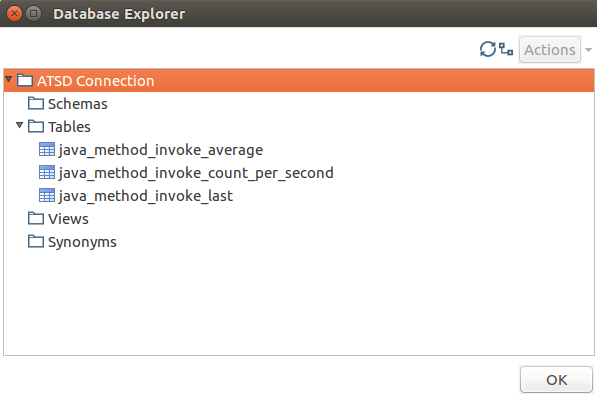
- Edit Custom Connection URL field in ATSD Connection properties.
- Modify the
tablesparameter in the Custom Connection URL field. The parameter is a list of comma-separated metrics or metric expressions to be displayed as tables in the Database Browser.
Filter examples:
%java%for metrics that containsjavakeywordcustom.metric%for metrics whose name starts withcustom.metric%2017for metrics whose name ends with2017
Click Explore to view the schema:
Load Data
- Drag and drop
ATSD Connectionfrom the View pane in the Database Connections folder. - Set Step name to a unique name for this transformation.
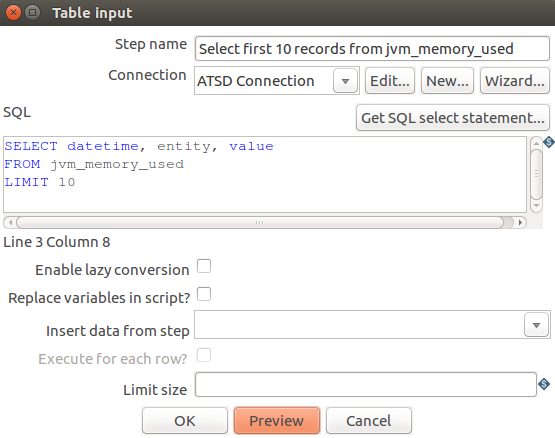
- Write an SQL query used as a Table input for this transformation.
- Click Preview to verify query results.
Calculate Derived Series
To calculate the category-weighted consumer price index (CPI) for each year, the CPI value for a given category must be multiplied by its weight and divided by 1000 since its weights are stored as units of 1000 (not 100). The resulting products are summed as the weighted CPI for the given year.
Load Data from ATSD
Create three Table input steps from ATSD:
Prices,DatetimesandWeights.Pricesare weighted prices for categories from 2013-2017 for 10 categories
SELECT value, tags.category, datetime
  FROM inflation.cpi.categories.price
ORDER BY datetime, tags.category
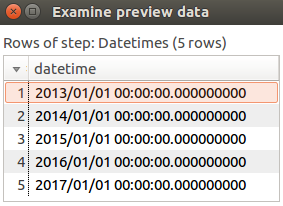
Datetimeshas timestamps for 2013-2017 years
SELECT datetime
  FROM inflation.cpi.categories.price
GROUP BY datetime
  ORDER BY datetime
Weightshas weights for 10 categories for 2017 year
SELECT tags.category, value
  FROM inflation.cpi.categories.weight
ORDER BY datetime, tags.category
Duplicate Weights
Since the Weights are available for only one year, assume that the category weights are constant through the timespan and therefore can be repeated for each year from 2013 to 2017.
- Open the Design pane.
- Locate Join Rows (cartesian product) in Joins category.
- Drag and drop it to the Transformation pane.
- Connect your Join Rows (cartesian product) with
Datetimesand Weights using Input Connection button. That button is displayed upon mouseover of Join Rows or any item inside the Transformation pane.

- Use
connect:
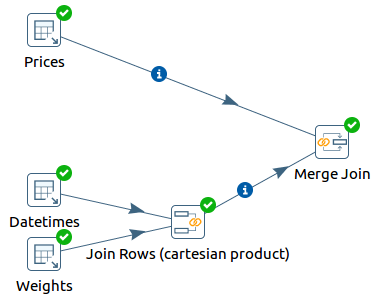
Diagram example:

Join Rows (cartesian product) preview:
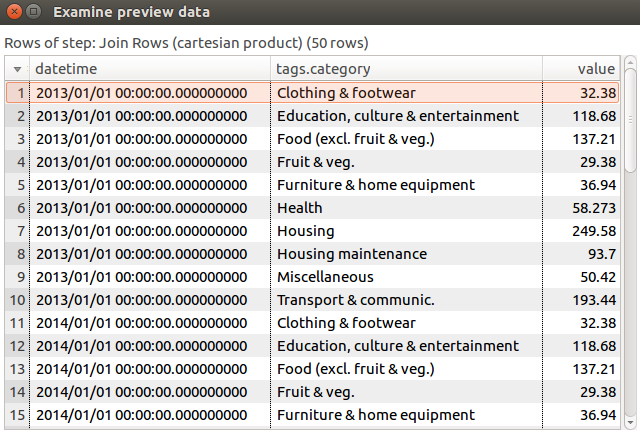
To preview data right-click step and open Preview > Quick Launch
Merge Tables
In this step you append two tables to perform calculations on one table. This table has a unique row identifier (pair datetime - tags.category) join them with the INNER JOIN operation.
- Open the Design pane and find Merge Join in the
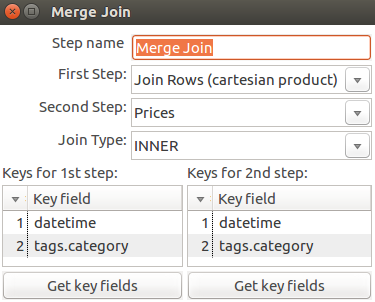
Joinscategory. Drag and drop it to the Transformation pane. - Connect Merge Join to Join Rows (cartesian product) and choose Right hand side stream of the join.
- Connect Merge Join to Prices and choose Left hand side stream of the join.
- Configure Merge Join as shown in the screenshot below:
Operation joins two tables into one table.
Preview of Merge Join:
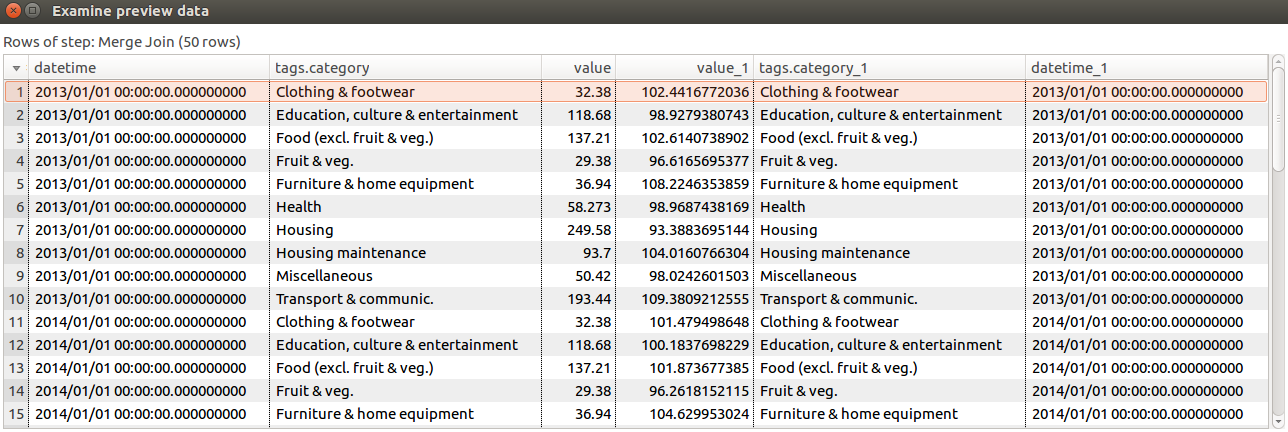
Diagram example:
Remove Redundant Columns
- Open the Design pane.
- Click Select values in the
Transformcategory. - Drag and drop it to Transformation pane.
- Connect Select values to Merge Join.
- Configure Select values as shown in the screenshot below:
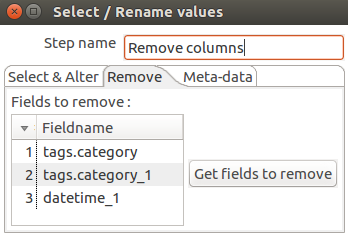
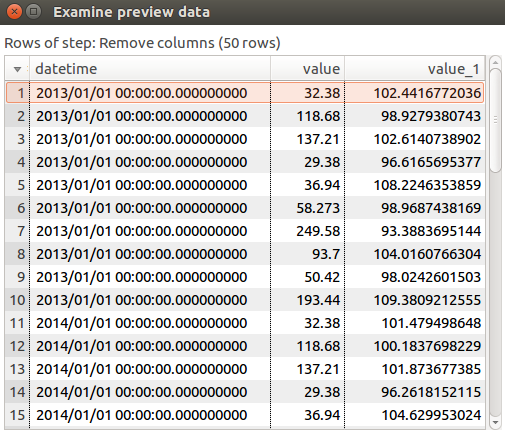
Preview of Remove columns:
Calculations
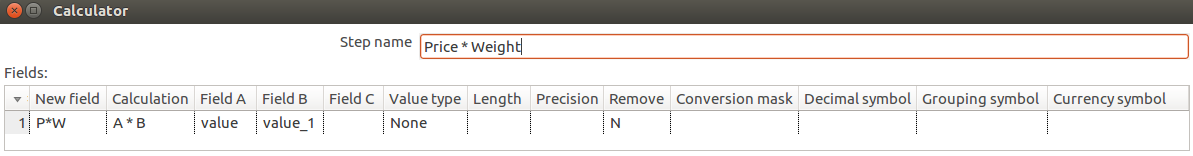
Price * Weight
Multiply two columns element-wise:
- Open the Design pane.
- Find Calculator in Transform category. Drag and drop it to the Transformation pane.
- Connect Calculator to Remove columns.
- Configure Calculator as shown in the screenshot below:
This operation calculates a new field
P*W(price multiplied by weight)
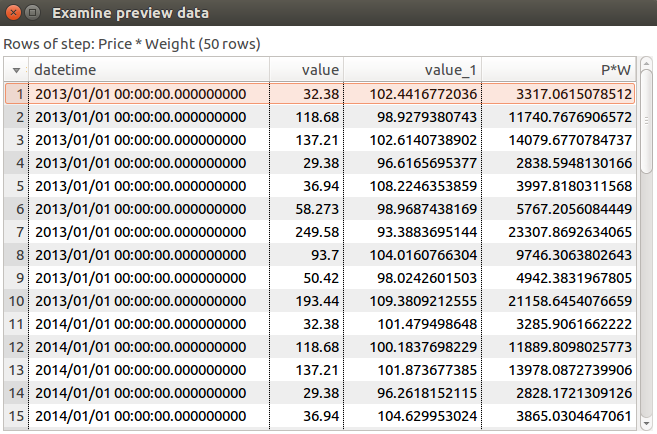
Price * Weight preview:
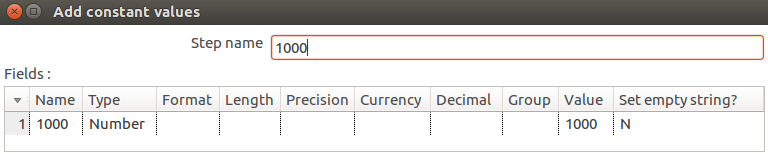
Add Column With a Constant
This column is required for element-by-element division.
- Open the Design pane.
- Locate Add constants in Transform category. Drag and drop it to the Transformation pane.
- Connect Add constants to
Price * Weight. - Configure Add constants as shown in the screenshot below:
This operation adds a new column
1000that has a value of1000in each row.
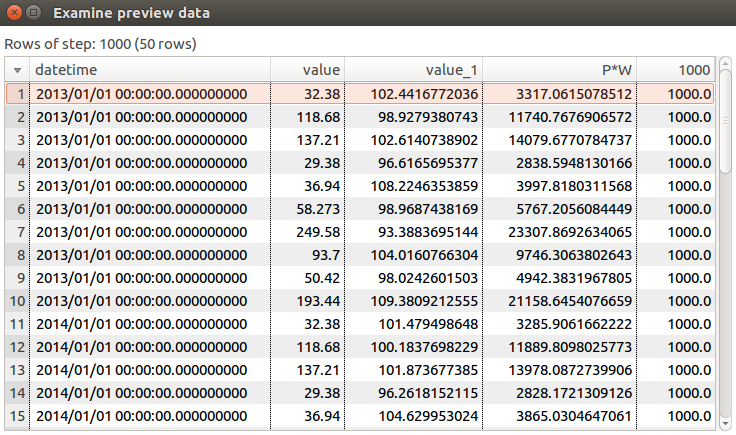
Constant Column Preview:
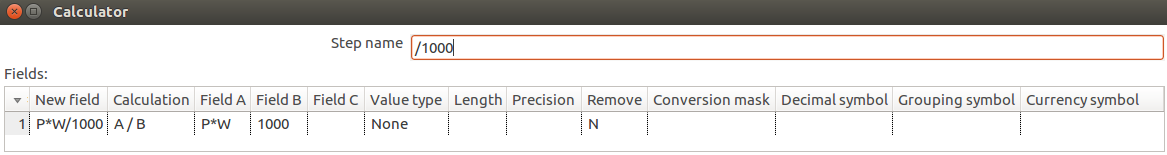
Divide by 1000
Add a new column that has Price * Weight divided by 1000 due to the fact that weights are stored proportional to 1000.
- Open the Design pane.
- Find
Calculatorin theTransformcategory. Drag and drop it to the Transformation pane. - Connect the
Calculatorstep to1000step. - Configure the
Calculatoras shown in the screenshot below:
This operation calculates a new field
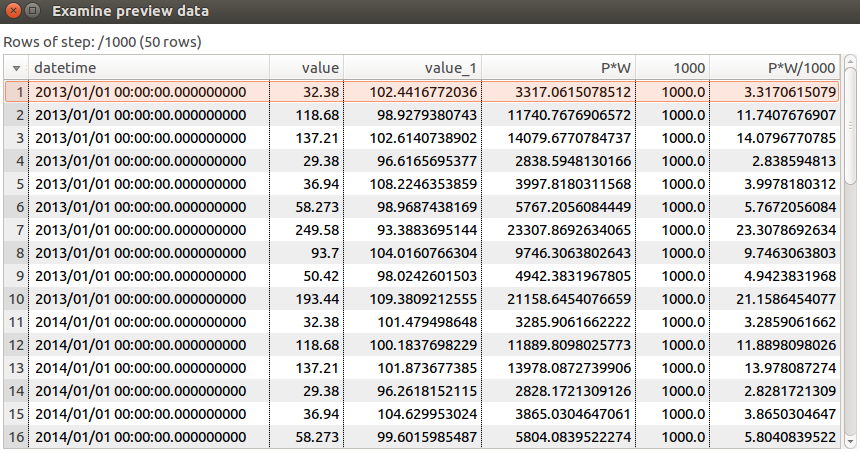
P*W/1000as price multiplied by weight and divided by 1000.
Division preview:
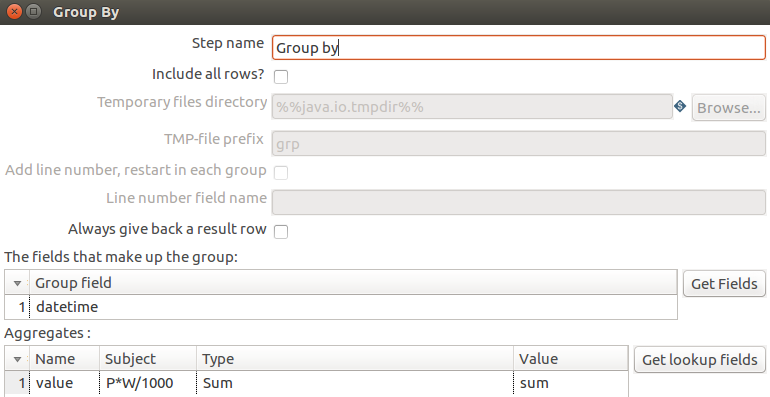
Group By
Group rows by datetime and sum weighted price values for each year.
- Open the Design pane.
- Locate Group by in the Statistics category. Drag and drop it to Transformation pane.
- Connect Group by step to
/1000step. - Configure Group by as shown in the screenshot below:
The operation groups records by
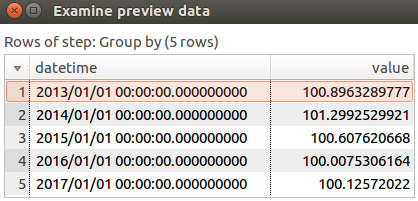
datetimeand calculates the sum ofP*W/1000values for each group.
Group By preview:
Add Entity Column
The entity column is required to store computed metrics back in ATSD.
- Open the Design pane.
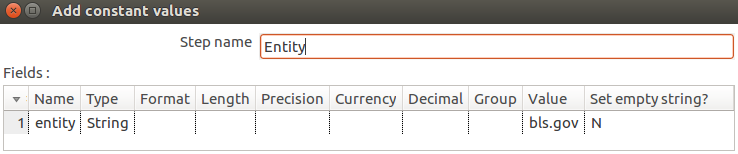
- Locate Add constants in the Transform category. Drag and drop it to the Transformation pane.
- Connect Add constants step to Group by step.
- Configure Add constants as shown in the screenshot below:
This operation adds a new column
entitythat has the valuebls.govin each row.
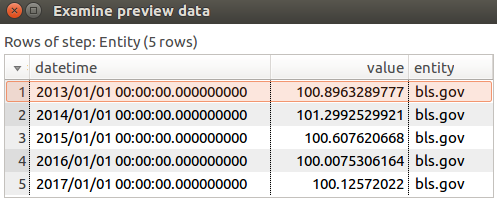
Entity preview:
Store Derived Series in ATSD
- Open the Design pane.
- Locate Table output in the Output category. Drag and drop it to Transformation pane.
- Connect Table output to Entity.
- Configure Table output as shown in the screenshot below.
This operation inserts calculated data into ATSD.
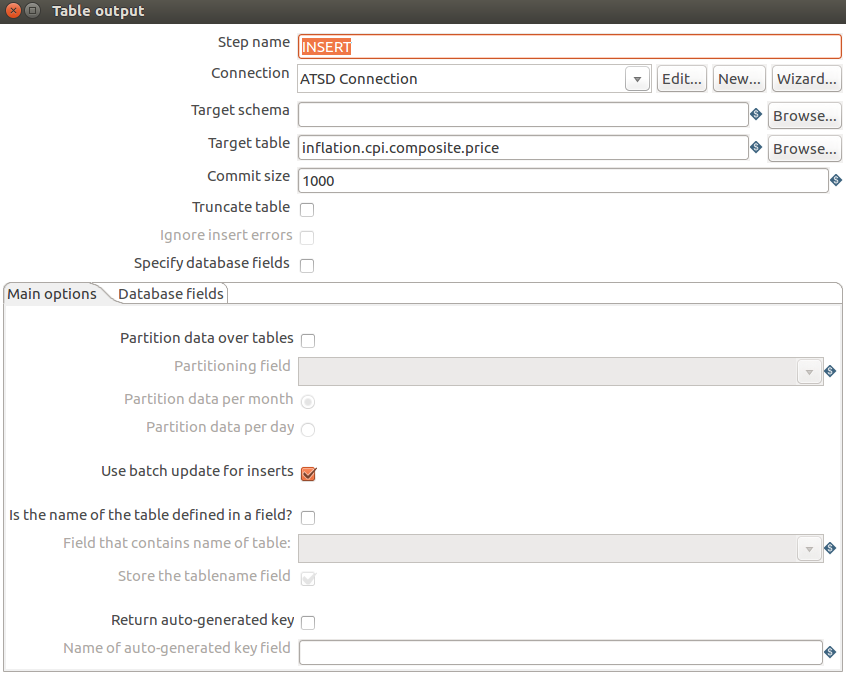
Target tableis the name of the metric which contains the calculated series.- The metric does not have to be visible in the Schema.
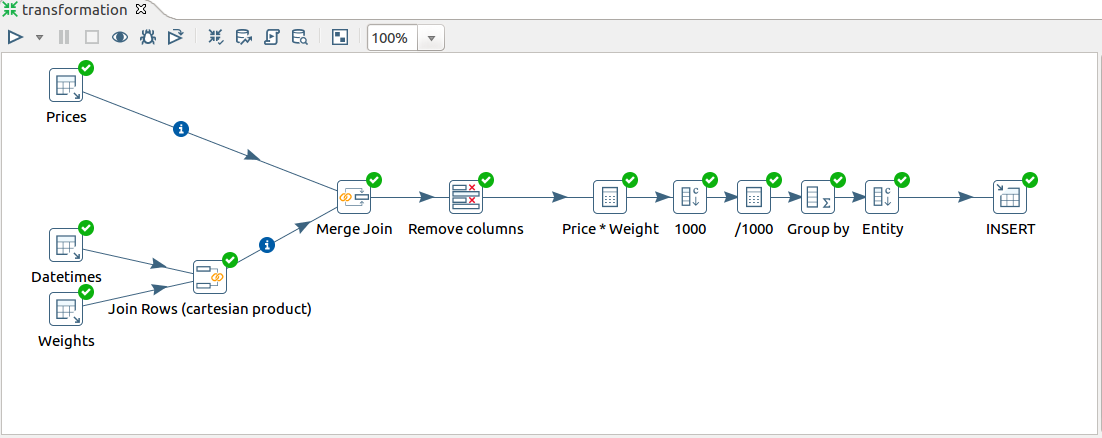
Complete diagram:
Check Results
Log in to ATSD and validate results on SQL Console.
SELECT entity, datetime, value FROM inflation.cpi.composite.price
| entity  | datetime                 | value              |
|---------|--------------------------|--------------------|
| bls.gov | 2013-01-01T00:00:00.000Z | 100.89632897771745 |
| bls.gov | 2014-01-01T00:00:00.000Z | 101.29925299205442 |
| bls.gov | 2015-01-01T00:00:00.000Z | 100.60762066801131 |
| bls.gov | 2016-01-01T00:00:00.000Z | 100.00753061641115 |
| bls.gov | 2017-01-01T00:00:00.000Z | 100.12572021999999 |
Transformation File
- Link to the
ktrfile containing this transformation.