Pentaho Report Designer
Prerequisites
Install PRD
- Install Pentaho Report Designer 7.1
Install ATSD Driver
- Download ATSD JDBC driver with dependencies
- Copy the driver JAR file into the
lib/jdbcdirectory in the Report Designer installation directory - Restart the Report Designer
Load Sample Data
To complete this exercise, load sample data into your ATSD instance.
- Log into the ATSD web interface
- Open Metrics > Data Entry, open the Commands tab.
- Copy the
seriescommands into the form and click Submit.
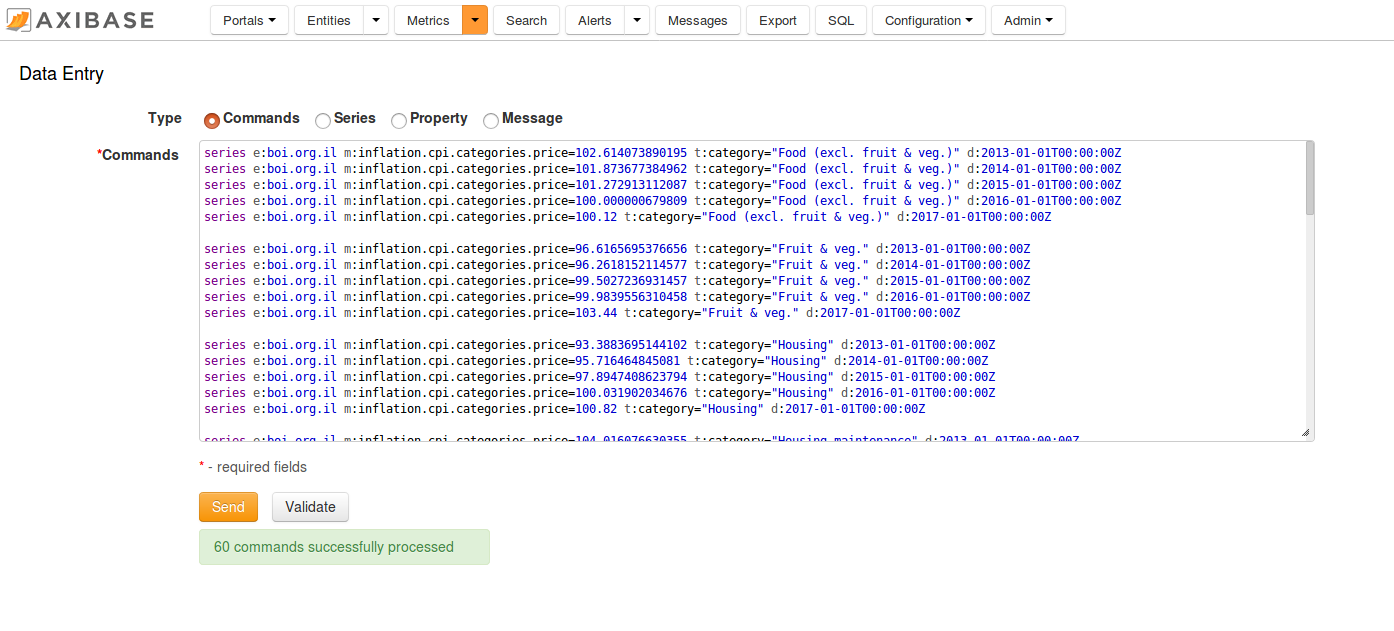
The commands contain the Consumer Price Index (CPI) for each category of items in a consumer basket as well as a weight for each category in the CPI basket. The weights are stored as fractions of 1000. The CPI is tracked from 2013 to 2017 and uses Year 2016 values as the baseline. Weight values are available only for 2017. The underlying data is available in the following Excel file.
To calculate a weighted inflation index we need to multiply the CPI of each category by its weight divided by 1000 and sum the products.
Configure Database Connection
- Open the Data tab in the properties pane on the right.
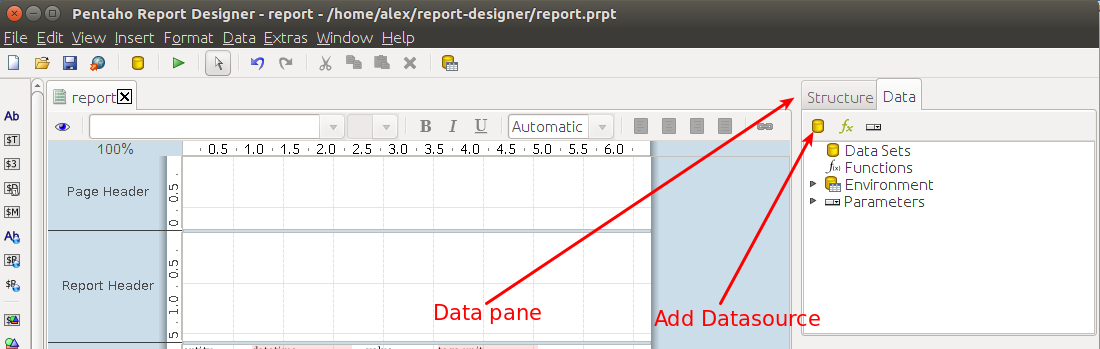
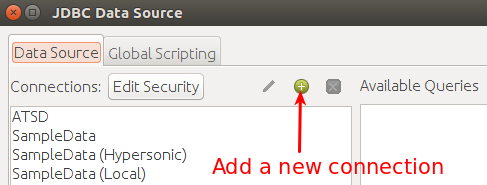
- Select Add Data Sources in the toolbar, click JDBC.
- Select Add a new connection (green plus icon).
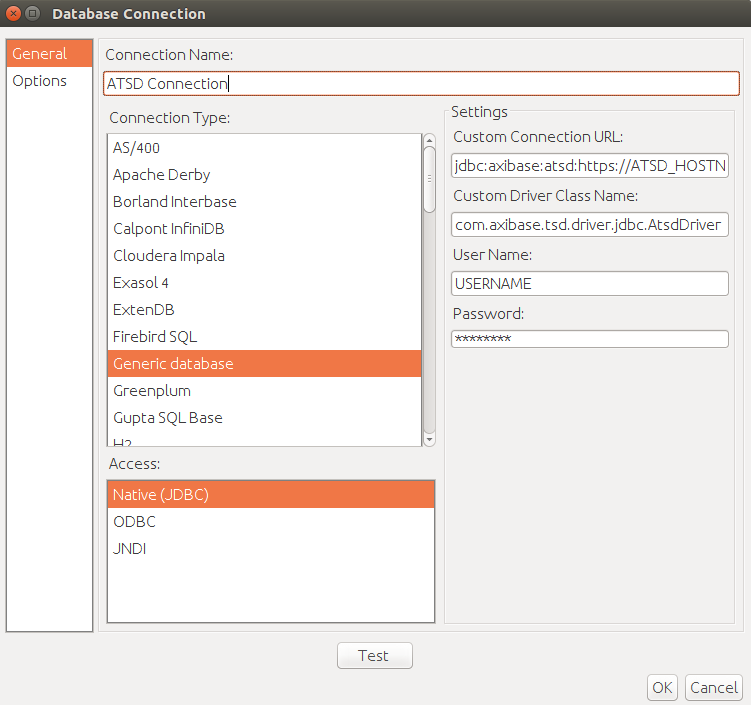
- Click General in the left menu
- Select Generic database in Connection Type
- Select Native (JDBC) in Access
Configure ATSD connection properties
Enter JDBC URL into the Custom Connection URL field, for example:
jdbc:atsd://atsd_hostname:8443;tables=inflation%;expandTags=true
atsd_hostnameis the hostname of the target ATSD instance Review ATSD JDBC URL parameters for additional details.
- Set Custom Driver Class Name field to
com.axibase.tsd.driver.jdbc.AtsdDriver - Set User Name and Password fields to your ATSD Username and Password
- Set Connection Name to ATSD Connection
Verify Connection
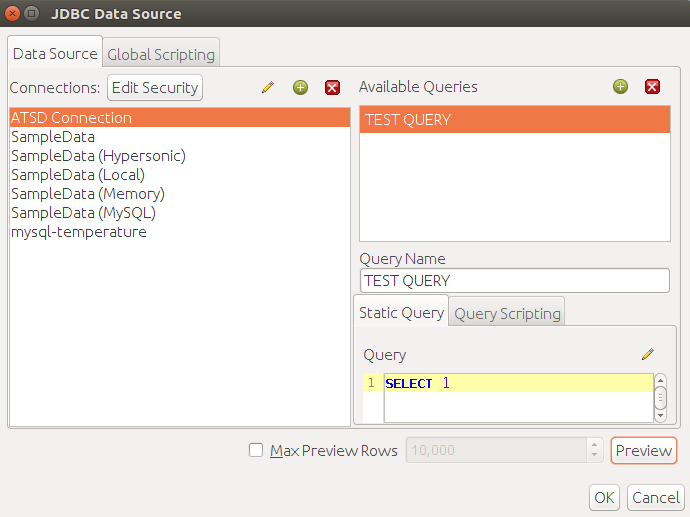
ATSD connection can be verified using the SELECT 1 query.
Example of SELECT 1 test query:
- Select Add a new connection (green plus icon).
- Input query row
SELECT 1to the SQL Query Designer. - Click Preview.
Result of SELECT 1 test query:

View Schema
- Edit Custom Connection URL field in ATSD Connection properties
- Edit
tables=TABLE_NAME_FILTERin Custom Connection URL field - SET
TABLE_NAME_FILTERto your table name filter
TABLE_NAME_FILTER is a list of comma-separated metrics or metric expressions to be displayed as tables in the Pentaho Report Designer.
TABLE_NAME_FILTER examples:
%java%for metrics that contains wordjavacustom.metric%for metrics whose name starts withcustom.metric%2017for metrics whose name ends with2017
ATSD Schema can be viewed in SQL Query Designer tool:
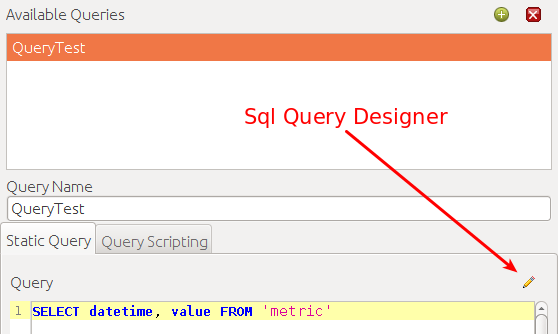
SQL Query Designer tool interface:
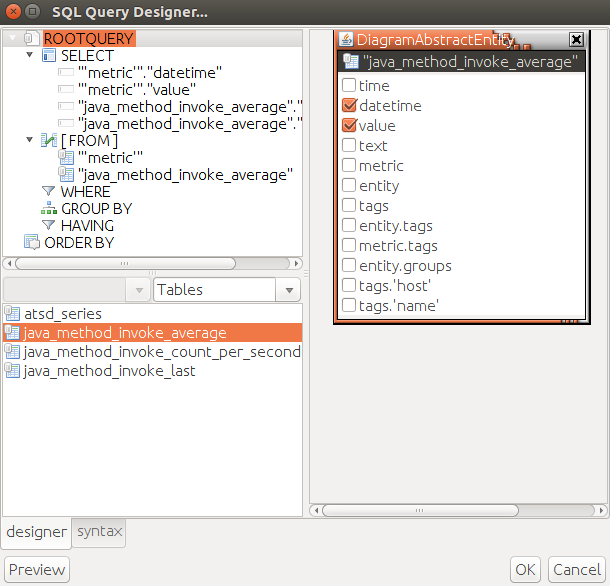
Design a query visually with SQL Query Designer:
- Double-click the table that you want to include to Query. The table is shown in right pane of SQL Query Designer.
- Select fields inside the table (these fields are included in
SELECTclause of a Query) - Optionally add
WHERE,GROUP BYandHAVINGorORDER BY - Click OK to build the query and display the query in the text field
Remove new line symbol after
SELECTkeyword Remove quotes around column names
Import Data
- Open the Data tab in the properties pane on the right
- Click Add Data Sources in the toolbar and choose
JDBC - Click ATSD Connection
- Click Add Query in the Available Queries list

- Enter an SQL query in the Query editor, for example
SELECT datetime, entity, value FROM jvm_memory_used LIMIT 10 - Click Preview to review the result set.
Build a query using the SQL Query Designer
Click OK. The list of queries is added to the Data pane.
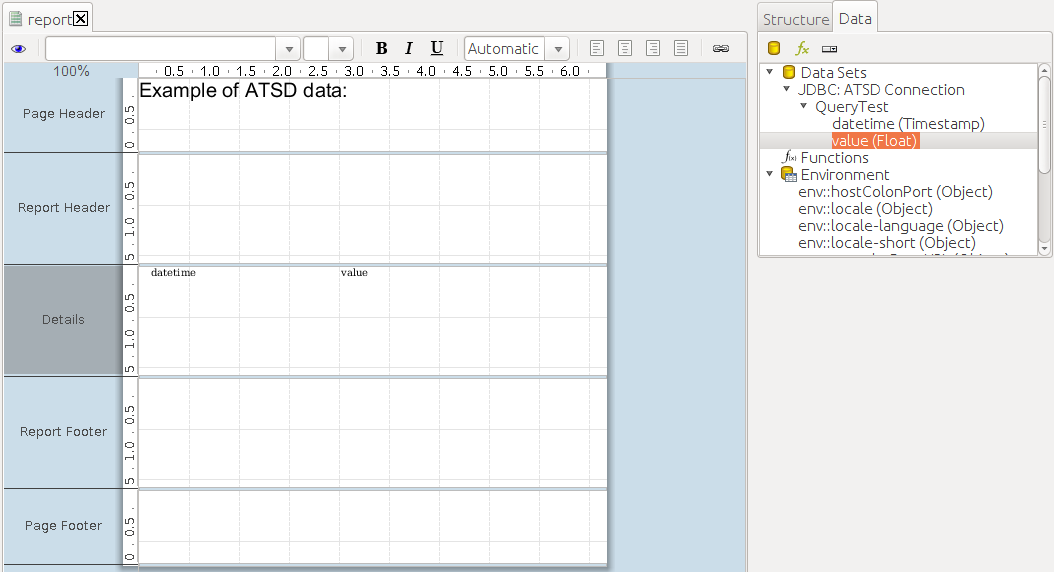
Right-click the query and choose Select Query. The tree view displays query results and fields.

- Drag and drop these field into the report canvas.
- Click Preview in the top left corner (the eye icon) to view query results.
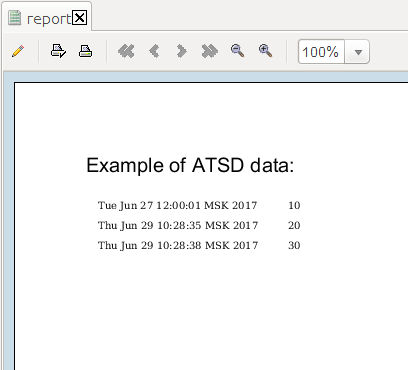
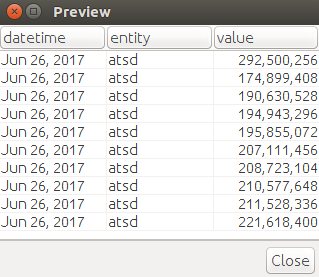
Example of report preview: