Comparison of Two Metrics in One Bar Graph
Overview
Build a report displaying monthly exports and imports.
Data Source
- Tables:
bi.ex_net1.mandbi.im_net1.m
Steps
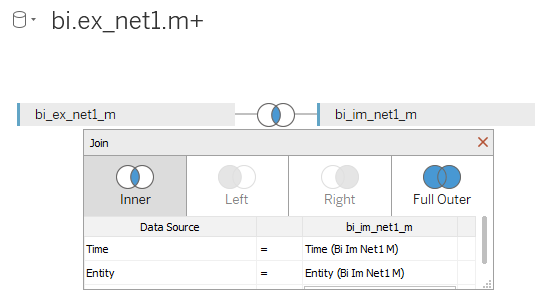
- Drag-and-drop both tables to Canvas area
- Select
Inner Join, specifyTimeandEntityas equal fields:
- Click Sheet 1
- Click OK to acknowledge the warning about limitations
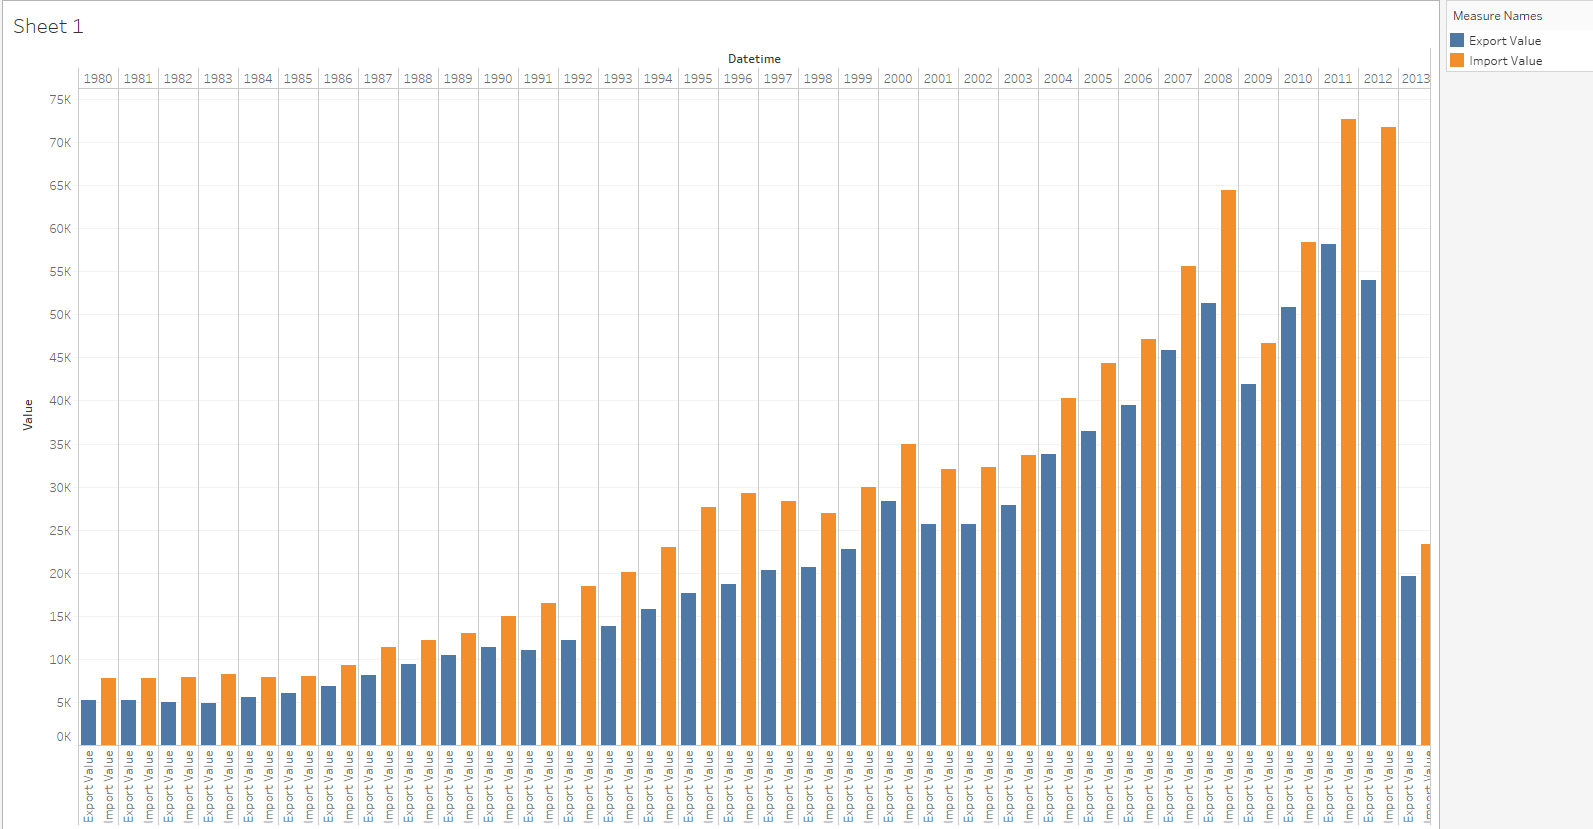
- Drag-and-drop
Datetimeonto the column field - Drag-and-drop both
Valueonto the rows field - Optionally rename values: right-click Value and choose Rename
- Show Me Card > side-by-side bars
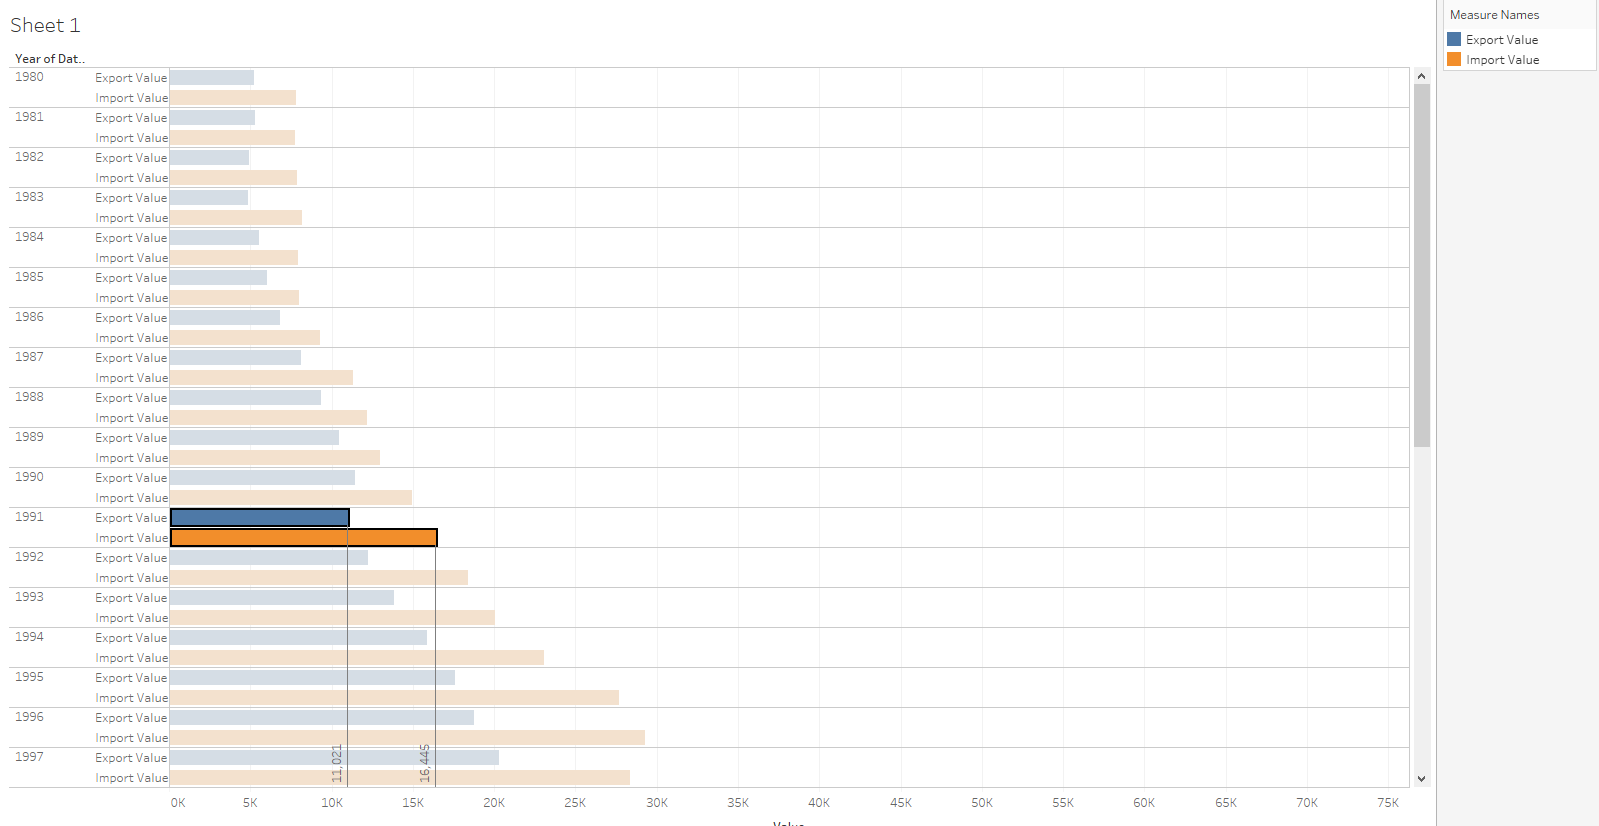
Enter Ctrl+W and swap columns and rows.
Drop Lines
Add Drop Lines and Labels:
- Select a column
- Right-click and choose Drop Lines > Show Drop Lines
- Right-click and choose Drop Lines > Edit Drop Lines > Labels > Automatic
Results