Value Aggregation
Overview
Display the minimum exports each year.
Data Source
- Table:
bi.ex_net1.m
Steps
- Drag and drop the table to Canvas area
- Click Sheet 1
- Click OK to acknowledge the warning about limitations
- Drag-and-drop
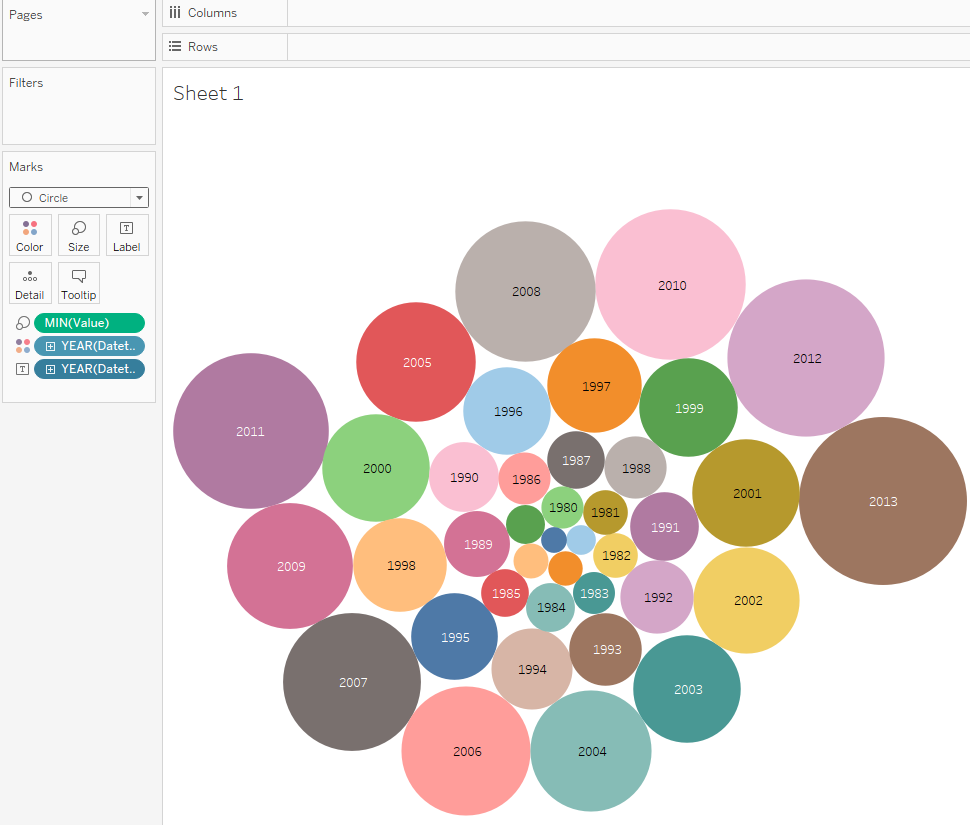
Valueto the Marks Card, right-click Measure > Minimum, replaceDetailwithSize - Drag and drop
Datetimeto the Marks Card, replaceDetailwithColor - Drag-and-drop
Datetimeto the Marks Card, right-click QUARTER > YEAR, replaceDetailwithLabel - Change
AutomatictoCirclein the drop-down list on the Marks Card tab.
Results
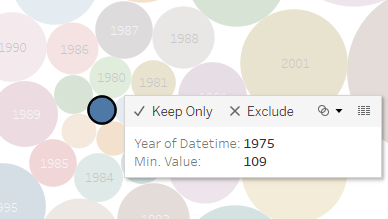
In year 1975 the value is equal to 109 which is the minimum of all values for the bi.ex_net1.m metric: