Wrangling Federal Reserve Economic Data with SQL and Declarative Graphics
Introduction
The Federal Reserve Economic Research Division(FRED) of the St. Louis Federal Reserve publishes publicly available data on a range of topics related to macroeconomic trends such as GDP, employment and other national statistics.
This article focuses on the AD01RC1Q027SBEA series which tracks net lending and borrowing of the United States Government.
Handling Special Items
The AD01RC1Q027SBEA series is annualized and each quarterly value is therefore multiplied by 4 to arrive at an annual estimate. This calculation is used to show the annual total if the trends of a specific quarter are replicated over the course of the year. During the final quarter of 2017, a potential $250 billion windfall from one-time corporate repatriation taxes is added to the total by virtue of annualized calculation. As a result, the $250 billion extra quarterly income is translated into $1 trillion after transformation. The original FRED blog post discussing this data includes a visualization which considers this annualized value:
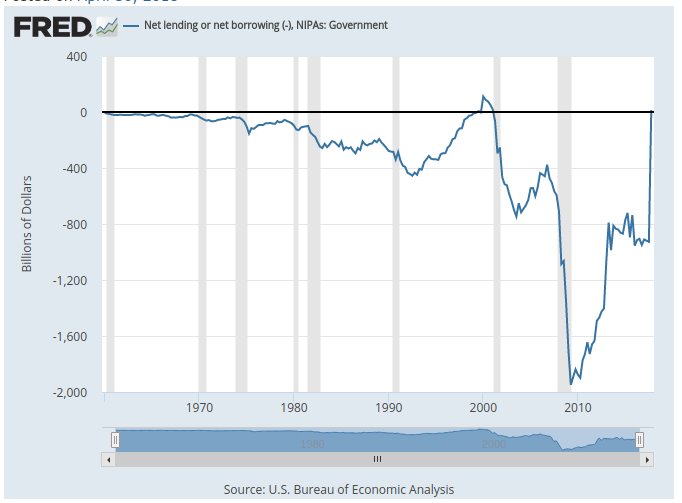
As a result of this transformation, the annual budget of the U.S. government is estimated to be a positive $14.68 million, an accomplishment last reported in 2001.
This article illustrates how SQL and the declarative graphics library in ATSD can be utilized to perform ad-hoc data transformations such as the removal of special items.
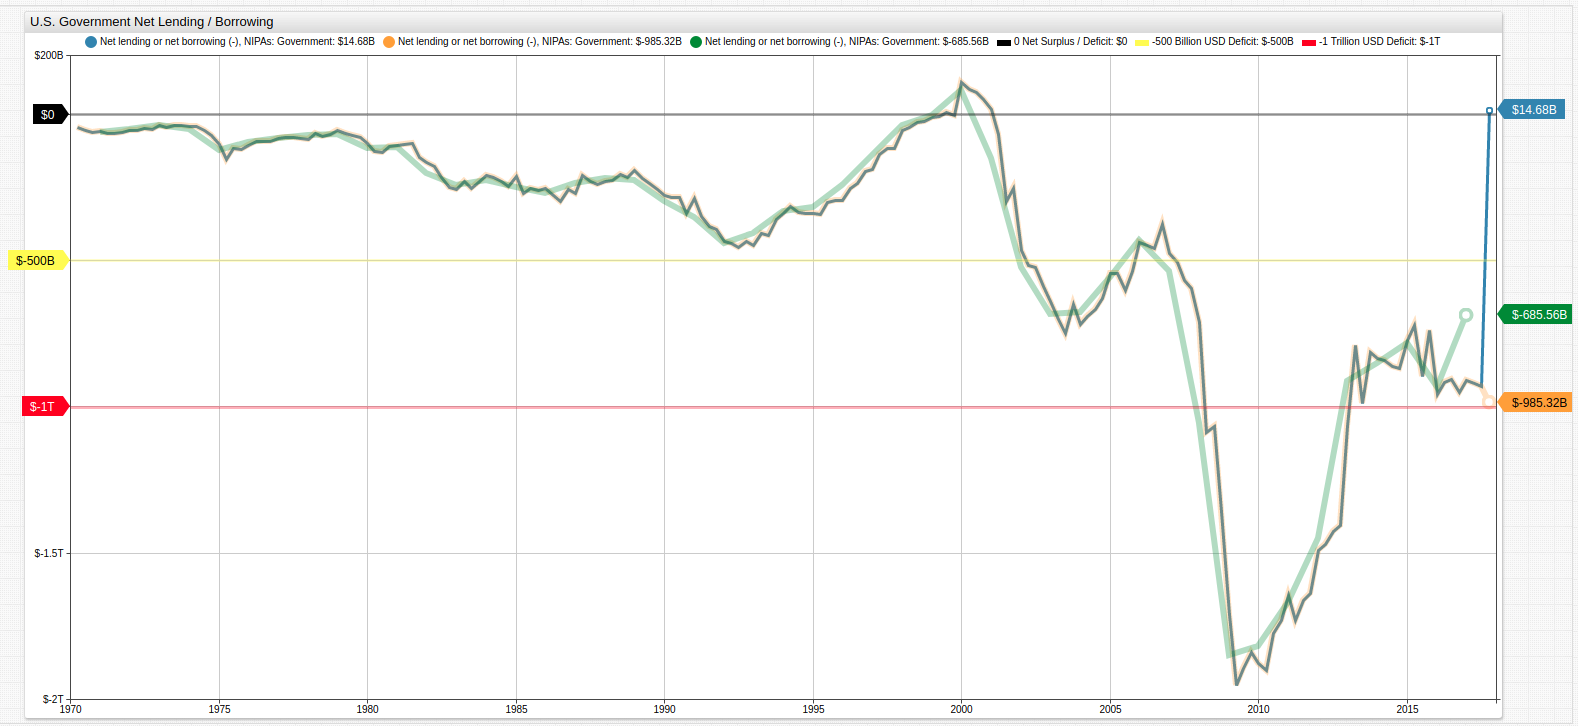
The original data and new data are shown together. The range of conclusions one can draw from these three series are vastly different.

The special item is removed using the replace-value setting:
# remove extraordinary item completely.
replace-value = time == new Date('2017-10-01T00:00:00Z').getTime() ? value-1000 : value
This setting targets a specific date, and evaluates an if-else expression which subtracts $1 trillion or $750 billion from the value of the defined date.
The group-period and group-statistic settings are used to return non-annualized data, which still includes the $250 billion extraordinary item, but does not include the additional $750 billion from annualization.
# remove annualization factor from raw data, group by annual period, sum samples for actual results.
replace-value = value/4
group-period = 1 year
group-statistic = sum
The data is presented via the Trends service.
Querying FRED Data with SQL
Similar to the above visualizations, data cleanup may be performed with SQL.
By de-annualizing quarterly values and aggregating them back into annual totals using date aggregation in ATSD SQL, the effect of the phantom $750B is removed from the annual series.
SELECT date_format(time, 'yyyy') "Year", SUM(value/4) "Net Lending/Borrowing"
  FROM "ad01rc1q027sbea"
GROUP BY period(1 year)
  ORDER BY datetime DESC
The ten most recent years of federal government lending / borrowing:
| Year | Net Lending/Borrowing |
|---|---|
| 2017 | -685.56 |
| 2016 | -931.36 |
| 2015 | -781.12 |
| 2014 | -851.12 |
| 2013 | -913.30 |
| 2012 | -1447.01 |
| 2011 | -1666.73 |
| 2010 | -1818.96 |
| 2009 | -1847.06 |
| 2008 | -1054.96 |
| 2007 | -535.13 |
As a result, the estimated annual budget balance is now a deficit of $685 billion, a number that is materially different from the estimated surplus of $15 billion.
The above query may be executed in the ATSD web console or using the ATSD API Client for Python, where the data may be queried using SQL and converted to pandas data frames for further analysis.
>>> q = """
... SELECT date_format(time, 'yyyy') "Year", SUM(value/4) "Net Lending/Borrowing"
... FROM "ad01rc1q027sbea"
... GROUP BY period(1 year)
... ORDER BY datetime DESC
... """
View the complete result set here:
| Year | Net Lending/Borrowing |
|---|---|
| 2017 | -685.56 |
| 2016 | -931.36 |
| 2015 | -781.12 |
| 2014 | -851.12 |
| 2013 | -913.30 |
| 2012 | -1447.01 |
| 2011 | -1666.73 |
| 2010 | -1818.96 |
| 2009 | -1847.06 |
| 2008 | -1054.96 |
| 2007 | -535.13 |
| 2006 | -429.80 |
| 2005 | -556.31 |
| 2004 | -675.52 |
| 2003 | -684.35 |
| 2002 | -523.37 |
| 2001 | -149.72 |
| 2000 | 81.14 |
| 1999 | -2.84 |
| 1998 | -37.36 |
| 1997 | -139.61 |
| 1996 | -244.25 |
| 1995 | -319.11 |
| 1994 | -330.87 |
| 1993 | -406.51 |
| 1992 | -441.19 |
| 1991 | -352.32 |
| 1990 | -296.46 |
| 1989 | -225.68 |
| 1988 | -217.87 |
| 1987 | -237.38 |
| 1986 | -270.47 |
| 1985 | -248.06 |
| 1984 | -224.12 |
| 1983 | -242.26 |
| 1982 | -201.48 |
| 1981 | -113.69 |
| 1980 | -115.53 |
| 1979 | -67.98 |
| 1978 | -73.20 |
| 1977 | -80.50 |
| 1976 | -96.37 |
| 1975 | -123.55 |
| 1974 | -51.64 |
| 1973 | -39.21 |
| 1972 | -52.12 |
| 1971 | -63.07 |
| 1970 | -49.26 |
To show only years where the United States had an annual lending surplus, execute this query with the HAVING condition:
SELECT date_format(time, 'yyyy') "year", SUM(value)/4 "surplus"
  FROM "ad01rc1q027sbea"
  WHERE datetime >= '1970'
  GROUP BY period(1 year)
HAVING SUM(value) > 0
The result set shows only one year since 1970 when the United States achieved a net lending surplus:
| year | surplus |
|---|---|
| 2000 | 81.14 |
Although in the FRED visualization it appeared that the United States government has finally achieved a budget surplus, in fact the nature of the data is such that it only seems that way. The dataset here is annualized, meaning that quarterly data is plotted as if the trend remains constant for the entire year. Thus, the $250 billion tax relief created by the current administration is considered as $1 trillion due to annualization calculations.
The special item can be completely removed from the series using the CASE expression:
SELECT date_format(time, 'yyyy') "Year",
  CASE
  WHEN datetime = '2017-01-01' THEN SUM(value/4) - 250
  -- alternatively THEN (SUM(value)-1000)/4
  ELSE SUM(value/4)
  END AS "Annual Lending / Borrowing"
FROM "ad01rc1q027sbea"
  GROUP BY period(1 year)
ORDER BY datetime DESC
The result set from 2007 onward:
| Year | Annual Lending / Borrowing |
|---|---|
| 2017 | -935.56 |
| 2016 | -931.36 |
| 2015 | -781.12 |
| 2014 | -851.12 |
| 2013 | -913.30 |
| 2012 | -1447.01 |
| 2011 | -1666.73 |
| 2010 | -1818.96 |
| 2009 | -1847.06 |
| 2008 | -1054.96 |
| 2007 | -535.13 |
Accessing Data
The dataset used for this article is stored in the Trends instance of ATSD.
If you installed your own ATSD instance, upload the FRED data crawler. The data crawler can upload the needed dataset along with all metadata information.
If you would like read-only credentials to the database to recreate the queries shown here, test drive the ATSD API Client for Python, or query any of the other datasets stored there, reach out to us, we're happy to provide them.