Using Trends
Overview
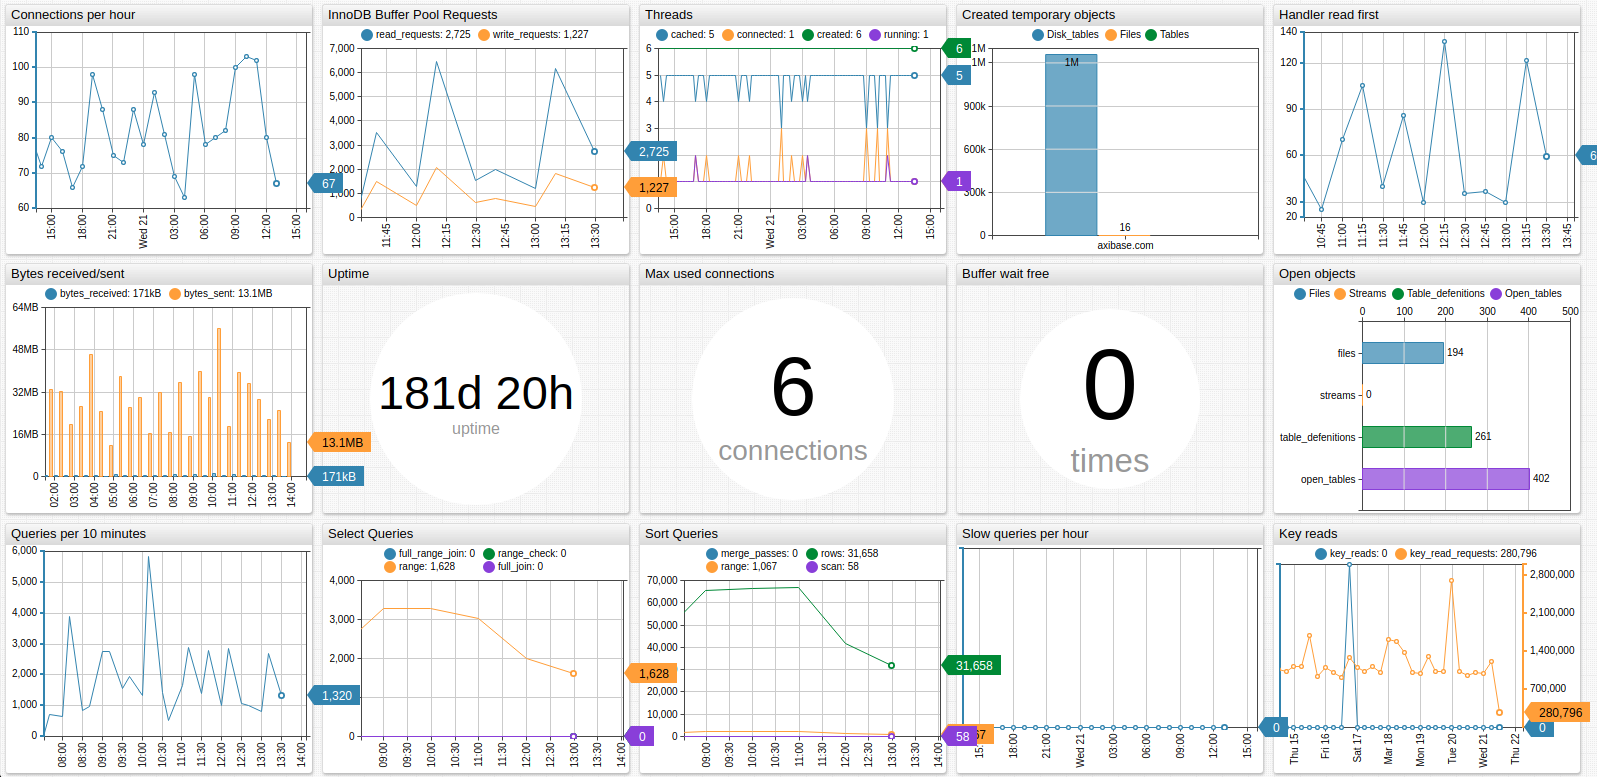
Trends is a data visualization sandbox based on the Axibase Charts library which uses ATSD to provide essential data storage and processing tasks. Trends contains data from the Federal Reserve database FRED.
The Trends service enables users to interact with data by creating custom visualizations as well as modifying examples shared by other users.
Trends does not require readers to be proficient in any programming language however a certain familiarity with key concepts and general schema is helpful.
Syntax
Trends uses a convenient syntax to create graphs, briefly described by this guide. Feel free to ask questions or suggest datasets or topics by raising an issues on the Axibase GitHub page.
In the Editor window you see the configuration for the current portal. All portals have several levels of settings:
[configuration]: Overall settings for the entire portal. Even the most complex visualizations have one set of[configuration]settings. Define base parameters for the portal such as layout, offset, formatting, as well as the default parameters that are inherited by all widgets in the portal.[group]: Trends defines each row of widgets as a group.[group]level settings are applied to an entire row by the service.[widget]: Widget represents a chart. Definetypeof chart and other parameters such as title, timespan, formatting.
For detailed information about [widget] level settings, see additional Charts Documentation.
[series]: Each widget must have at least one series. A series is an ordered and timestamped array of samples loaded from the database and visualized by the widget.[series]settings include the metric name, entity name, optional tags, as well as any series-specific transformations.
Read more about selecting series in Charts Documentation.
Configure some settings at multiple levels. Settings defined at the
[configuration]level are inherited by nested levels:[group]>[widget]>[series]. Settings defined at the lower level override those set at the upper level. For example, if you define an entityxat the[configuration]level for several widgets, and at the[series]level for one chart you define a different entityy, the service uses entityxfor all widgets EXCEPT the one where you definedentity = y. This is a useful setting when including an additional set of data from a unique entity.
Metrics Reference Page
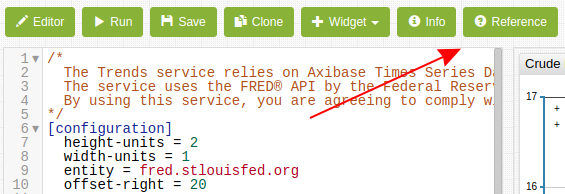
For a listing of available metrics stored in ATSD and accessible to Trends users, click the Reference button in the top toolbar.
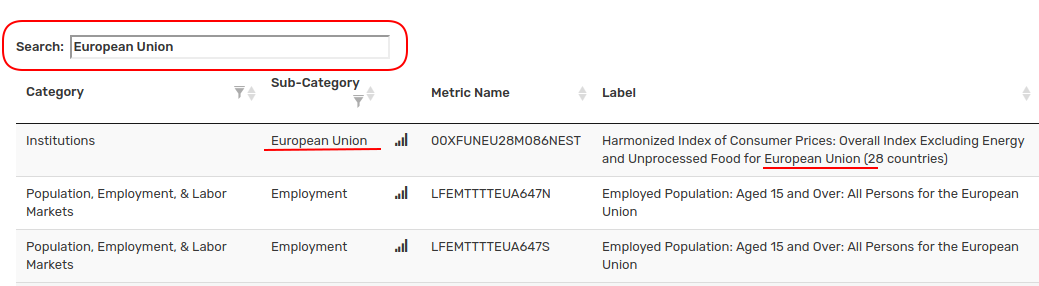
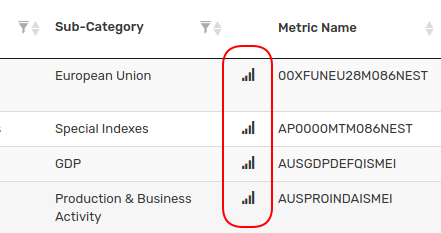
On the Reference page, you see a list of all metrics stored by Trends.
Search available metrics in the Search Bar.
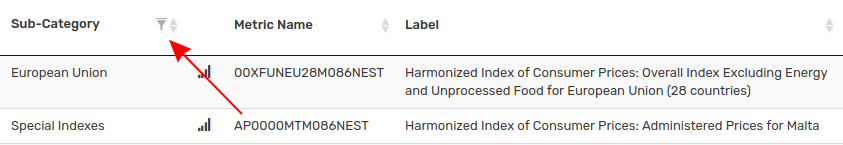
Filter dictionary columns by value. Click the Filter icon to open the menu of available values.
Preview metrics with the Portal icon. Click the icon to open a preview of the data associated with the particular metric.
Modifying Portals
Open the Editor window in the Trends interface by clicking the button in the top menu.
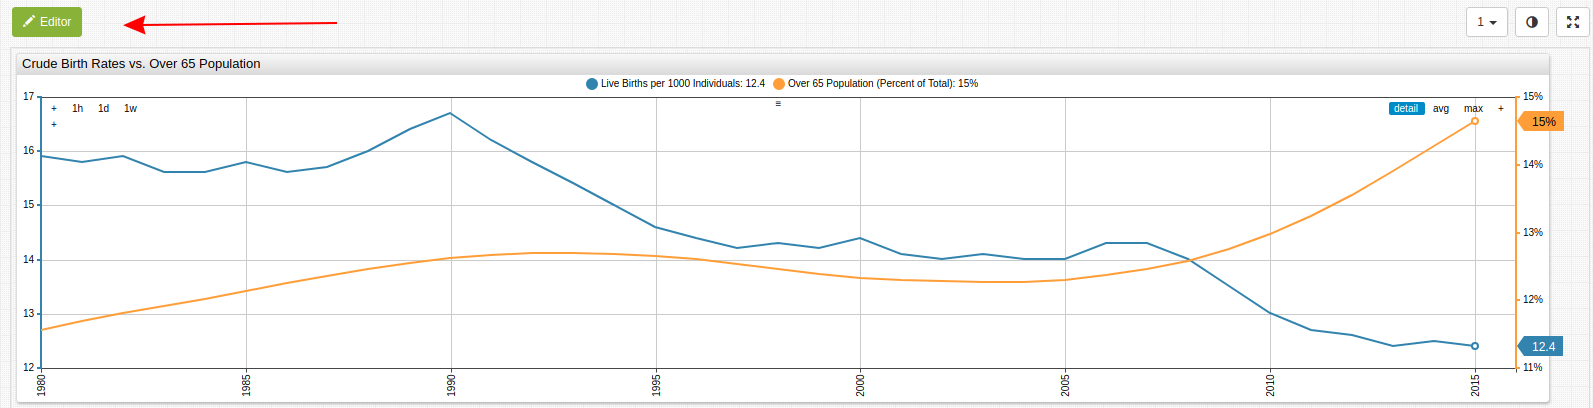

Using the chart above as a configuration example:
[configuration]
  height-units = 2
  width-units = 1
  offset-right = 20
  entity = fred.stlouisfed.org

  [group]
    [widget]
      title = Crude Birth Rates vs. Over 65 Population
      timespan = all
      markers = false
      type = chart
      start-time = 1980
      end-time = 2016

      [series]
        metric = SPDYNCBRTINUSA
        label = Live Births per 1000 Individuals
        style = stroke-width: 2

      [series]
        metric = SPPOP65UPTOZSUSA
        label = Over 65 Population (Percent of Total)
        replace-value = value/100
        format = %
        axis = right
        style = stroke-width: 2
Modify these settings or add new settings based on Charts syntax. Additionally, perform ad hoc transformations according to the Calculated Values, which details common transformations. which details common transformations. For more information about advanced portal configuration, refer to the Portal Layout Guide.
Likewise, derive new series from existing data according to Managing Calculated Values, which shows each step from one series to another.
For baselines and thresholds, manually input data using the value = x setting at the [series] level, where x is a constant value.
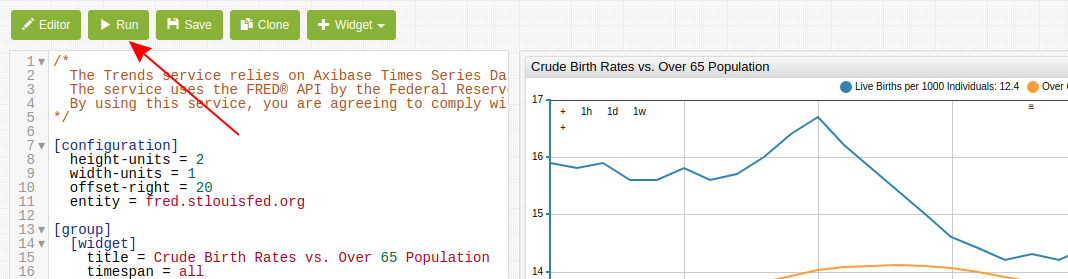
Once you modify a configuration, click Run to apply the new settings.
If you would like to create a new version of the current portal by adding a version suffix to the current URL, click Save.
To save the portal under an entirely new URL click Clone.
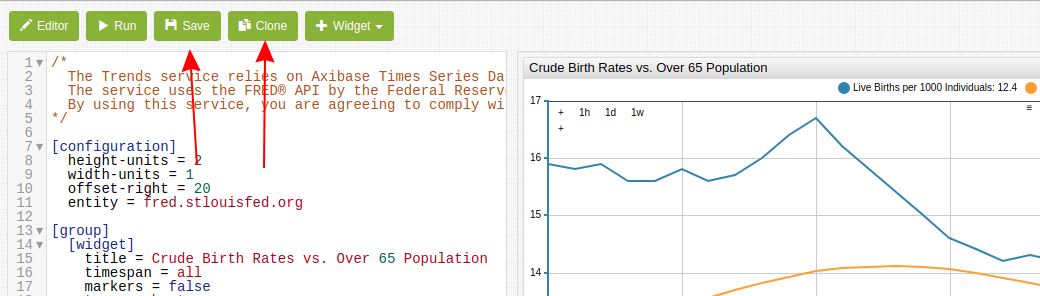
Trends is a sandbox for everyone, create your own charts and share the chart with others.
Pre-Defined Widgets
Click the Widgets button in the upper toolbar to copy pre-defined widget sections, use these widgets as templates for unique charts.
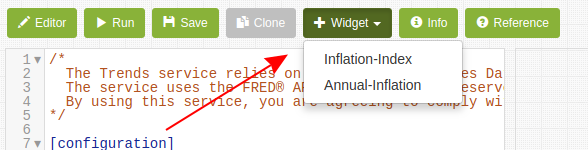
The two pre-defined widgets are described below:
Inflation Index: Experimental Consumer Price Index (CPIE) is the measure of a particular basket of consumer goods. It is often used by economists to track inflation across a given period of time or compare current dollar value to historic dollar value.
Annual Inflation: Percentile inflation for the United States. Inflation is calculated by comparing CPI, money supply, gross domestic product (GDP), and average wages. This widget relies on calculated metrics to created a derived measurement.
User-Defined Functions
The Charts API supports user-defined functions, enabling users to store and re-use statistical functions.
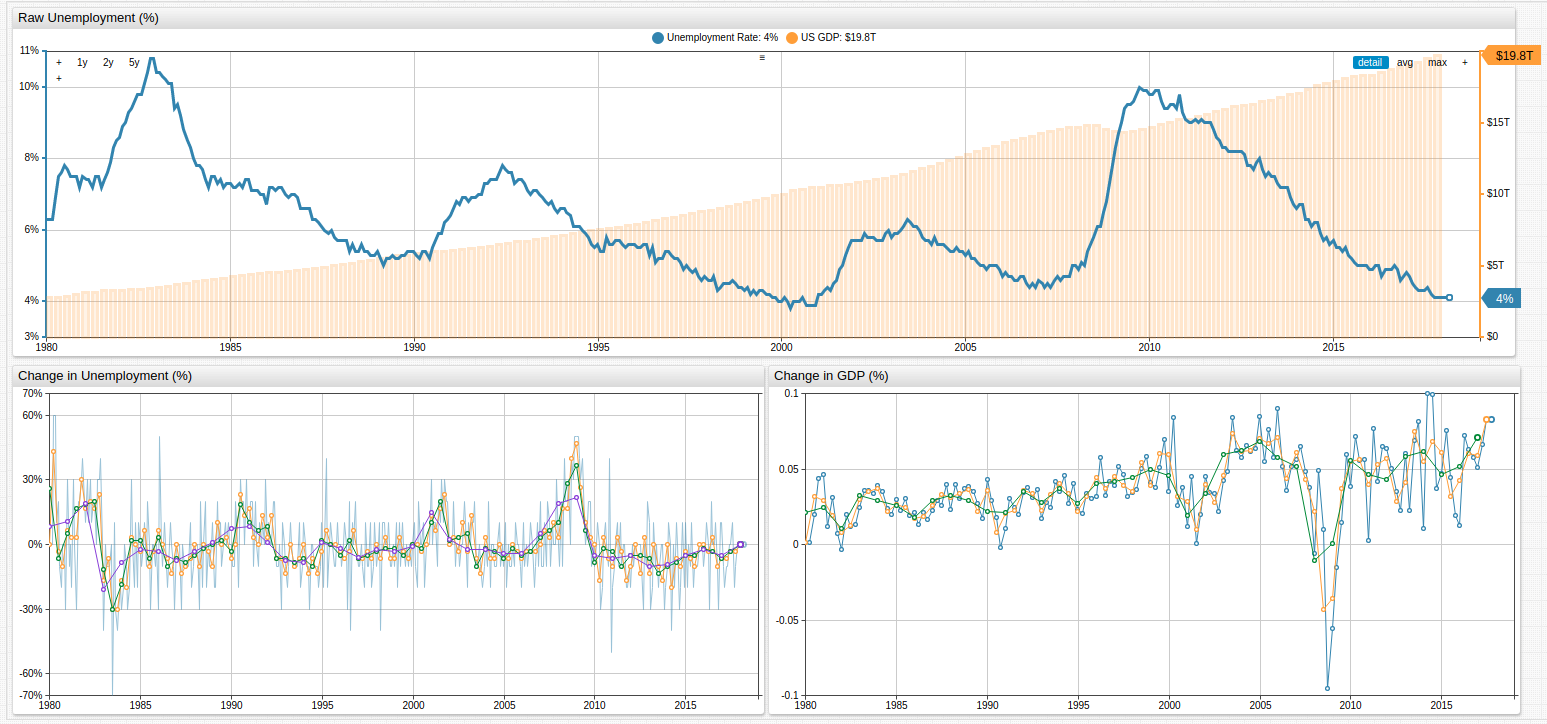
The above visualization applies user-defined functions for each of the series. An abbreviated version of the configuration is shown here:
### On the [configuration] level, the 'import' command is used to load functions from the `fred.js` file
### The library is assigned the name 'fred'.
### Multiple function libraries may be imported into the same portal.

[configuration]
  import fred = fred.js

  offset-right = 50
  height-units = 2
  width-units = 1
  start-time = 1980

  entity = fred.stlouisfed.org
  metric = unrate

[series]
  alias = base
  display = false

[series]
  value = fred.MonthlyChange('base')
Using two series, Trends calculates the monthly change as a new series with a value expression which applies MonthlyChange function from the fred library to the series identified with alias base.
fred Library
Any Trends user may access the fred.js library, which contains the following functions:
| Function Name | Arguments | Description |
|---|---|---|
MonthlyChange | alias | Month-on-month change |
ChangeFromYearAgo | alias | Year-on-year change |
ChangeByOffset | alias, interval | Customizable interval-on-interval change |
MonthlyPercentChange | alias | Month-on-month percent change |
PercentChangeFromYearAgo | alias | Year-on-year percent change |
PercentChangeByOffset | alias, interval | Customizable interval-on-interval change |
CompoundedAnnualRateOfChange | alias | Geometric-progression ratio which compounds change annually |
ContinuouslyCompoundedRateOfChange | alias | Geometric-progression ratio which continuously compounds change over an infinitesimally small interval |
NaturalLog | alias | Natural Logarithm (LOG base constant e) |
IndexMax | alias | Maximum series value is used as index value |
Index | alias, time | User-selected value is used as index value |
Open any of the visualizations above to see syntax and visual demonstrations of each function.
Further Reading
For more detailed information about ATSD, the underlying mechanics, or download instructions see the ATSD Documentation.
Reach out with questions, comments, or suggestions by raising an issue on the Axibase GitHub page.
For a complete list of metrics stored in Trends, see the Index. Good luck and happy data hunting!