Analyzing Econometric Datasets with Calculated Series

Summary
Use calculated values in ChartLab to create multiple visualizations from one dataset. Axibase Charts supports a range of aggregators to modify underlying data.
The Federal Reserve maintains the open-access database Federal Reserve Economic Data (FRED) for use in the exploration and analysis of data collected and published by the Federal Reserve. One important metric tracked
by FRED is CPIAUCSL: Consumer Price Index, or CPI. A consumer price index tracks inflation by measuring the changing costs of goods based on some index year.
Problem Brief
Replicate and modify the FRED CPI visualization using ChartLab.
To learn more about how any of these metrics are calculated from the underlying data, What Formulas are Used to Calculate Growth Rates? provides information about the underlying mathematics.
A brief tutorial on data modification in the FRED interface is shown below:
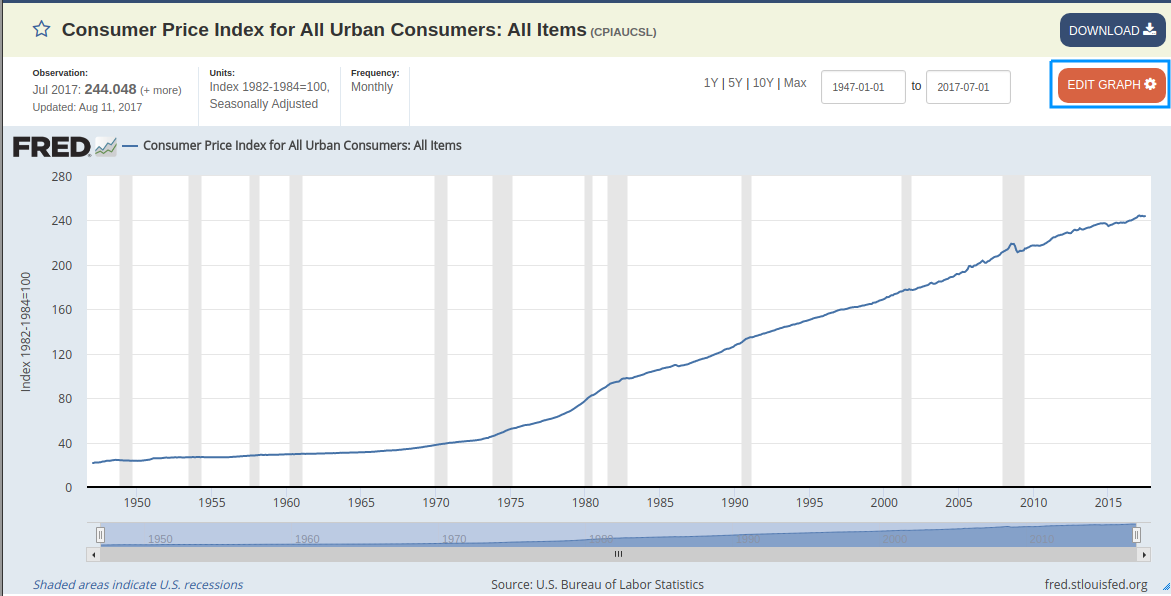
- Open the transformation interface by clicking EDIT GRAPH.
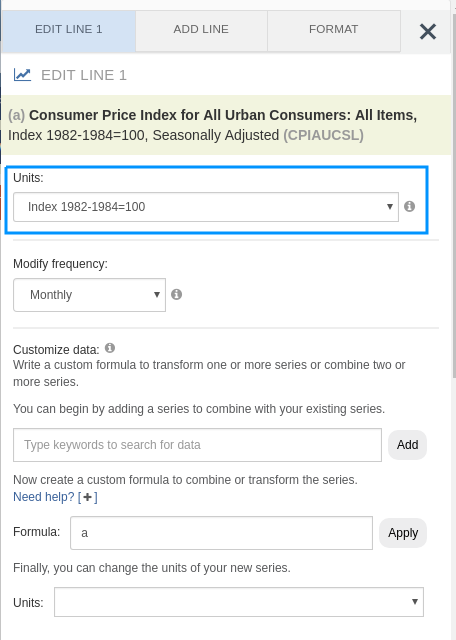
- From the Units drop-down list, select a transformation.
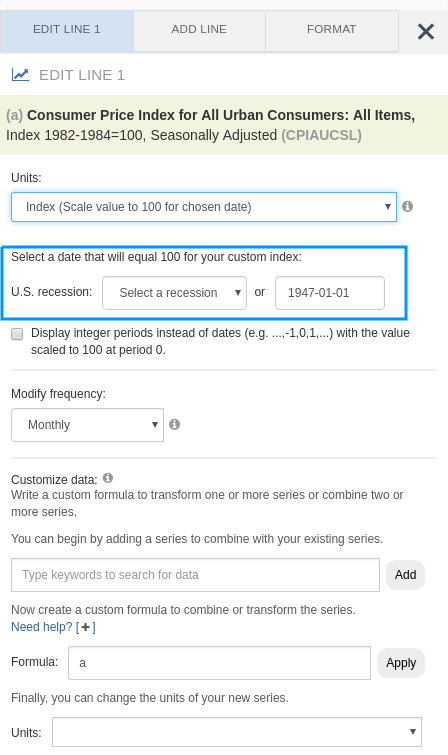
- Modify parameters of the transformation as needed.
Solution
A side-by-side comparison of each feature of CPI transformation is shown below, as well as links to the accompanying visualizations.
Note that because ATSD supports storing historical data from the year 1970 onward while the Federal Reserve tracks data from 1947 onward, small scale differences are expected in the outputs of each graph.
Index
- Consumer Price Index
- Monthly Change
- CPI Calculated from a Variable Baseline
- Change from a Year Ago
- Monthly Percent Change
- Monthly Percent Change from a Year Ago
- Compounded Annual Rate of Change
- Continuously Compounded Rate of Change
- Continuously Compounded Annual Rate of Change
- Natural Logarithm of CPI
- Max Index
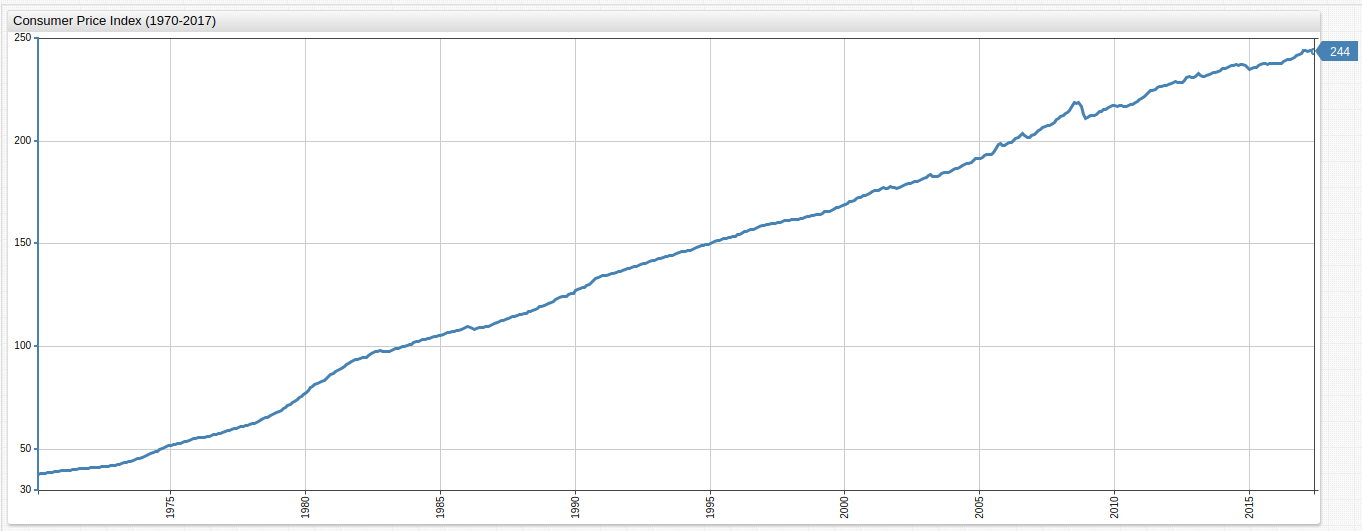
Consumer Price Index
Figure 1: Consumer Price Index for Baseline Year 1982 (1947-2017) FRED
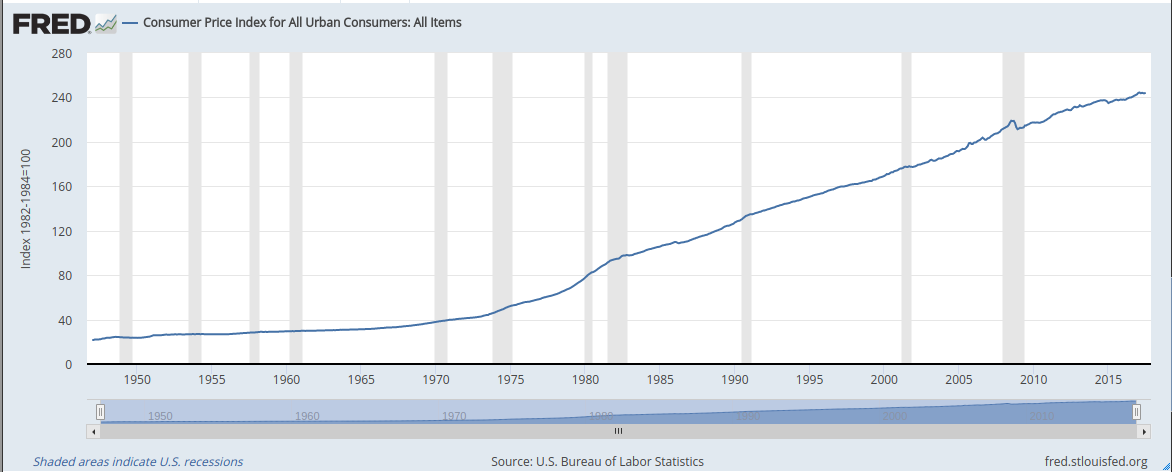
Figure 2: Consumer Price Index (1970-2017) ATSD
Return to the Index
CPI Calculated from a Variable Baseline
The index is the baseline year to which previous or subsequent years are compared. Those years with an increase in the cost of consumer goods are therefore greater than 100.00 while years with deflation in the cost of consumer goods based on the index are less than 100.00.
Figure 3: CPI Calculated from a Variable Baseline (1990-07-01) FRED
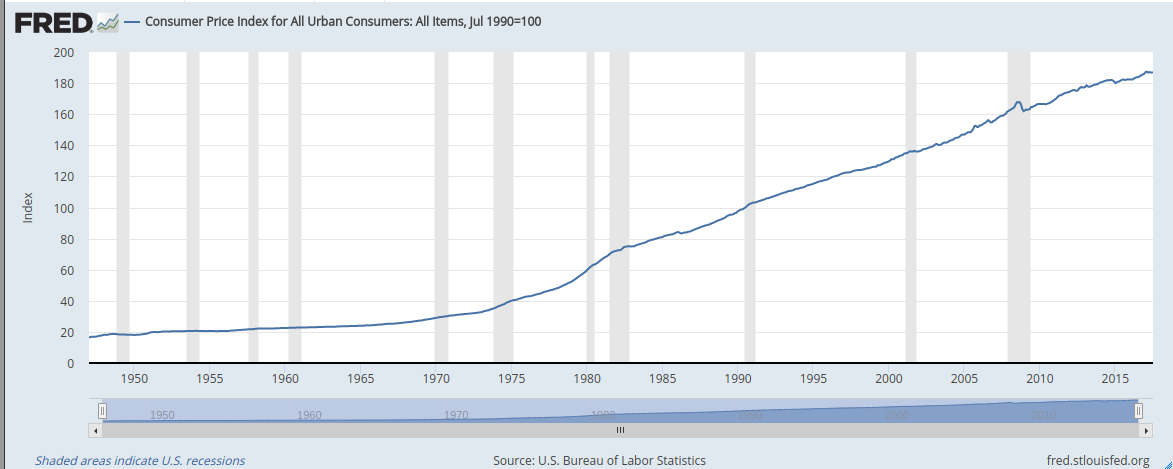
Figure 4: CPI Calculated from a Variable Baseline (1990-07-01) ATSD
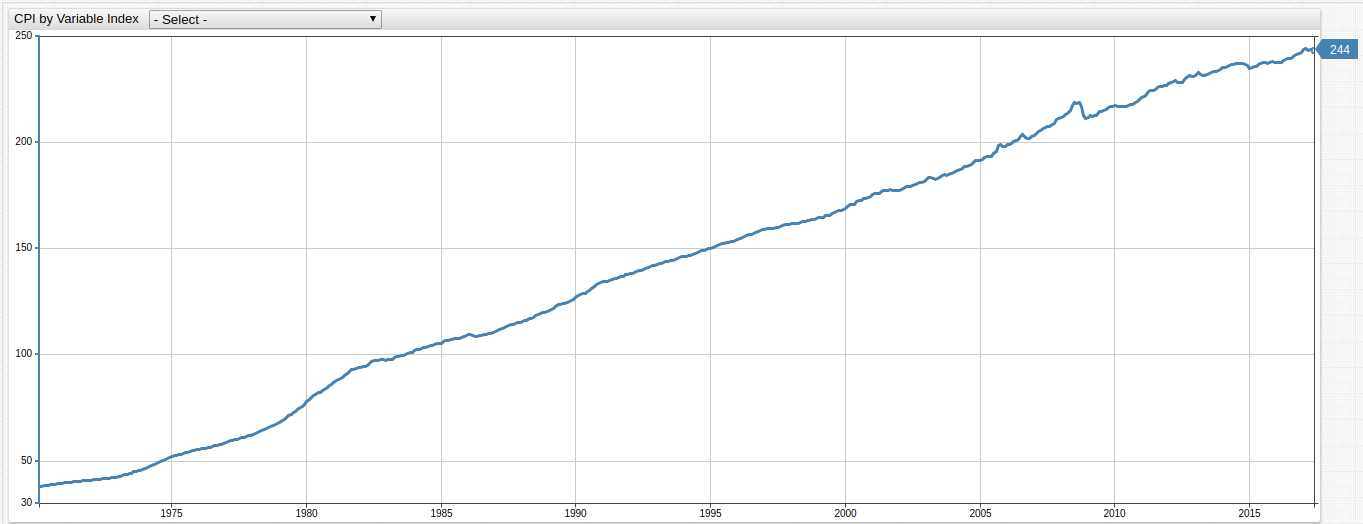
In ChartLab, use the drop-down list at the top of the visualization to select the baseline year, or hardcode
a year not included in the drop-down list by modifying one of the dates in the keyDates list.
Key Components of This Visualization:
Open the ChartLab visualization shown above and view the Editor window to inspect chart configuration.
- The list
keyDatescontains the same dates as the FRED chart referenced in the Problem Brief:
list keyDates = 1970-11-01,
  1973-11-01, 1975-03-01,
  1980-01-01, 1980-07-01,
  1981-07-01, 1982-11-01,
  1990-07-01, 1991-03-01,
  2001-03-01, 2001-11-01,
  2007-12-01, 2009-06-01
endlist
- These dates are displayed in the drop-down list and represent official start dates of various United States recessions.
The syntax for this drop-down list is shown below:
[dropdown]
  on-change = widget.config.series[0].value = this.value; widget.replaceSeries(widget.config.series);
  for date in keyDates
    [option]
      text = Index (Scale to 100 for @{date})
      value = value("cpi") / value("cpi_@{date}") * 100 || null
  endfor
For more information about the above syntax refer to Charts documentation.
Modify any of the dates contained in the keyDates list above to select a date to use as the baseline value. The value setting under the [option] heading of the [dropdown] configuration above uses a formula to calculate a new index.
The on-change setting defines the newly calculated series.
Additional configuration components are enumerated below:
widget.config.series[0]: selects the series to be replaced. Series are indexed beginning with0and increasing by a single step for each additional series (0,1,2,3...). There is only one underlying series in this visualization.value = this.value: specifies a user-defined value, the option selected in the drop-down list, as the value for the series defined in the thewidget.configportion of the script.thisdefines the specific object to be modified, in this case the drop-down list.widget.replaceSeries(widget.config.series): replaces the underlying values of the original series defined as a parameter of the function, with the newly calculated values defined under the[option]heading.
Return to the Index
Monthly Change
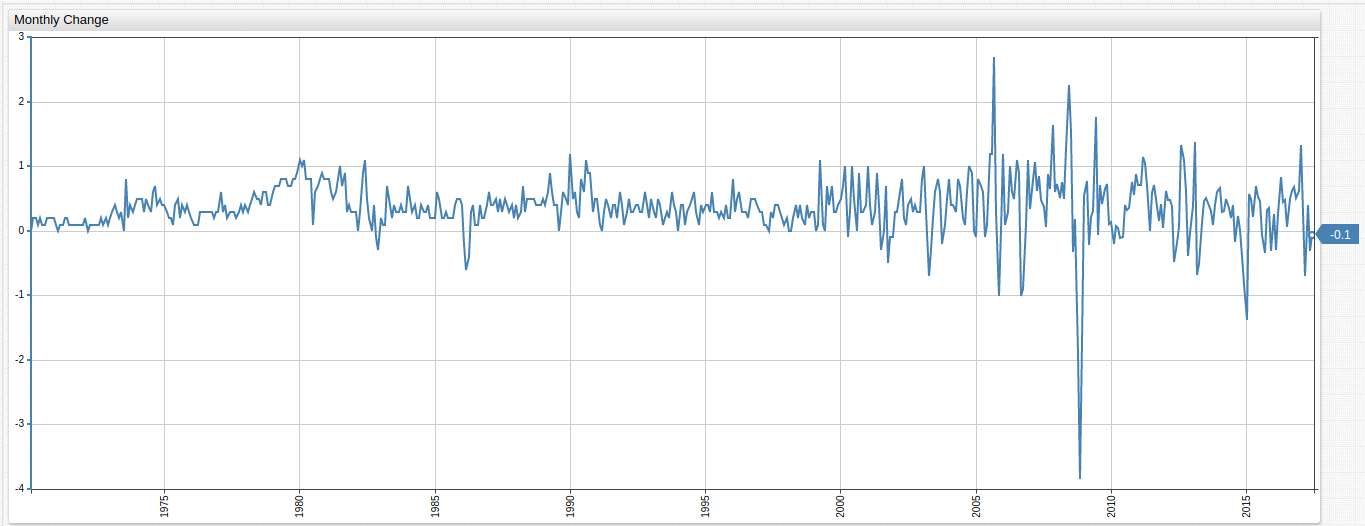
Monthly nominal change in CPI value over the observed period.
Figure 5: Monthly Change (1947-2017) FRED
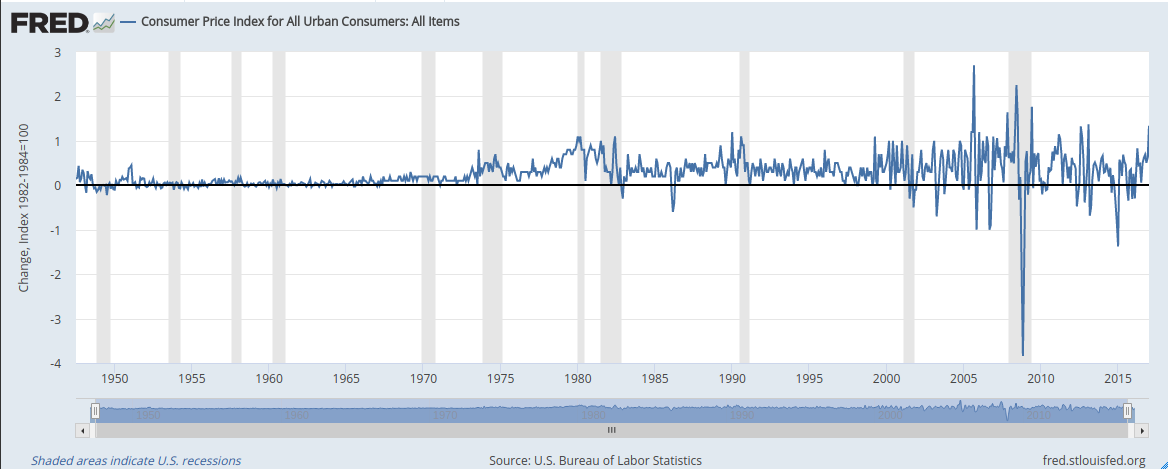
Figure 6: Monthly Change (1970-2017) ATSD
Underlying formula:
value = delta("cpi", "1 month")
- This configuration uses the
deltafunction.
Return to the Index
Change From a Year Ago
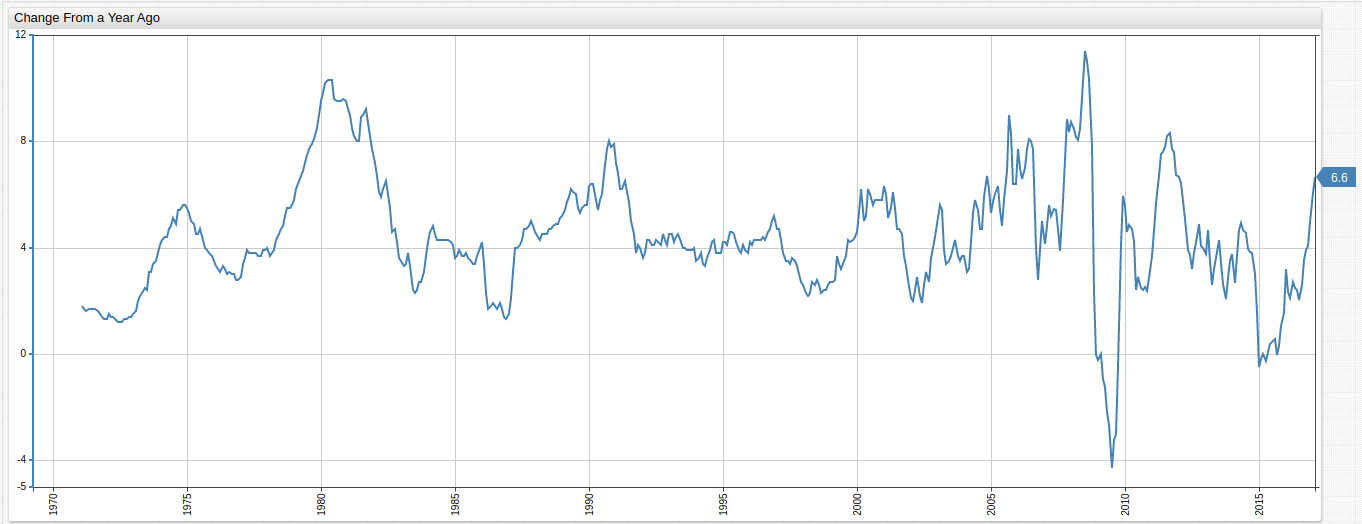
Nominal change in CPI value from the same month of the previous year.
Figure 7: Change From Previous Year (1947-2017) FRED
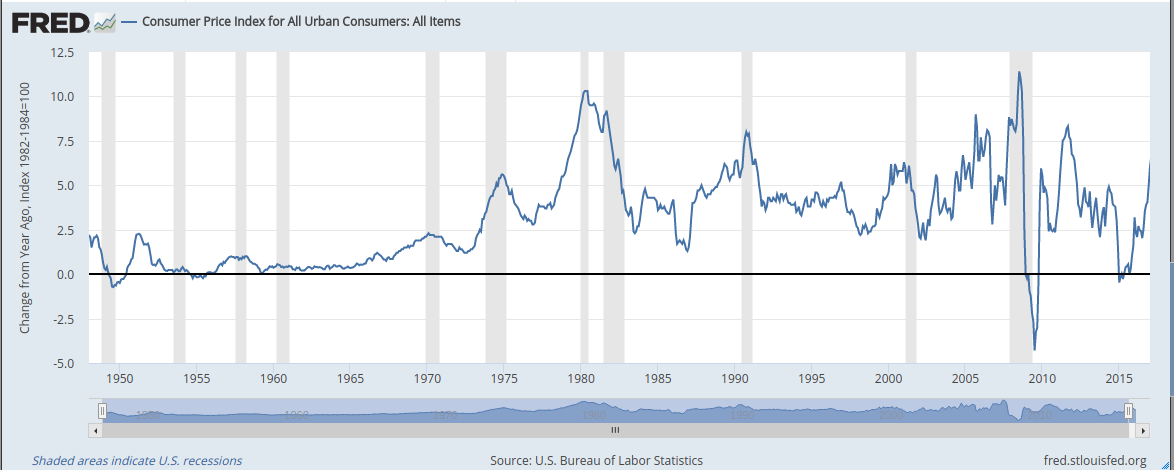
Figure 8: Change From Previous Year (1970-2017) ATSD
Underlying formula:
value = var v = value('cpi'); var p = value('prev_cpi'); if(p != null && v != null) return v - p;
- This configuration uses a second underlying series to select CPI values from one year ago via the
time-offsetsetting and compares the data to current year values.
Return to the Index
Monthly Percent Change
Monthly percentile change in CPI value over the entire observed period.
Figure 9: Monthly Percent Change (1947-2017) FRED
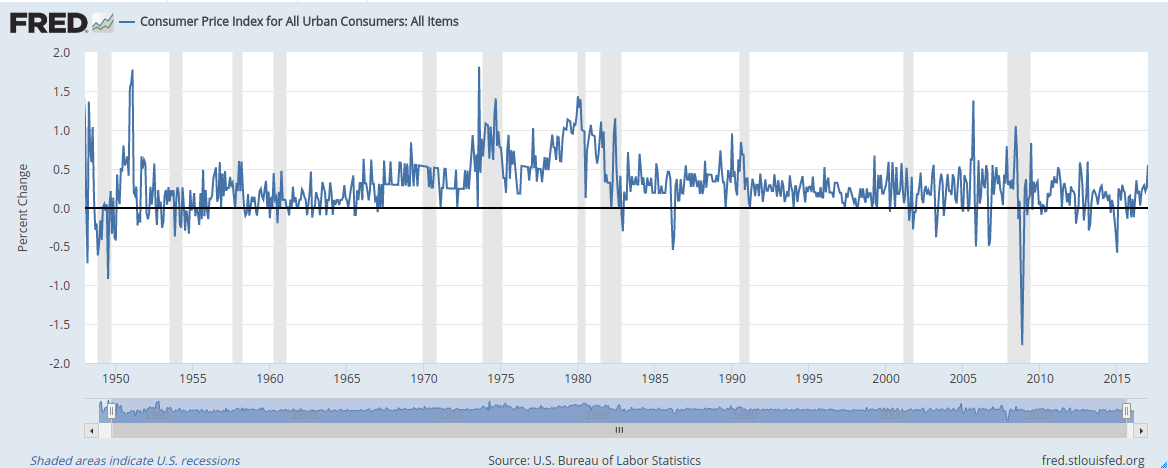
Figure 10: Monthly Percent Change (1970-2017) ATSD
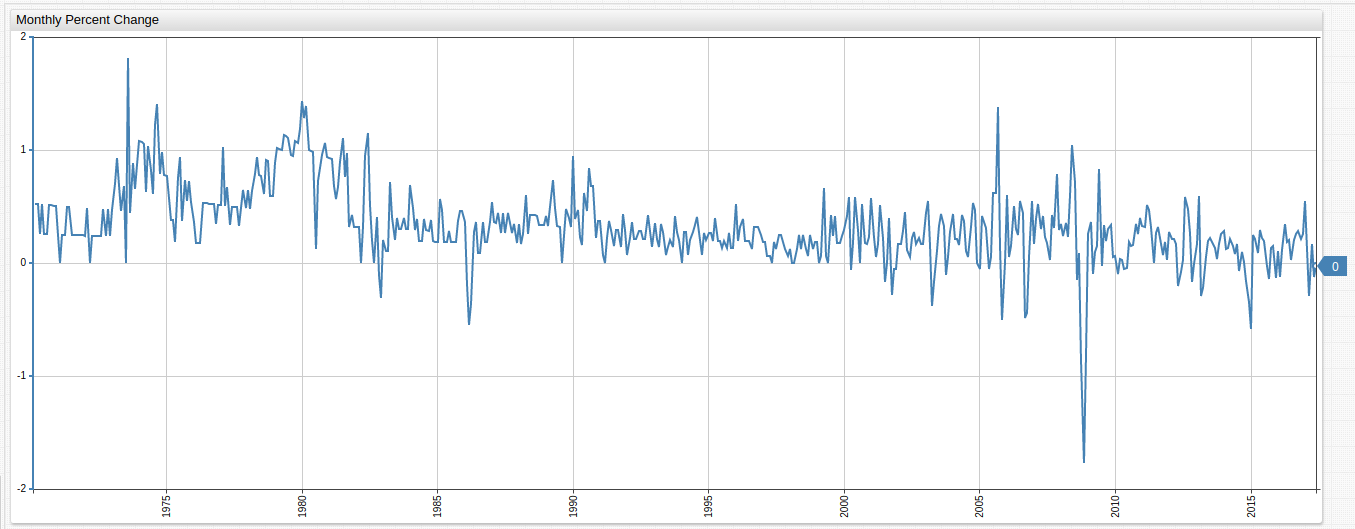
Underlying Formula:
value = (value("cpi") / previous("cpi") - 1) * 100
- This configuration uses the
previous()function.
Return to the Index
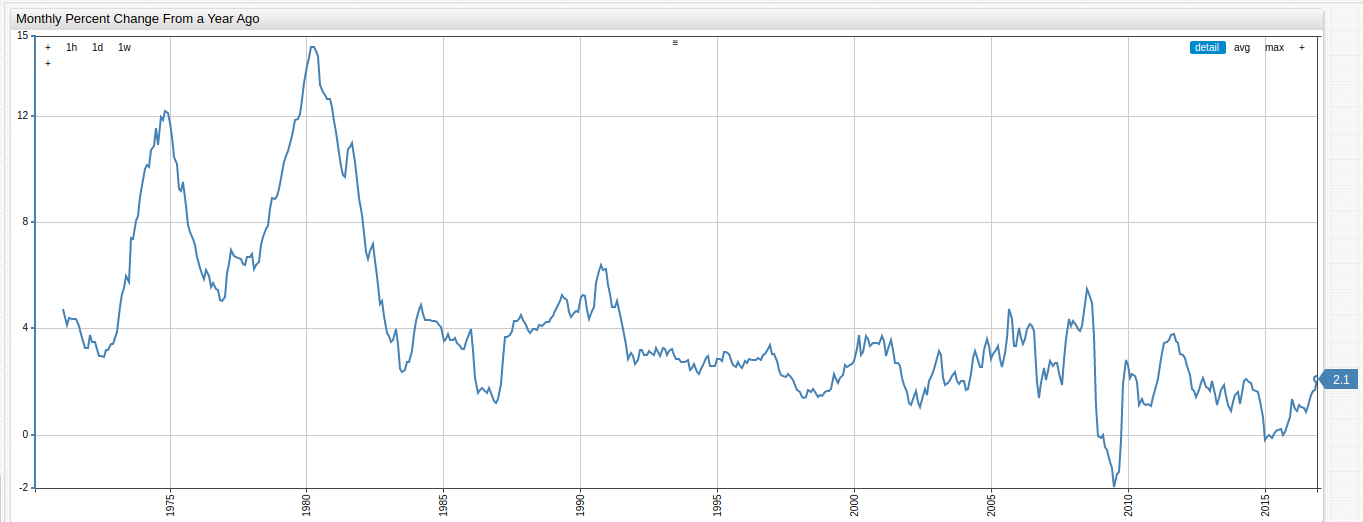
Monthly Percent Change From a Year Ago
CPI percentile change from the same month of the previous year.
Figure 11: Monthly Percent Change From Previous Year (1947-2017) FRED
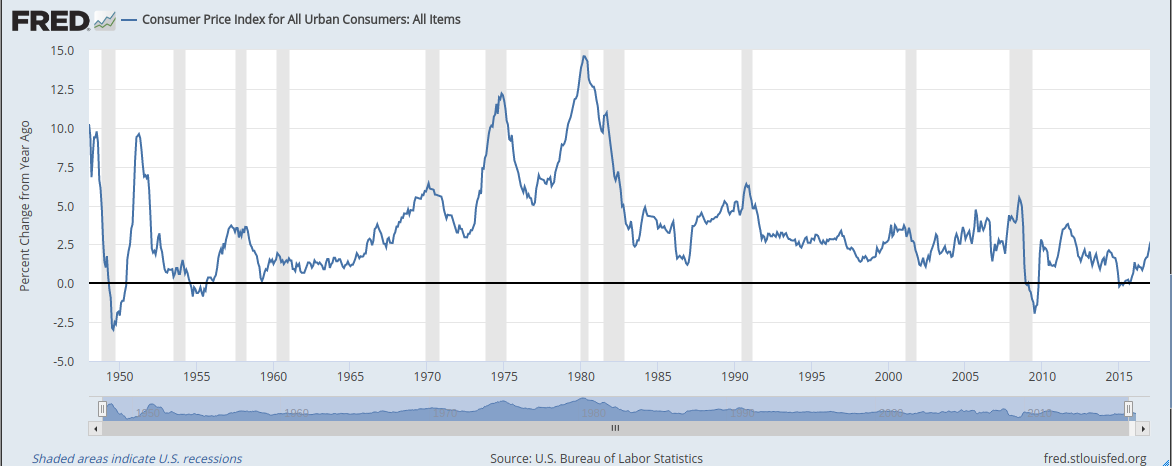
Figure 12: Monthly Percent Change From Previous Year (1970-2017) ATSD
Underlying Formula:
value = var v = value('cpi'); var p = value('prev_cpi'); if(p!=null && v!=null) return (v / p - 1) * 100
Return to the Index
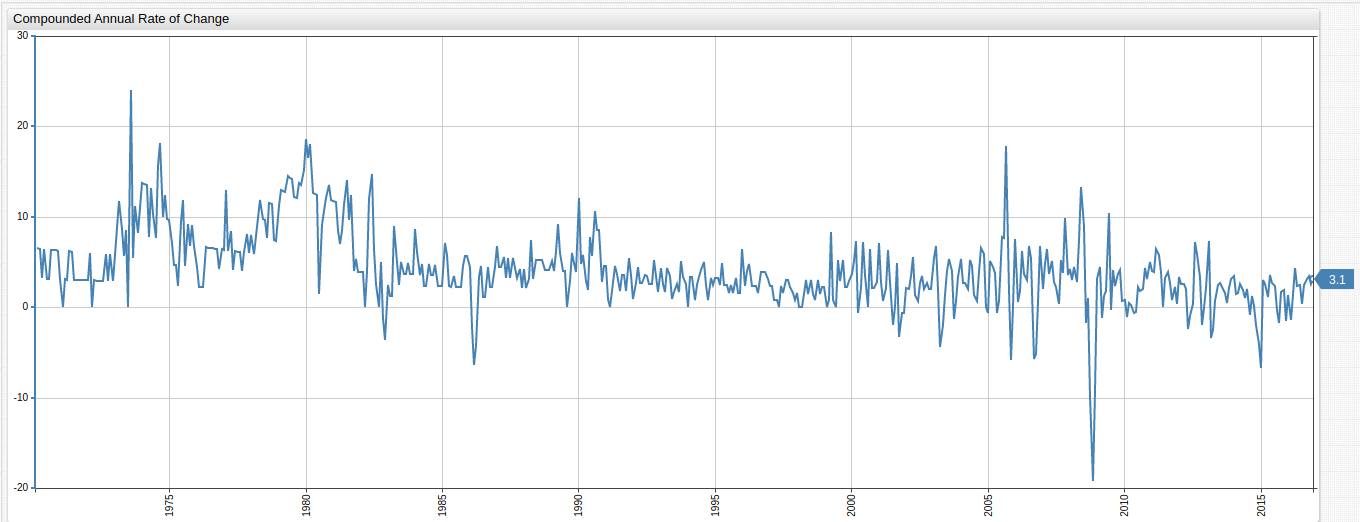
Compounded Annual Rate of Change
Mean annual rate of change for CPI.
Figure 13: Compounded Annual Rate of Change (1947-2017) FRED
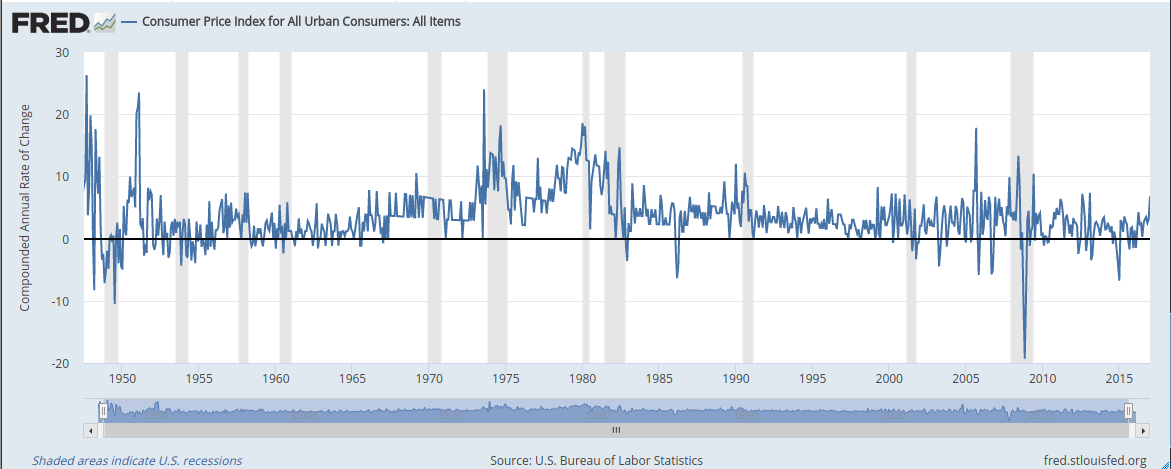
Figure 14: Compounded Annual Rate of Change (1970-2017) ATSD
Underlying formula:
value = (Math.pow(( value("cpi") / previous("cpi") ), 12) - 1) * 100
- This configuration uses the
MathJavaScript object.
Return to the Index
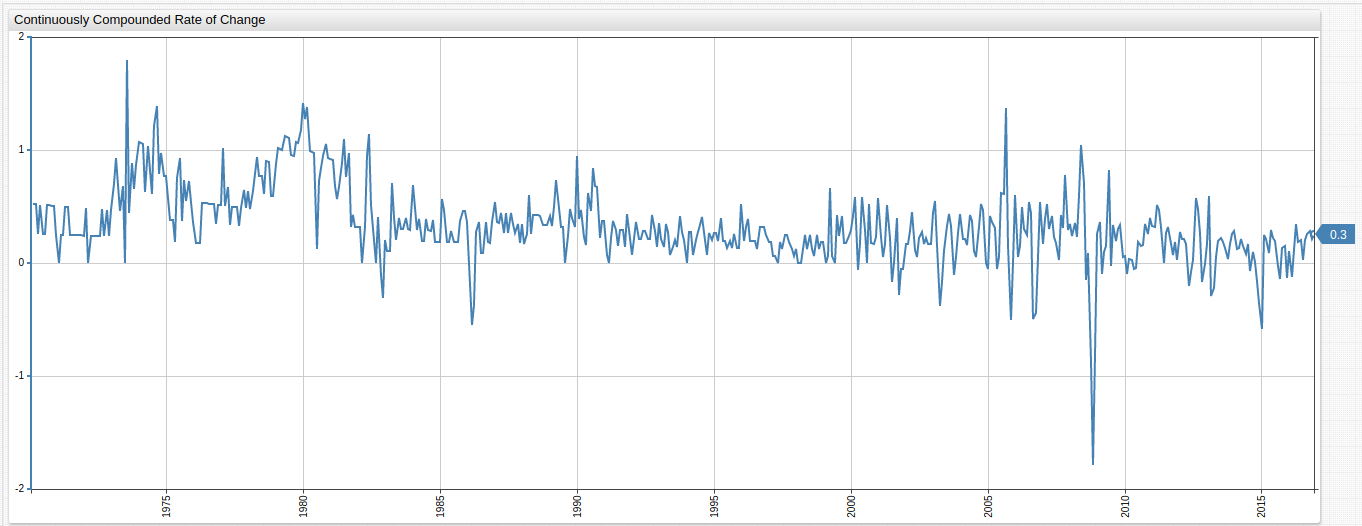
Continuously Compounded Rate of Change
Continuously compounded mean rate of change for CPI.
Figure 15: Continuously Compounded Rate of Change (1947-2017) FRED
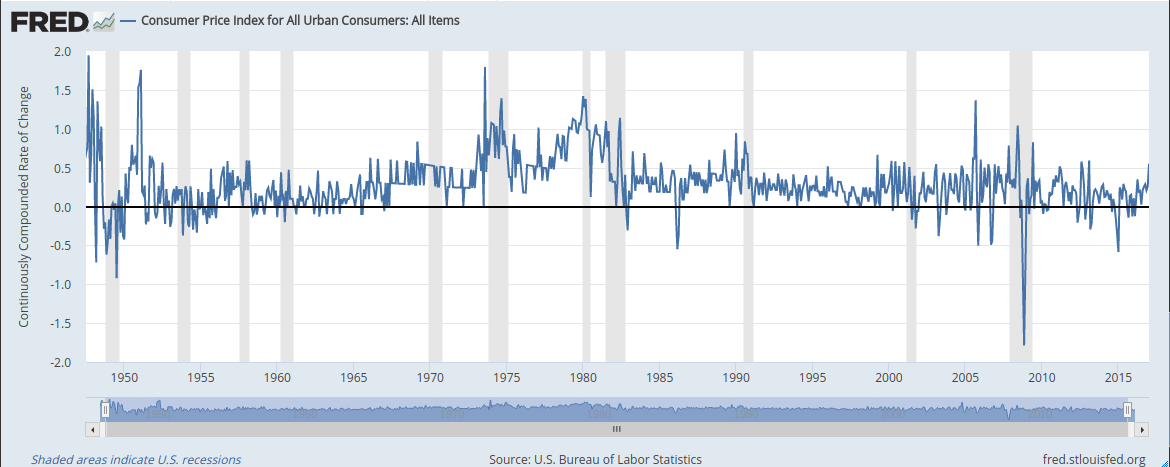
Figure 16: Continuously Compounded Rate of Change (1970-2017) ATSD
Underlying formula:
value = ( Math.log(value("cpi")) - Math.log(previous("cpi")) ) * 100
Return to the Index
Continuously Compounded Annual Rate of Change
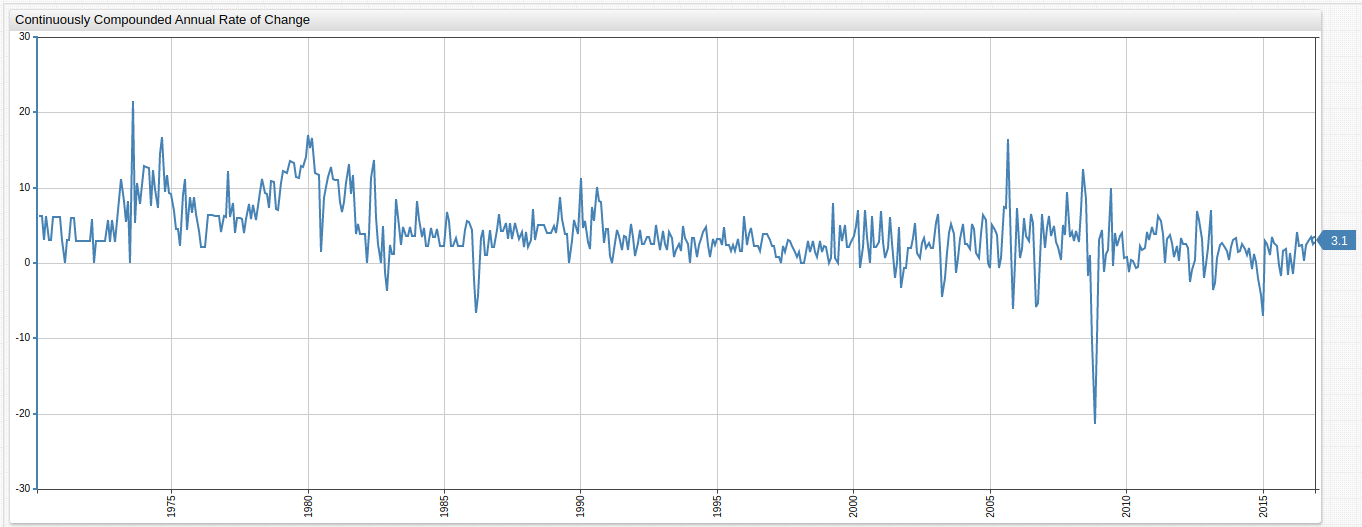
Annual rate of change compounded continuously for the observed period.
Figure 17: Continuously Compounded Annual Rate of Change (1947-2017) FRED
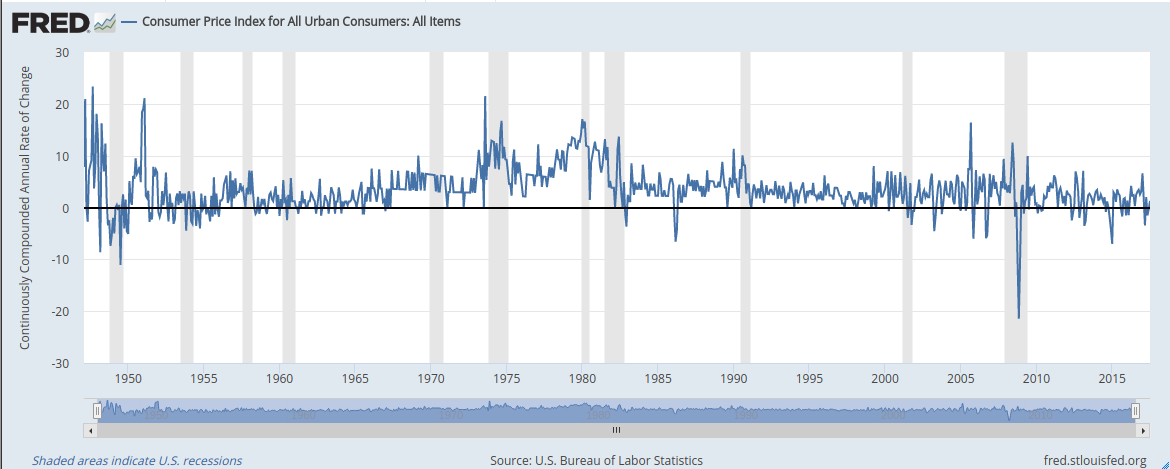
Figure 18: Continuously Compounded Annual Rate of Change (1970-2017) ATSD
Underlying formula:
value = ( Math.log(value("cpi")) - Math.log(previous("cpi")) ) * 100 * 12
Return to the Index
Natural Logarithm of CPI
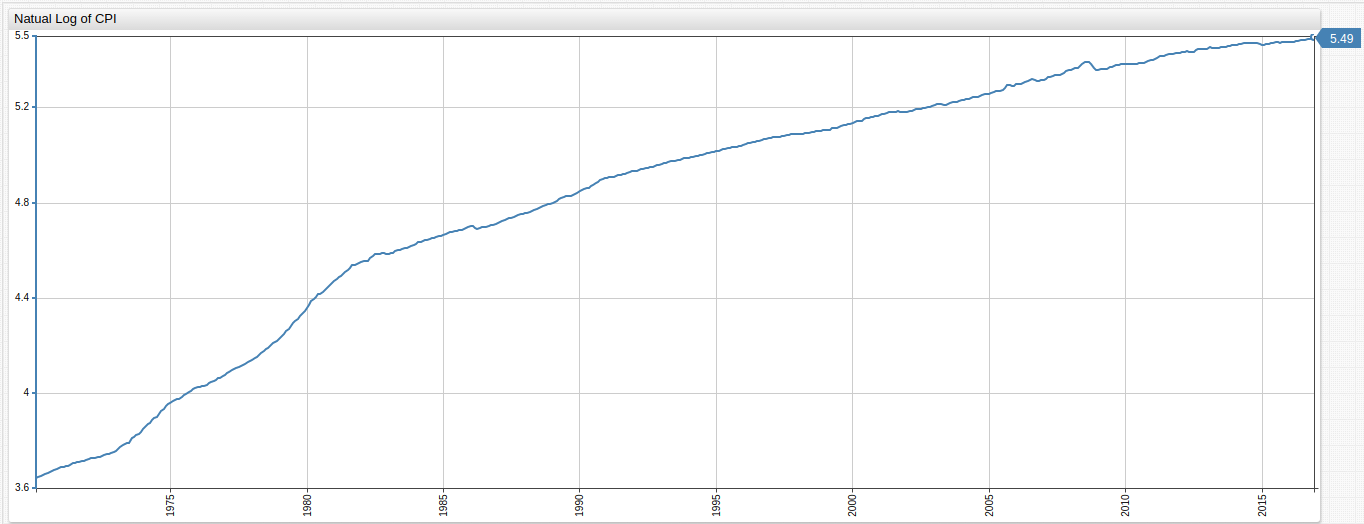
The logarithm of each value set to base of the mathematical constant e (2.71828).
Figure 19: Natural logarithm of CPI (1947-2017) FRED
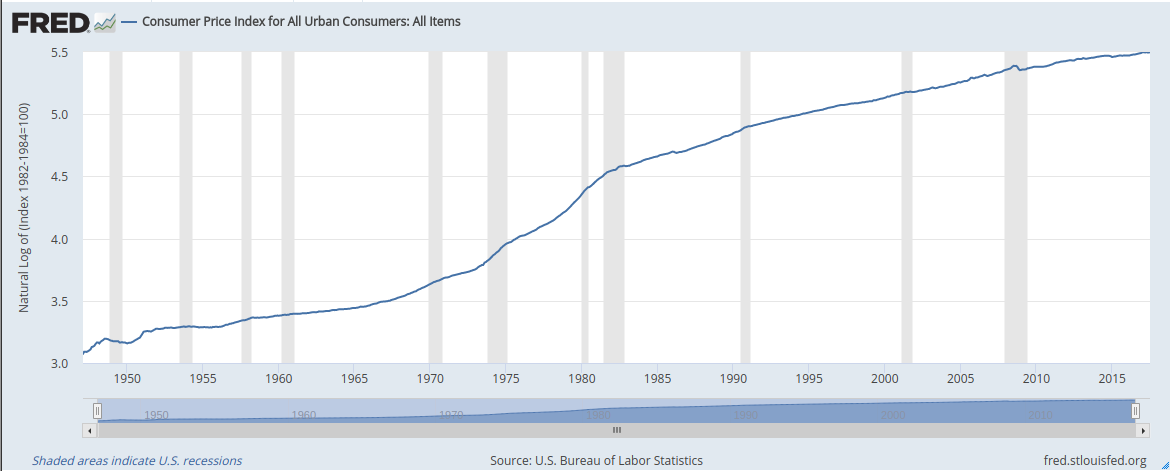
Figure 20: Natural logarithm of CPI (1970-2017) ATSD
Underlying formula:
value = Math.log(value("cpi"))
Return to the Index
Max Index
Index CPI by maximum value.
Figure 21: CPI with Most Recent Data as Index (1947-2017) FRED
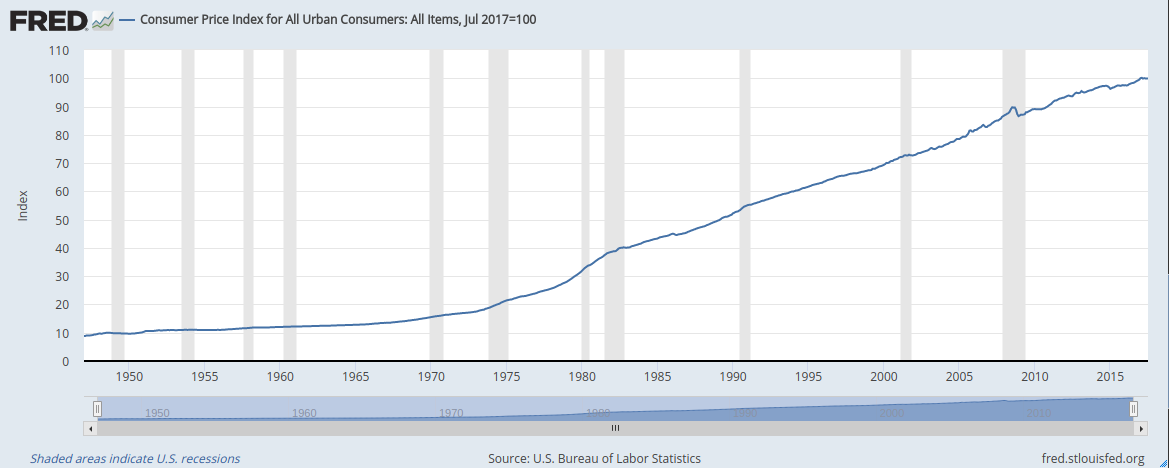
Figure 22: CPI with Most Recent Data as Index (1970-2017) ATSD
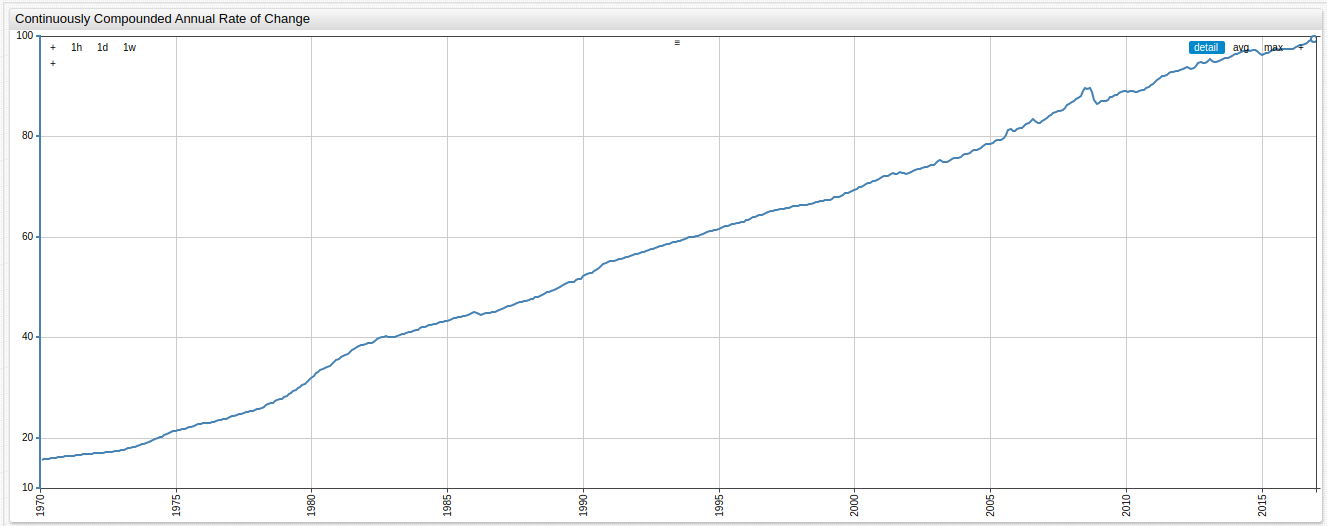
Underlying formula:
value = value("cpi") / value("cpi_max") * 100 || null
Return to the Index
