Calculated Values in SQL Console and ChartLab
Overview
ATSD supports ad hoc calculation in SQL Console and Charts services.
This article describes the use of the replace-value setting in ChartLab and the LAG function in SQL Console to derive percent change for a given dataset.
Data
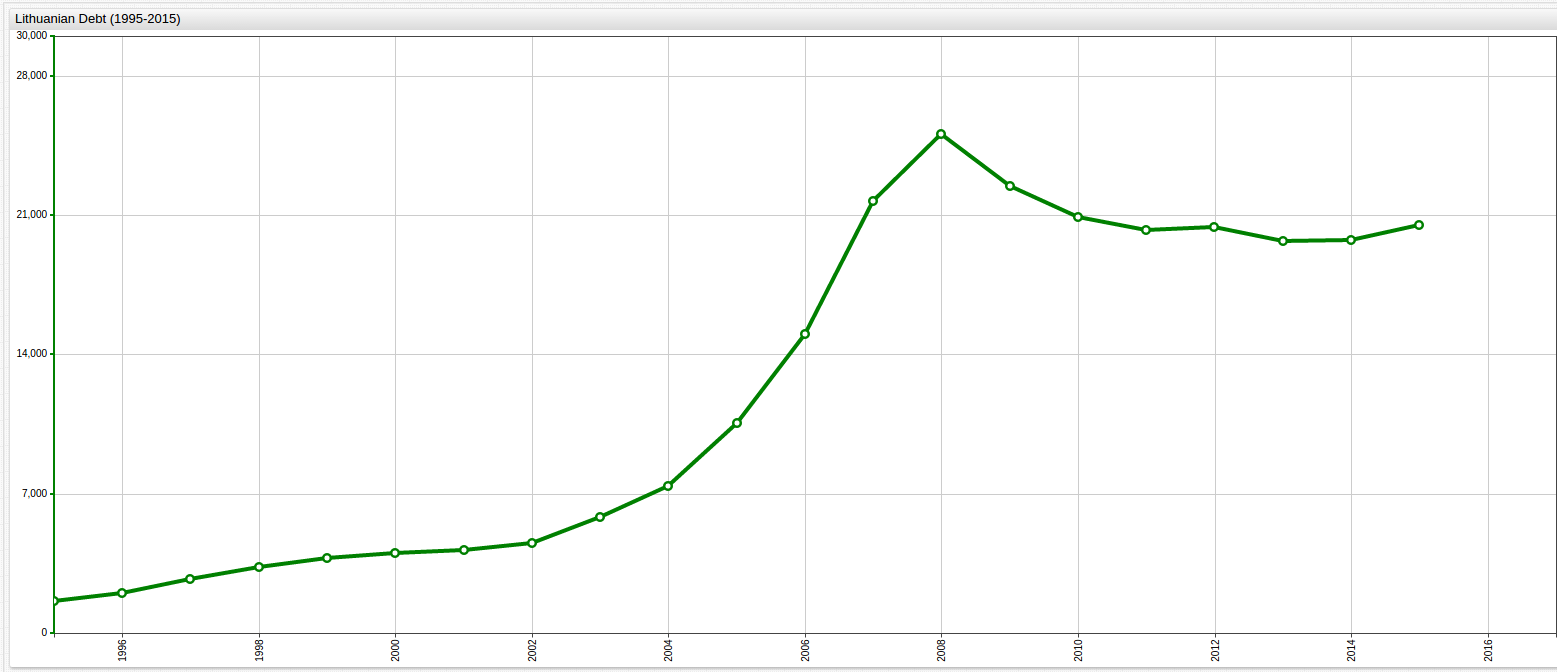
Data is collected by the entity Eurostat tracking European Union Debt by Country, available in the Axibase Data Library.
SELECT date_format(time, 'yyyy') AS "Year", value AS "Debt (Million Euro)"
  FROM lithuania
| Year | Debt (Million Euro) |
|---|---|
| 1995 | 1632.0 |
| 1996 | 2034.9 |
| 1997 | 2734.3 |
| 1998 | 3306.2 |
| 1999 | 3790.3 |
| 2000 | 4028.1 |
| 2001 | 4162.2 |
| 2002 | 4517.3 |
| 2003 | 5822.8 |
| 2004 | 7372.5 |
| 2005 | 10539.2 |
| 2006 | 15023.2 |
| 2007 | 21689.8 |
| 2008 | 25084.0 |
| 2009 | 22449.2 |
| 2010 | 20892.0 |
| 2011 | 20239.2 |
| 2012 | 20381.5 |
| 2013 | 19715.7 |
| 2014 | 19748.3 |
| 2015 | 20525.2 |

To calculate the percent growth of Lithuanian debt over the 20-year observation period, use baselines.
Three common baselines:
- Previous Year Baseline (PYB)
- Average Value Baseline (AVB)
- Final Year Baseline (FYB)
Previous Year Baseline
SELECT date_format(time, 'yyyy') AS "Year", value AS "Debt (Million Euro)", 100*((value)/LAG(value)-1) AS "Percent Change (PYB)"
  FROM lithuania
ORDER BY datetime
The underlying formula in this query is simple:
PYB = 100 * [(x/y) - 1]
Where,
x = current year debt amount, and y = previous year debt amount`
| Year | Debt (Million Euro) | Percent Change (PYB) |
|------|---------------------|----------------------|
| 1995 | 1632.00             | null                 |
| 1996 | 2034.90             | 24.69                |
| 1997 | 2734.30             | 34.37                |
| 1998 | 3306.20             | 20.92                |
| 1999 | 3790.30             | 14.64                |
| 2000 | 4028.10             | 6.27                 |
| 2001 | 4162.20             | 3.33                 |
| 2002 | 4517.30             | 8.53                 |
| 2003 | 5822.80             | 28.90                |
| 2004 | 7372.50             | 26.61                |
| 2005 | 10539.20            | 42.95                |
| 2006 | 15023.20            | 42.55                |
| 2007 | 21689.80            | 44.38                |
| 2008 | 25084.00            | 15.65                |
| 2009 | 22449.20            | -10.50               |
| 2010 | 20892.00            | -6.94                |
| 2011 | 20239.20            | -3.12                |
| 2012 | 20381.50            | 0.70                 |
| 2013 | 19715.70            | -3.27                |
| 2014 | 19748.30            | 0.17                 |
| 2015 | 20525.20            | 3.93                 |
The LAG function returns null when no data is found.
Use the replace-value setting to apply the same calculation in ChartLab. Open the Editor window in ChartLab and inspect the setting on line 16.
replace-value = (value/previousValue-1)*100
Track positive debt growth with an alert-expression.
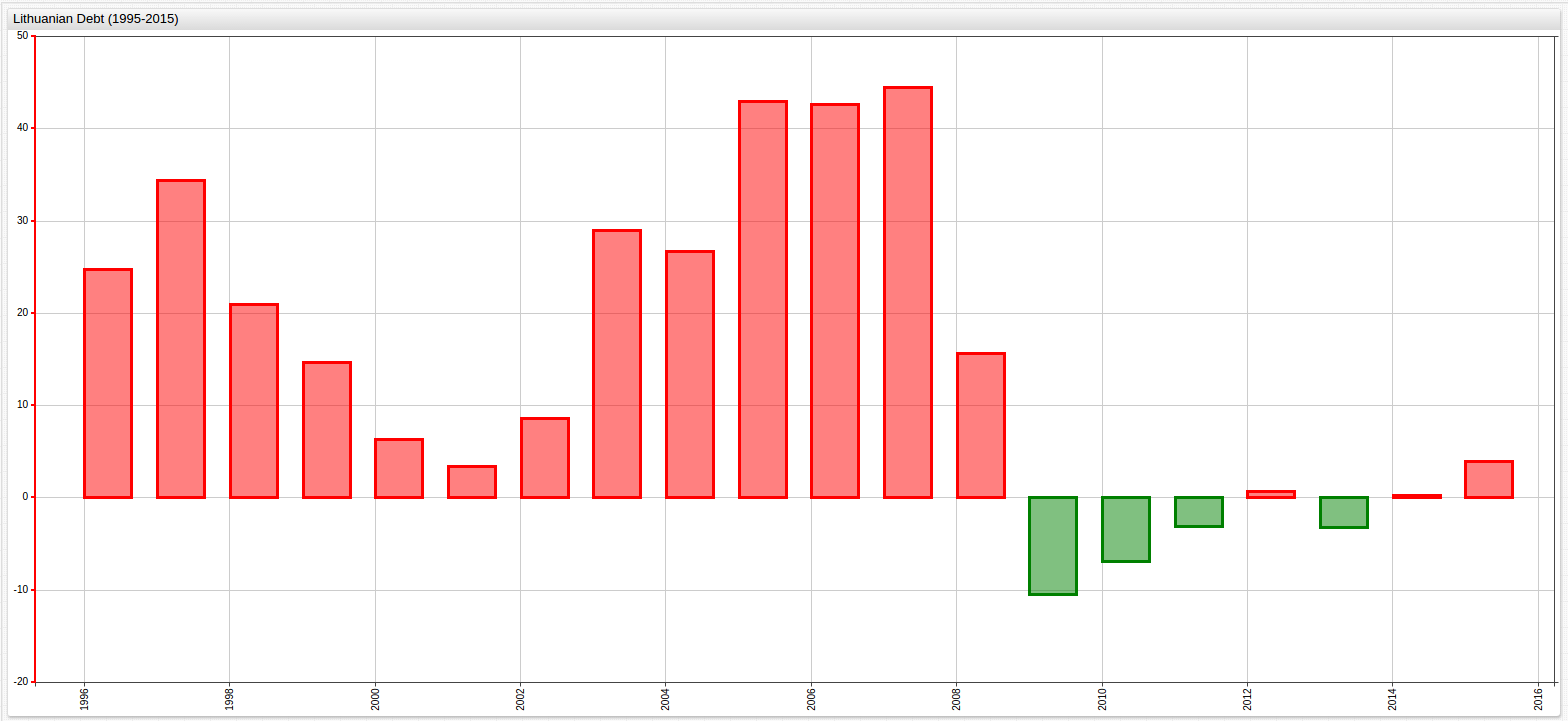
Inspect the alert-expression syntax on lines 17 and 18.
alert-expression = value < 0
alert-style = fill: green
This setting renders all incidences of negative debt growth (debt growth less than zero) green, while positive debt growth is rendered red.
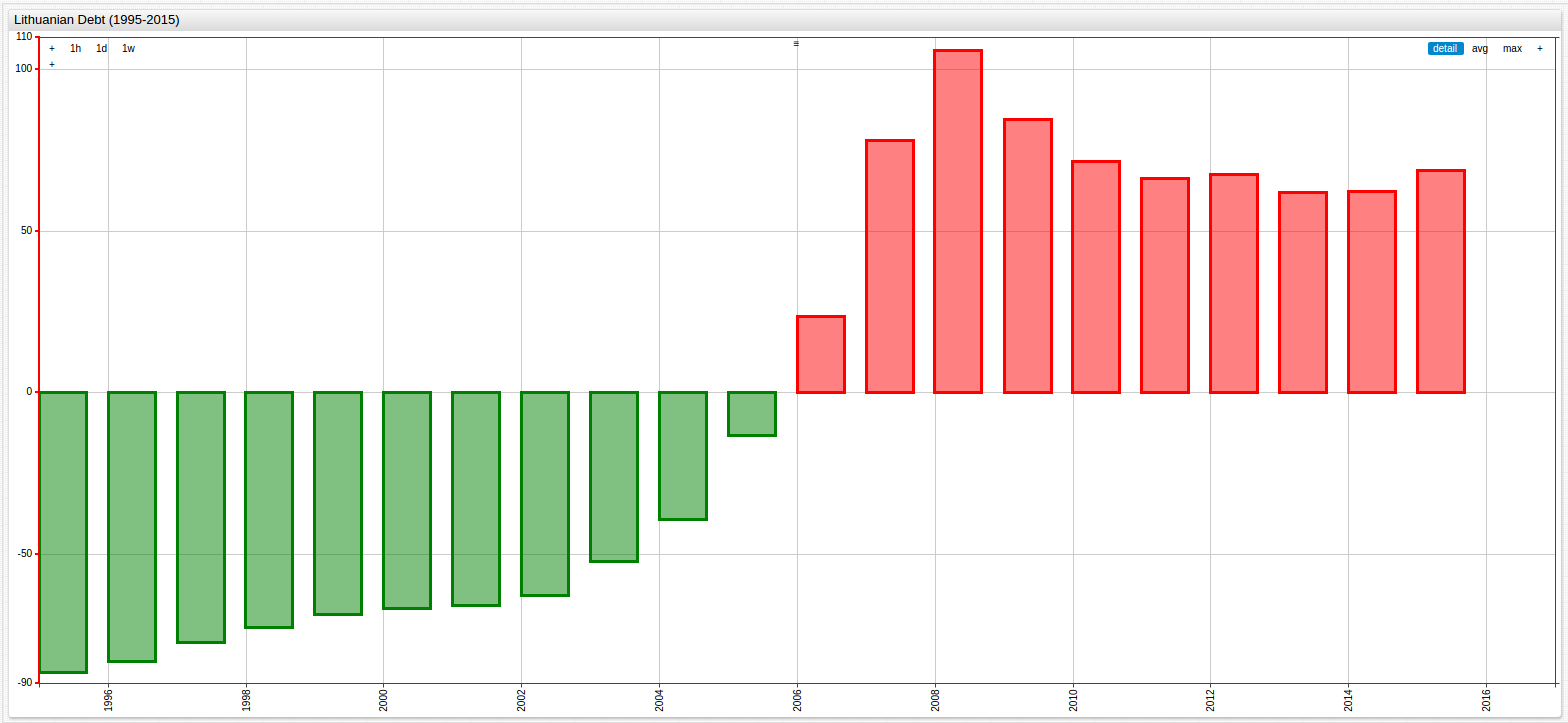
Average Value Baseline
SELECT AVG(value) AS "Debt (Million Euro)"
  FROM lithuania
| Debt (Million Euro) |
|---|
| 12175.6 |
SELECT date_format(time, 'yyyy') AS "Year", value AS "Debt (Million Euro)", (100*((value)/12175.6-1)) AS "Percent Change (AVB)"
  FROM lithuania
ORDER BY datetime
| Year | Debt (Million Euro) | Percent Change (AVB) |
|---|---|---|
| 1995 | 1632.0 | -86.6 |
| 1996 | 2034.9 | -83.3 |
| 1997 | 2734.3 | -77.5 |
| 1998 | 3306.2 | -72.8 |
| 1999 | 3790.3 | -68.9 |
| 2000 | 4028.1 | -66.9 |
| 2001 | 4162.2 | -65.8 |
| 2002 | 4517.3 | -62.9 |
| 2003 | 5822.8 | -52.2 |
| 2004 | 7372.5 | -39.4 |
| 2005 | 10539.2 | -13.4 |
| 2006 | 15023.2 | 23.4 |
| 2007 | 21689.8 | 78.1 |
| 2008 | 25084.0 | 106.0 |
| 2009 | 22449.2 | 84.4 |
| 2010 | 20892.0 | 71.6 |
| 2011 | 20239.2 | 66.2 |
| 2012 | 20381.5 | 67.4 |
| 2013 | 19715.7 | 61.9 |
| 2014 | 19748.3 | 62.2 |
| 2015 | 20525.2 | 68.6 |
Use the replace-value setting in ChartLab.
replace-value = (value/12175.6-1)*100
Apply an alert-expression to track years by percent deviation from the calculated average value.
Final Year Baseline
To calculate debt growth using FYB, use these queries:
SELECT last(value) AS "Final Year Baseline"
  FROM lithuania
| Final Year Baseline |
|---|
| 20525.2 |
Insert the value into a percent change function.
SELECT date_format(time, 'yyyy') AS "Year", value AS "Debt (Million Euro)", (100*(value/20525.2-1)) AS "Percent Change (FYB)"
  FROM lithuania
GROUP BY datetime, value
  ORDER BY datetime
| Year | Debt (Million Euro) | Percent Change (FYB) |
|---|---|---|
| 1995 | 1632.0 | -92.0 |
| 1996 | 2034.9 | -90.1 |
| 1997 | 2734.3 | -86.7 |
| 1998 | 3306.2 | -83.9 |
| 1999 | 3790.3 | -81.5 |
| 2000 | 4028.1 | -80.4 |
| 2001 | 4162.2 | -79.7 |
| 2002 | 4517.3 | -78.0 |
| 2003 | 5822.8 | -71.6 |
| 2004 | 7372.5 | -64.1 |
| 2005 | 10539.2 | -48.7 |
| 2006 | 15023.2 | -26.8 |
| 2007 | 21689.8 | 5.7 |
| 2008 | 25084.0 | 22.2 |
| 2009 | 22449.2 | 9.4 |
| 2010 | 20892.0 | 1.8 |
| 2011 | 20239.2 | -1.4 |
| 2012 | 20381.5 | -0.7 |
| 2013 | 19715.7 | -3.9 |
| 2014 | 19748.3 | -3.8 |
| 2015 | 20525.2 | 0.0 |
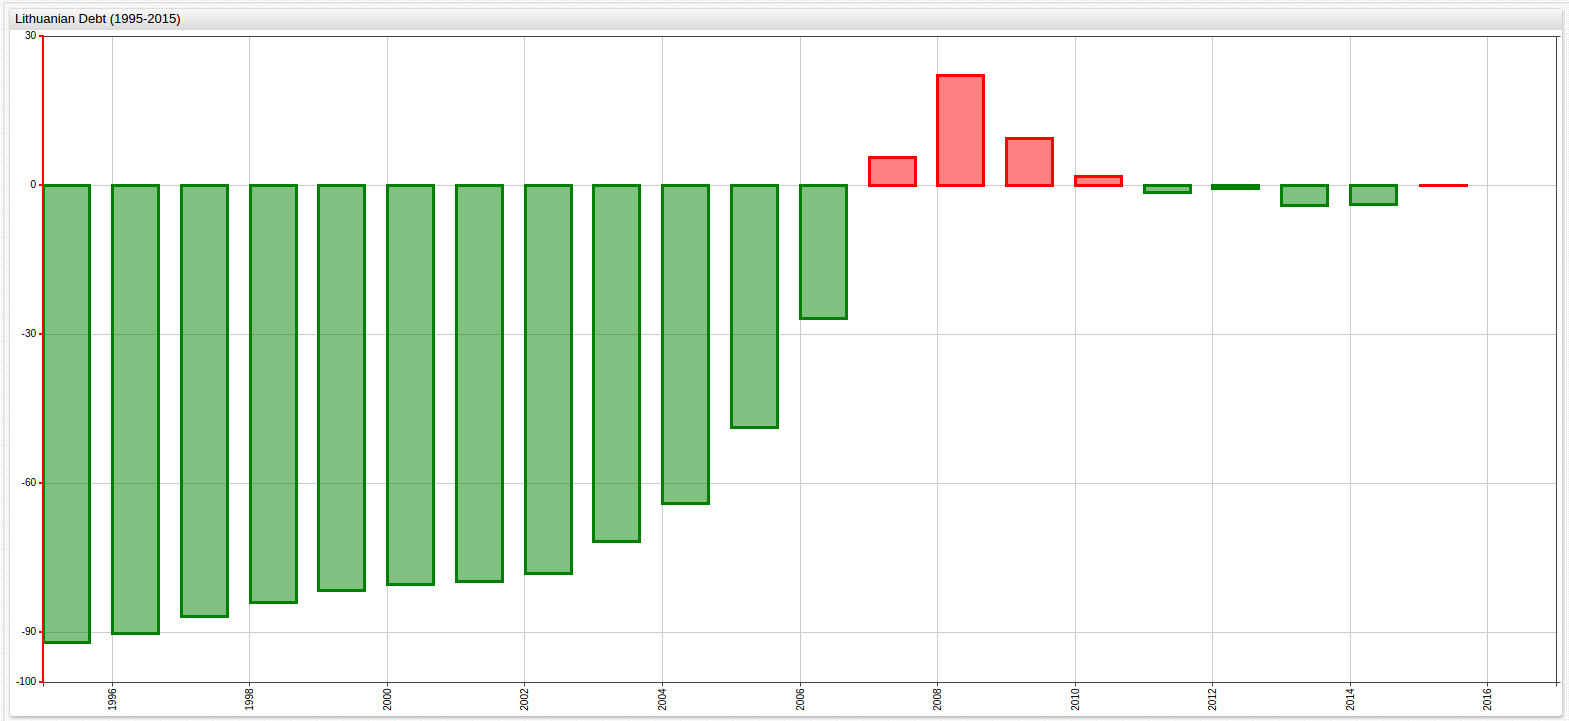
The above graph shows percent deviation for Lithuanian government debt using the final year (2015) as a baseline.