Average by Year for One Metric
Overview
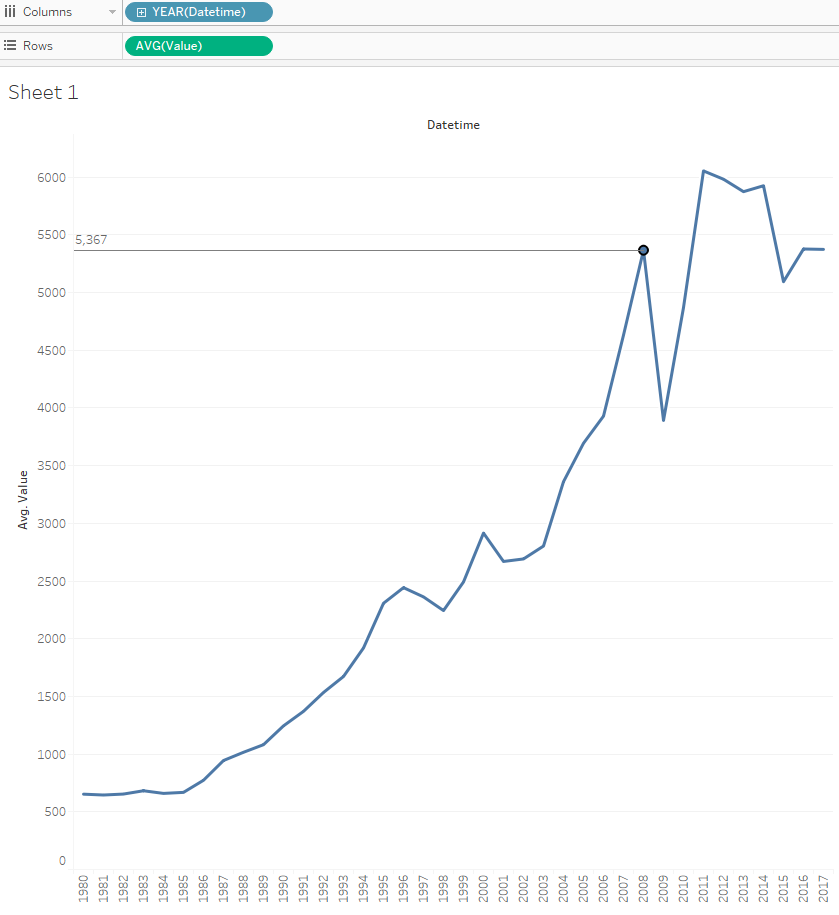
Build a report illustrating average monthly imports each year.
Data Source
- Table:
bi.im_net1.m
Steps
- Drag-and-drop the table to Canvas area
- Click Sheet 1
- Click OK to acknowledge the warning about limitations
- Drag-and-drop
Datetimeonto the columns field. - Drag-and-drop
Valueonto the rows field. - Change value aggregation from SUM to AVG: right-click > Measure > Average
- Select
Linein the drop-down list on Marks Card - Optionally add drop lines
Results