SUM by Year for Two Metrics
Overview
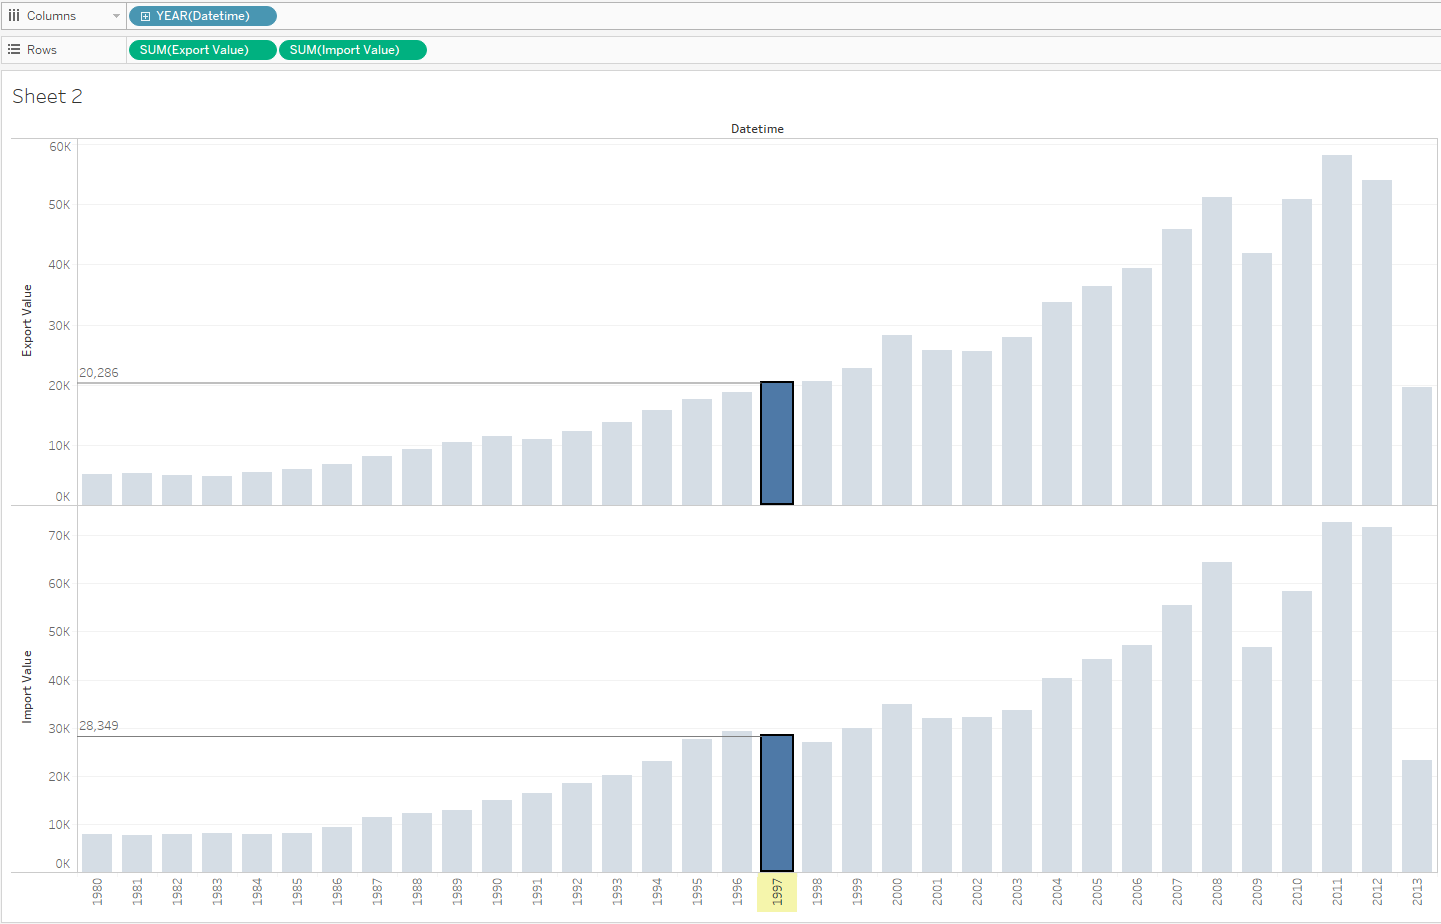
Report showing the differences between two metrics on separate graphs.
Data Source
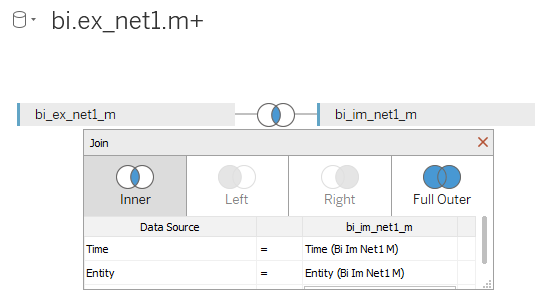
- Tables:
bi.im_net1.mandbi.ex_net1.m.
Steps
- Drag-and-drop both tables to Canvas area.
- Select
Inner Join, specifyTimeandEntityas equal fields:
- Click Sheet 1
- Click OK to acknowledge the warning about limitations.
- Drag-and-drop
Datetimeonto the column field. - Drag-and-drop both
Valueonto the rows field. - Select Bar in the drop-down list in the All section on the Marks Card.
- Optionally add drop lines.
Results