Portal Settings
Reference
Layout
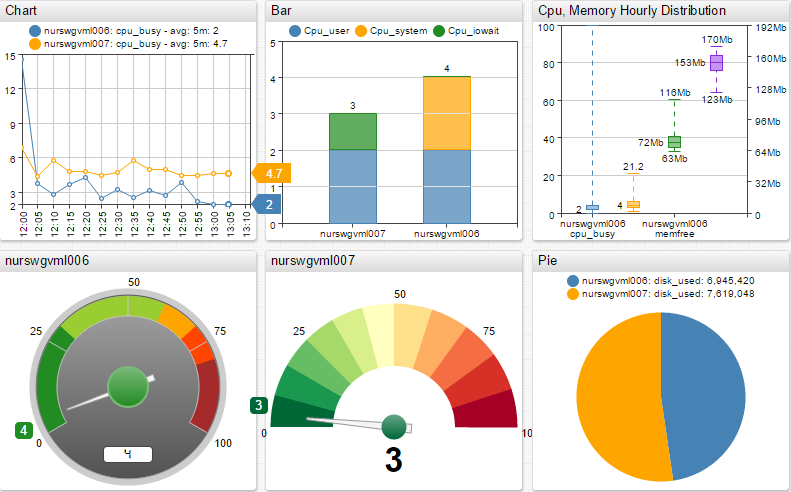
Widgets are positioned on the portal page using a grid layout. The dimensions of the grid are specified under the [configuration] tag.
[configuration]
  width-units = 3
  height-units = 2
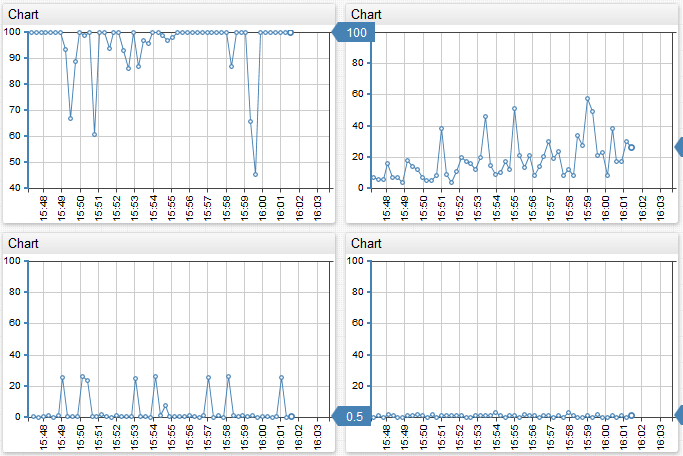
In this example, the page is split into 3 columns and 2 rows.
The default portal grid dimensions are 6×4.
The default widget size is 1×1 which can be adjusted with the width-units and height-units settings in the [widget] section to stretch the widget into multiple columns or rows.
To display multiple widgets on one row, group them using the [group] tag.
[configuration]
  width-units = 3
  height-units = 2

# 1st widget row
[group]
  [widget]
  [widget]
  [widget]

# 2nd widget row
[group]
  [widget]
  [widget]
  [widget]
As an alternative to creating groups for each row, add the widgets-per-row setting under the [group] tag.
[configuration]
  width-units = 3
  height-units = 2

[group]
  widgets-per-row = 3

  [widget]
  [widget]
  [widget]
  [widget]
  [widget]
  [widget]
2x3 Group Layout (per row grouping) 
3x2 Grid Layout (manual grouping) 
[configuration] Section
General Settings
| Name | Example | Description | ChartLab |
|---|---|---|---|
title | title = CPU Busy Portal | Portal name. | |
dialog-maximize | dialog-maximize = true | If enabled, the dialog window is expanded to the entire portal page. Dialog window can be opened by clicking on the widget header. Default: true. | View |
display-panels | display-panels = true | Display widget controls. Allowed values: true, false, hover. | View |
expand-panels | expand-panels = compact | Expand widget controls. Allowed values: all, compact, none. | View |
periods | periods = 20 minute, 4 hour | Add custom periods to aggregation controls in the top-right corner of the widget. | View |
buttons | buttons = update | Add buttons to the widget header. The buttons are visible on mouse-over. Allowed values: update, reset.update stops/resumes the loading of new data into the widget.reset is supported only in the table widget. The parameter resets column sorting to the initial order. | View |
Interval Settings
| Name | Example | Description | ChartLab |
|---|---|---|---|
timespan | timespan = 2 hour | Specifies the timespan for which the data is loaded for all widgets by default. The setting can be overridden by each widget separately. | View |
start-time | start-time = 2017-04-01T10:15:00Z | Specifies the date and time in local or ISO format from which the values for the series are loaded. The setting can be overridden by each widget separately. Note that start-time is inclusive and end-time is exclusive.This means that start-time = 2017-09-14 10:00:00 includes data points that occurred exactly at 10:00:00 and later whereas end-time = 2017-09-14 11:00:00 includes data points that occurred up to 10:59:59, excluding points that occurred at 11:00:00.The setting supports calendar keywords. | View |
end-time | end-time = previous_working_day | Specifies the date and time in local or ISO format until which the values for the series are loaded. The setting can be overridden by each widget separately. Note that start-time is inclusive and end-time is exclusive.This means that start-time = 2017-09-14 10:00:00 includes data points that occurred exactly at 10:00:00 and later whereas end-time = 2017-09-14 11:00:00 includes data points that occurred up to 10:59:59, excluding points that occurred at 11:00:00.The setting supports calendar keywords. | View |
timezone | timezone = UTC | Set the time zone for the data being loaded into the portal. Only the UTC option is supported. If UTC is not set, the portal displays dates in the local time zone. If UTC is set, start-time and end-time settings specified in local format are evaluated based on the UTC time zone. | View |
- Supported
datetimeformats:- ISO format in UTC time zone:
yyyy-MM-ddTHH:mm:ss[.S]Z, for example:2017-07-01T00:00:00Z - Local format:
yyyy-MM-dd[ HH:mm:ss[.S]], for example:2017-07-01 00:00:00.015,2017-07-01 00:00:00, and2017-07-01
- ISO format in UTC time zone:
Layout Settings
| Name | Example | Description | ChartLab |
|---|---|---|---|
width-units | width-units = 2 | Number of columns in the portal. Default: 6. | View |
height-units | height-units = 2 | Number of rows in the portal. Default: 4. | View |
offset-right | offset-right = 50 | Offset from the right border, in pixels.offset- can be used with: top, right, bottom, left. | View |
widgets-per-row | widgets-per-row = 3 | Maximum number of widgets in the [group] section. If the value is exceeded, additional widgets are automatically placed into a new row. | View |
Connection Settings
| Name | Example | Description | ChartLab |
|---|---|---|---|
url | url = http://atsd_hostname:port | URL of the ATSD server. The setting is necessary if the data is loaded from an ATSD server running on a different host. | |
context-path | context-path = api/v2 | Context path. Default value is api/v1. | |
method-path | method-path = /series/query | Data API method path. Default value is specific for each data type: /series/query, /properties/query, /messages/query, /alerts/query. | |
url-parameters | url-parameters = db=12&adapter=7 | Optional request parameters included in data API requests. Parameter names and values must be URL-encoded if necessary and separated by ampersand. ? at the start of the query string is optional. | |
update-interval | update-interval = 5 minute | Polling interval at which new incremental data is requested from the server by widgets on the portal. For example update-interval = 5 minute.The default value is 1 minute. The setting can be overridden by each widget separately. Chart updates are disabled if the endtime parameter for the portal or the widget is set to a fixed date, for example: endtime = 2016-06-27T00:00:00Z. | View |
batch-update | batch-update = true | Sending data queries to the server in batches with size specified in batch-size settingDefault: false.If enabled, series for which the request has failed are requested separately from successfully updated series. | View |
batch-size | batch-size = 1 | Maximum number of series in one batch request to the server. Default: 8.If 0 is specified, the limit is not set.Applies when batch-update = true. | View |
The actual URL for data requests is assembled from
{url}{context-path}{method-path}{url-parameters}. For example, the default URL for loading series data ishttps://atsd_hostname:8443/api/v1/series/query.
Comments
Comments allow you annotate and describe the settings. Comment text is ignored when the configuration is parsed and evaluated.
Single-line Comments
A single line comment starts with #. Text after the # is ignored.
[widget]
  type = chart
  # Metric field is inherited by all series in the widget
  metric = nmon.cpu_total.busy%
A hash symbol in the middle of a line, preceded by any character other than tab or space, is escaped and treated as regular text.
[widget]
  type = chart
  # Next line does not contain any comments because hash is preceded by characters other than tab or space.
  title = Hello # World
Multi-line Comments
Multi-line comments begin with /* and end with */.
Any text between /* and */ is ignored.
[widget]
  type = chart
  /*
     This widget provides information on CPU
     utilization measured in percent of available capacity.
  */
  metric = nmon.cpu_total.busy%
Placeholders
You can insert placeholders into the configuration text to populate it with values of the request parameters. Placeholders have the {placeholderName} format. The value of the placeholder is parsed from the query string from any parameter starting with p_, for example p_placeholderName.
[series]
  entity = {id}
  metric = cpu_busy
Invoked with ?p_id=nurswgvml002, the above configuration is converted into the following text:
[series]
  entity = nurswgvml002
  metric = cpu_busy
Freemarker Expressions
Refer to Freemarker expressions in ATSD portals.
