SQL Query Performance
Overview
Monitoring query execution is an important administrative task to optimize database performance, to identify and prevent expensive and long-running queries, and to provide feedback to end-users and application developers.
Query Reporting
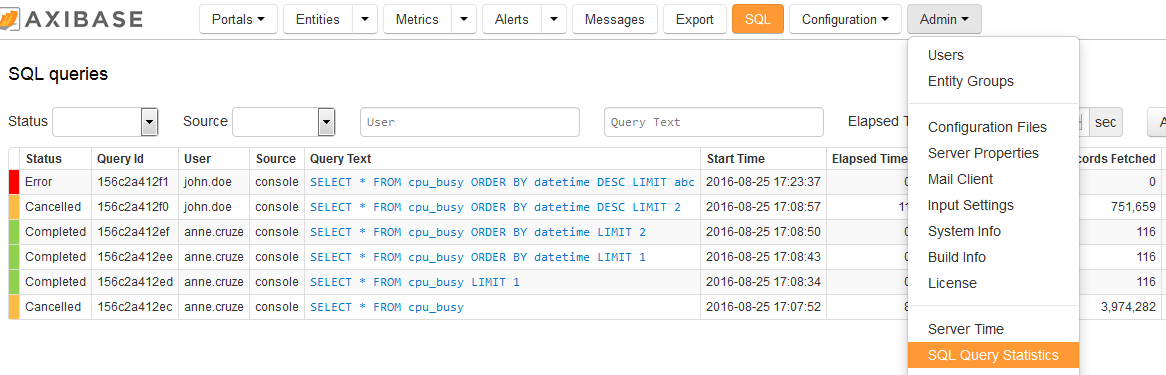
The database keeps track of query executions including detailed statistics in an in-memory structure. The list of running and completed queries is available on the SQL Query Statistics page.
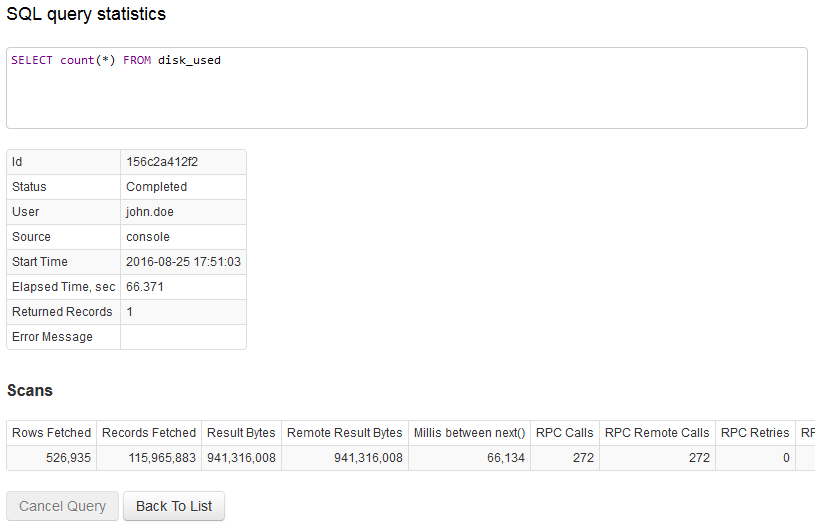
The list can be filtered by user, source, status, query part, and elapsed time. Additional information about the query is displayed on the Query Plan page.
Users with an ADMIN role are authorized to view and cancel all queries whereas non-administrative users are restricted to viewing and cancelling their own queries.
Query Detail Fields:
| Name | Description |
|---|---|
Status | New, Running, Completed, Error, Cancelled. |
Source | api, console, scheduled. |
User | Name of the user who initiated the query. For API clients, username specified in login credentials. |
Query Id | Unique query identifier. |
Query Text | Query statement text. |
Start Time | Query start time. |
Elapsed Time | Time elapsed between start time and completion (or current) time. |
Returned Records | Number of rows returned to the client. |
Records Fetched | Number of time:value pairs. |
Rows Fetched | Number of HBase rows. |
Result Bytes | Number of bytes in Result objects from HBase region servers. |
Remote Result Bytes | Number of bytes in Result objects from remote region servers. |
Millis between next() | Total number of milliseconds spent between sequential scan.next() calls. |
RPC Calls | Number of RPC calls. |
RPC Remote Calls | Number of remote RPC calls. |
RPC Retries | Number of RPC retries. |
RPC Remote Retries | Number of remote RPC retries. |
Regions Scanned | Number of regions scanned. |
Regions Not Serving | Number of NotServingRegionException instances caught. |
Cancelling Queries
A running query can be cancelled at any time, for example if its execution time is longer than expected.
When a query is cancelled, the results are not returned to the client and the query is stopped with an error.
A query submitted via the /api/sql endpoint can be cancelled by submitting a request to /api/sql/cancel?queryId={query-id} URL and referencing the user-defined handle with the {query-id} parameter.
Query Logging
Queries executed by the database are recorded in the main application log atsd.log at the INFO level.
Each query is assigned a unique identifier for correlating starting and closing events.
2017-08-15 18:44:01,183;INFO;qtp1878912978-182;com.axibase.tsd.service.sql.SqlQueryServiceImpl;Starting sql query execution. [uid=218], user: user003, source: scheduled, sql: SELECT entity, AVG(value) AS "Average", median(value), MAX(value), count(*),
   percentile(50, value), percentile(75, value), percentile(90, value),  percentile(99, value) FROM "mpstat.cpu_busy"
  WHERE time BETWEEN PREVIOUS_DAY and CURRENT_DAY GROUP BY entity ORDER BY AVG(value) DESC

2017-08-15 18:44:02,369;INFO;qtp1878912978-182;com.axibase.tsd.service.sql.SqlQueryServiceImpl;Sql query execution took 1.19 s, rows returned 7. [uid=218], user: user003, sql: SELECT entity, AVG(value) AS "Average", median(value), MAX(value), count(*),
   percentile(50, value), percentile(75, value), percentile(90, value),  percentile(99, value) FROM "mpstat.cpu_busy"
  WHERE time BETWEEN PREVIOUS_DAY and CURRENT_DAY GROUP BY entity ORDER BY AVG(value) DESC
Query Control Messages
Execution events are also stored as messages with type=sql and source=api|console|scheduled for monitoring query performance using the Rule Engine.
The following message tags are available for filtering and grouping:
| Name | Description |
|---|---|
uid | Unique query id which is reset on application restart. |
format | Result set format: CSV, JSON, HTML. |
user | User initiating the query. |
query | Query text. |
Note
Messages for scheduled queries include additional tags query_name, query_id, output_path, email_subject, and email_subscribers.
Query Performance
The most efficient query path is metric+entity+date+tags.
Query execution speed can be improved by adopting the following guidelines for the WHERE clause:
- Specify start time and end time whenever possible to limit the time range.
- Specify entity name whenever possible to narrow the range of rows scanned.
Query Optimization
Consider the following recommendations when developing queries:
- Pre-test queries on a smaller dataset in an ATSD development instance.
- Avoid queries without any conditions. Apply
LIMITto reduce the number of rows returned. - Add the
WHEREclause. Include as many conditions to theWHEREclause as possible, in particular add entity and interval conditions. - Make
WHEREconditions narrow and specific, for example, specify a small time interval. - Avoid the
ORDER BYclause since it can cause a full scan and a copy of data to a temporary table. - Add the
LIMIT 1clause to reduce the number of rows returned. Note thatLIMITdoes not prevent expensive queries withORDER BYandGROUP BYclauses becauseLIMITis applied to final results and not to the number of rows read from the database. - Develop a simple query first. Adjust conditions gradually as you inspect the results. Add grouping, partitioning, and ordering to finalize the query.
Optimizing Interval Queries
Using the date_format and EXTRACT functions in the WHERE condition and the GROUP BY clause is not efficient as it causes the database to perform a full scan while comparing literal strings or numbers.
Instead, filter dates using the indexed time or datetime column and apply the PERIOD function to aggregate records by interval.
- Slow full scan with string or number comparison.
WHERE date_format(time, 'yyyy') > '2018'
WHERE YEAR(time) > 2018
- Fast date range scan using an indexed column.
WHERE datetime >= '2018'
WHERE datetime >= '2018-01-01T00:00:00Z'
- Slow
GROUP BY date_format(time, 'yyyy')
GROUP BY YEAR(time)
- Fast
GROUP BY PERIOD(1 YEAR)
Exploring Data
To assist in inspecting query results by selecting a subset of rows from large series, the following queries have been locally optimized to provide improved performance with LIMIT 1 clause:
Ascending order:
SELECT * FROM "mpstat.cpu_busy" LIMIT 1
SELECT * FROM "mpstat.cpu_busy" ORDER BY datetime LIMIT 1
SELECT * FROM "mpstat.cpu_busy"
  WHERE entity = 'nurswgvml007' ORDER BY datetime LIMIT 1
Descending order:
SELECT * FROM "mpstat.cpu_busy" ORDER BY time DESC LIMIT 1
SELECT * FROM "mpstat.cpu_busy" ORDER BY datetime DESC LIMIT 1
SELECT * FROM "mpstat.cpu_busy"
  WHERE datetime >= CURRENT_DAY ORDER BY time DESC LIMIT 1
SELECT * FROM "mpstat.cpu_busy"
  WHERE entity = 'nurswgvml007' ORDER BY datetime DESC LIMIT 1