Integrating ATSD with Google cAdvisor
Axibase Time Series Database (ATSD) provides a native storage driver to collect Docker container metrics from Google cAdvisor for long-term retention, alerting, and visualization.
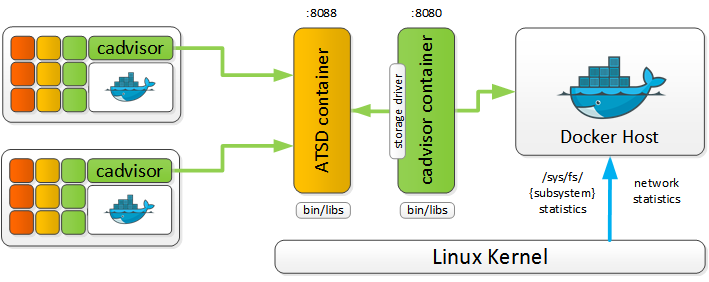
Google cAdvisor is a lightweight containerized application, written in golang, that reads CPU, memory, network and disk I/O counters from the Linux operating system and makes the counters available for real-time viewing using the built-in web interface. cAdvisor can be optionally configured to persist counters in one or multiple storage systems.
Both ATSD and cAdvisor are available as Docker containers.
Installation Steps
Deployment Modes
Single Host
ATSD and Google cAdvisor containers can be launched on the same server to collect metrics from the underlying Docker host.
Multiple Hosts
To consolidate metrics from multiple Docker hosts, configure cAdvisor containers to send data to a centralized ATSD instance. This deployment mode enables centralized performance and availability monitoring.
Launch ATSD Container
docker run \
  -d \
  -p 8088:8088 \
  -p 8081:8081 \
  -p 8443:8443 \
  -p 8082:8082/udp \
  -h atsd \
  --name=atsd \
  axibase/atsd
Watch for ATSD start completed message in the start.log.
docker logs -f atsd
For more options, refer to ATSD Docker installation instructions.
The ATSD web interface is accessible on port 8443.
Launch cAdvisor Containers
Launch cAdvisor containers on the monitored Docker hosts to send data into the target ATSD server.
Replace {ATSD_HOSTNAME} placeholder in the command below with the hostname of the ATSD server.
docker run \
  --volume=/:/rootfs:ro \
  --volume=/var/run:/var/run:rw \
  --volume=/sys:/sys:ro \
  --volume=/var/lib/docker/:/var/lib/docker:ro \
  --publish=8080:8080 \
  --detach=true \
  --name=cadvisor \
  axibase/cadvisor:latest \
  --storage_driver=atsd \
  --storage_driver_atsd_protocol=tcp \
  --storage_driver_host={ATSD_HOSTNAME} \
  --storage_driver_buffer_duration=15s \
  --housekeeping_interval=15s
The
axibase/cadvisorimage is a modified version of thegoogle/cadvisorimage that includes the ATSD storage driver.
Change Protocol
By default, the data is transmitted into ATSD over the TCP protocol on port 8081. If necessary, modify the launch command to send data over HTTP or HTTPS protocol.
Linked Containers
In case of a single-host installation, add --link variable and replace {ATSD_HOSTNAME} placeholder with atsd in the above command as follows:
docker run \
  ...
  --link atsd:atsd \
  --name=cadvisor \
  axibase/cadvisor:latest \
...
  --storage_driver_host=atsd \
Verify Integration
- Log in to ATSD web interface at
https://atsd_hostname:8443. - Open the Metrics tab in the main menu and search for metrics that start with
cadvisor. - Open the Entities tab in the main menu.
- Select
cadvisor-hostsin Entity-Group drop-down list. - Click Portal icons to view the build-in cAdvisor portals.
Disk metrics are only collected from containers with attached volumes.
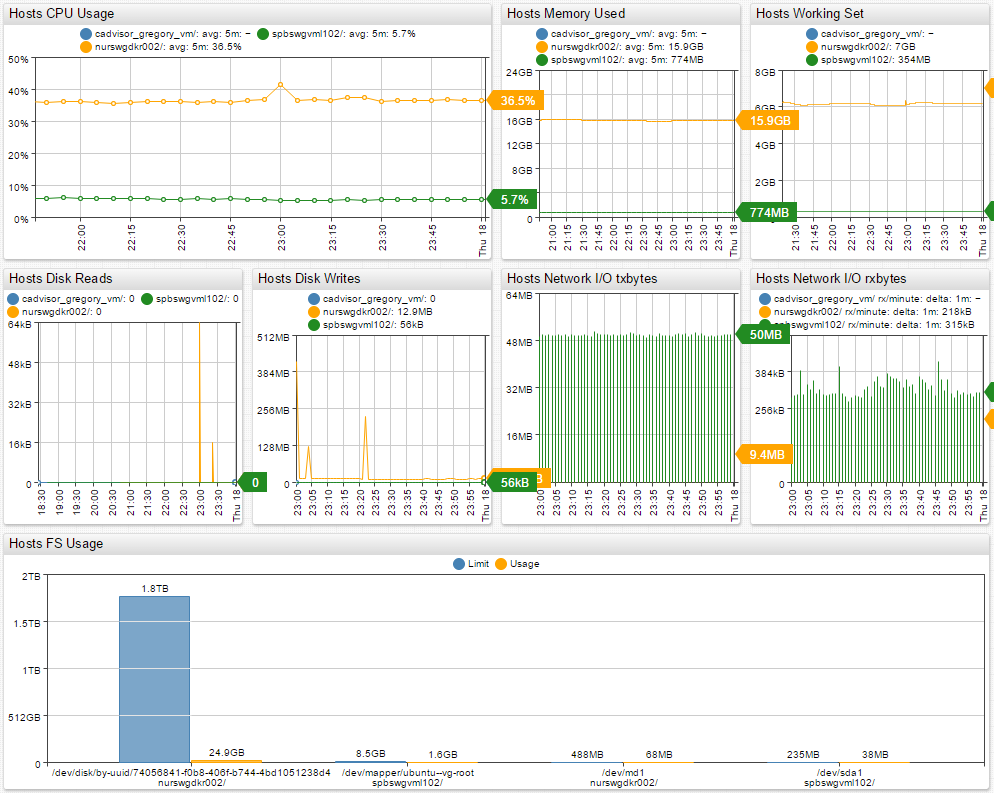
Built-in Portals
cAdvisor Disk Detail Portal  |
|---|
 |
| cAdvisor Overview Portal |
|---|
 |
| cAdvisor Host Portal |
|---|
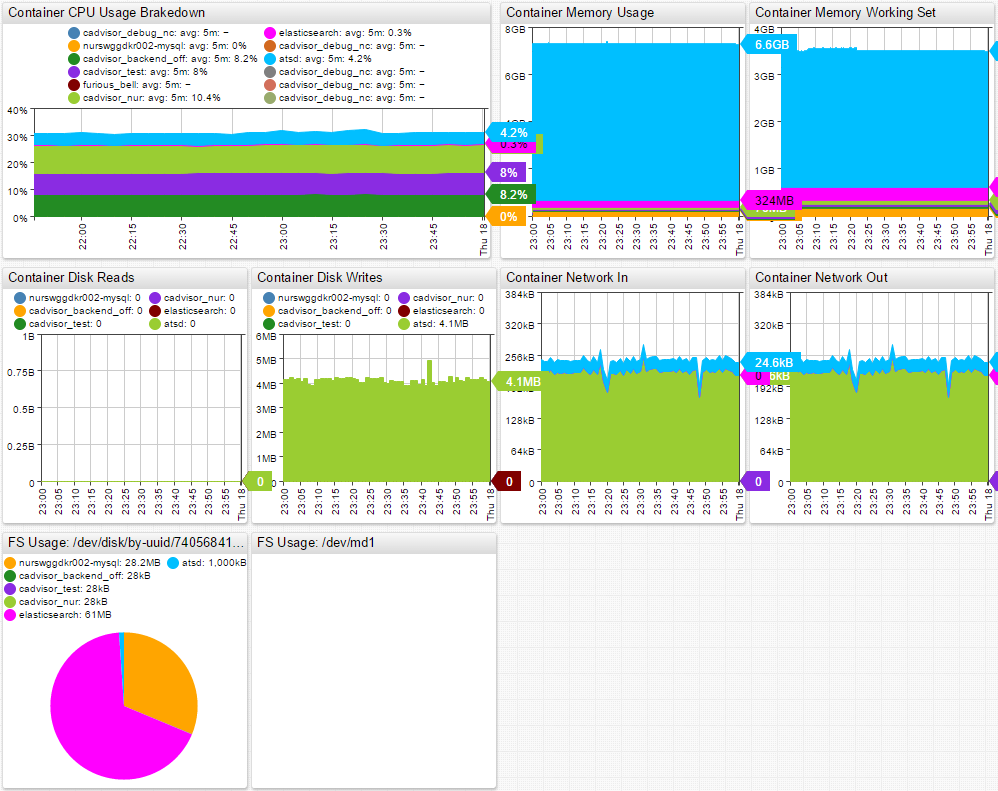 |
| cAdvisor Multi-Host Portal |
|---|
 |
Storage Driver Options
| Option | Default Value | Description |
|---|---|---|
storage_driver_atsd_protocol | tcp | Transfer protocol. Supported protocols: HTTP, HTTPS, UDP, TCP |
storage_driver_atsd_skip_verify | false | Disables ATSD SSL certificate check |
storage_driver_atsd_store_major_numbers | false | Include statistics for devices with all available major numbers |
storage_driver_atsd_property_interval | 1m | Container property (host, id, namespace) update interval. Must be >= housekeeping_interval |
storage_driver_atsd_sampling_interval | housekeeping_interval value | Series sampling interval. Must be >= housekeeping_interval |
storage_driver_atsd_docker_host | Output of /rootfs/etc/hostname or "" | Hostname of the docker host, used as entity prefix in ATSD. |
storage_driver_atsd_store_user_cgroups | false | Include statistics for user cgroups, for example: docker-host/user.* |
storage_driver_buffer_duration | 1m | Interval for which data is buffered before being sent into ATSD |
storage_driver_atsd_buffer_limit | 1000000 | Maximum command count in buffer before being sent into ATSD |
storage_driver_atsd_sender_thread_limit | 4 | Maximum thread goroutine count when sending data into ATSD via tcp/udp |
Quick Start
To quickly start both ATSD and cAdvisor on the same Docker host, use the docker-compose.yml file.
Download the docker-compose.yml file to start ATSD and cAdvisor containers as a bundled service.
curl https://raw.githubusercontent.com/axibase/atsd-use-cases/master/integrations/cadvisor/docker-compose.yml \
  -o docker-compose.yml
Start containers.
docker-compose up -d
Check output to ensure that containers are created.
Creating atsd ... done
Creating cadvisor ... done
Collected cAdvisor Metrics
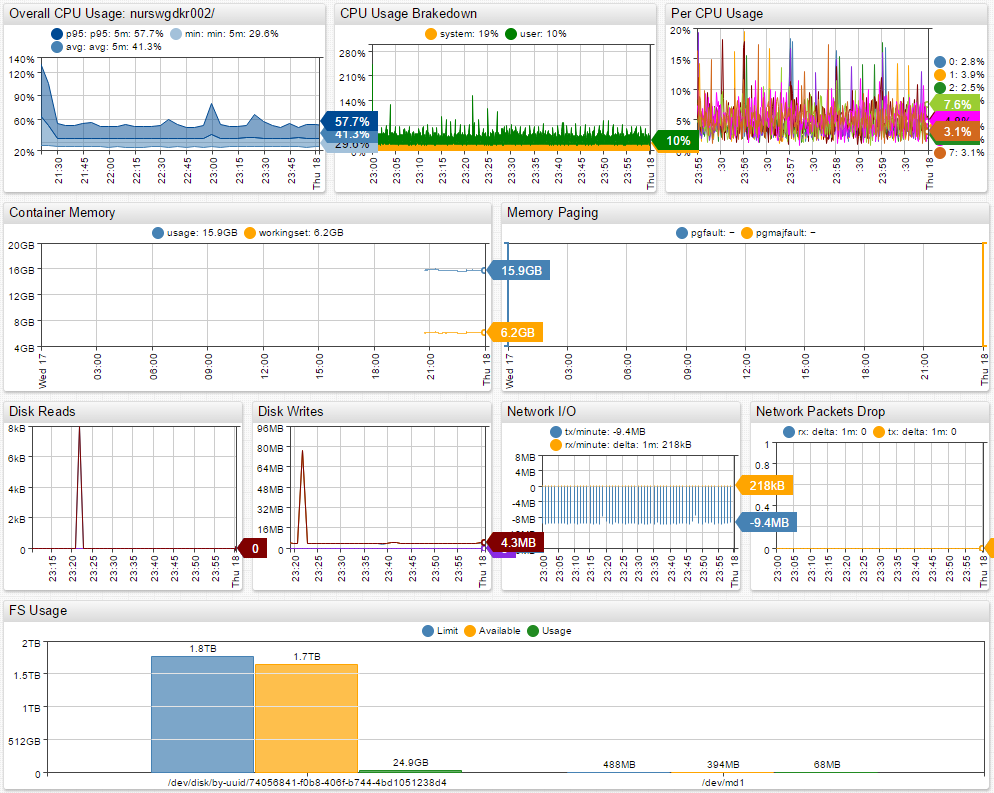
CPU Metrics
CPU metrics from cpuacct controller. CPU usages is generated by the processes of the container, broken down between user and system time. User is the time during which the processes are in direct control of the CPU, and system is the time during which the CPU executed system calls on behalf of those processes. Those times are expressed in ticks of 1/100th of a second.
cpu.loadaverage
cpu.loadaverage%
cpu.usage.percpu
cpu.usage.percpu%
cpu.usage.system
cpu.usage.system%
cpu.usage.total
cpu.usage.total%
cpu.usage.user
cpu.usage.user%
cpu.host.usage.system%
cpu.host.usage.total%
cpu.host.usage.user%
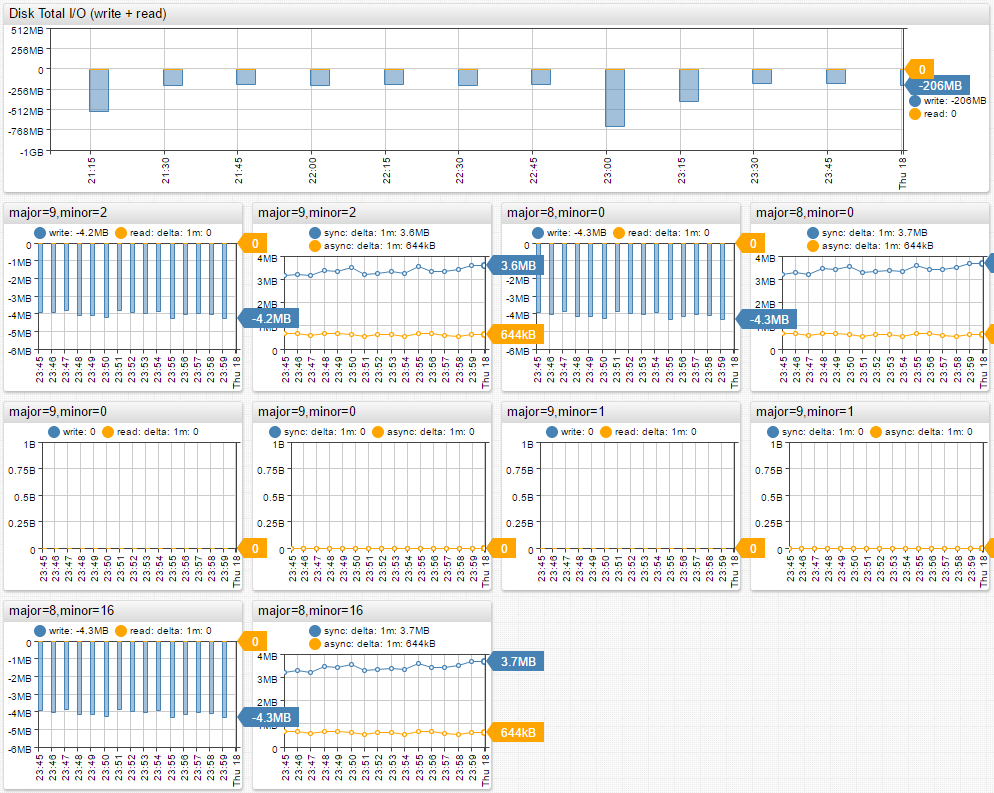
I/O Metrics
I/O is accounted in the blkio controller.
io_service_bytes – indicates the number of bytes read and written by the cgroup. It has 4 counters per device, because for each device, it differentiates between synchronous vs. asynchronous I/O, and reads vs. writes.
io_serviced – the number of I/O operations performed, regardless of their size. It also has 4 counters per device.
diskio.ioservicebytes.async
diskio.ioservicebytes.read
diskio.ioservicebytes.sync
diskio.ioservicebytes.total
diskio.ioservicebytes.write
diskio.ioserviced.async
diskio.ioserviced.read
diskio.ioserviced.sync
diskio.ioserviced.total
diskio.ioserviced.write
Memory Metrics
Memory metrics are found in the “memory” cgroup.
pgfault and pgmajfault – indicate the number of times that a process of the cgroup triggered a page fault and a major fault. A page fault happens when a process accesses a part of its virtual memory space which is nonexistent or protected.
memory.usage – the amount of all used memory, regardless of access time.
memory.usage – the amount of memory that a processes require in a given time interval. This includes recently accessed memory, dirty memory and kernel memory.
memory.containerdata.pgfault
memory.containerdata.pgmajfault
memory.hierarchicaldata.pgfault
memory.hierarchicaldata.pgmajfault
memory.usage
memory.workingset
cadvisor.memory.cache
cadvisor.memory.rss
Network Metrics
Network metrics track the about of packets received/sent, amount of traffic in bytes, dropped packets and errors.
network.rxbytes – cumulative count of bytes received.
network.rxpackets – cumulative count of packets received.
network.rxerrors – cumulative count of receive errors encountered.
network.rxdropped – cumulative count of packets dropped while receiving.
network.txbytes – cumulative count of bytes transmitted.
network.txpackets – cumulative count of packets transmitted.
network.txerrors – cumulative count of transmit errors encountered.
network.txdropped – Cumulative count of packets dropped while transmitting.
Task Metrics
taskstats.nriowait – number of tasks waiting on I/O.
taskstats.nrrunning – number of running tasks.
taskstats.nrsleeping – number of sleeping tasks.
taskstats.nrstopped – number of tasks in stopped state.
taskstats.nruninterruptible – number of tasks in uninterruptible state.
File System Metrics
File system metrics track the read and write processes for attached file systems.
filesystem.available
filesystem.ioinprogress
filesystem.iotime
filesystem.limit
filesystem.readscompleted
filesystem.readsmerged
filesystem.readtime
filesystem.sectorsread
filesystem.sectorswritten
filesystem.usage
filesystem.weightediotime
filesystem.writescompleted
filesystem.writesmerged
filesystem.writetime
cadvisor.filesystem.baseusage
cadvisor.filesystem.inodesfree
disk metrics and file system metrics are only collected from containers that have attached volumes.