Zookeeper Integration
This guide describes how to monitor availability and performance of an Apache Zookeeper cluster (3 nodes) using Axibase Time Series Database (ATSD).
Step 1: Configure Axibase Collector
Create hosts list
Log in to Axibase Collector at
https://collector_hostname:9443Open the Collections drop-down list in the top menu and select Item Lists.
Click Add and create an item list with Zookeeper hosts.
Enter the name zookeeper-jmx-hosts, choose type TEXT and add comma-separated addresses of Zookeeper hosts in the following format:
#host,port,username,password,entity,cluster
host1.com,9010,user,pass,prod-zoo-host1,prod
host2.com,9010,user,pass,prod-zoo-host2,prod
host3.com,9010,user,pass,prod-zoo-host3,prod
- host: Zookeeper hostname.
- port: JMX port.
- username: JMX user name.
- password: Password for JMX user.
- entity: ATSD entity for Zookeeper node.
- cluster: ATSD series tag for indicating that nodes are in the same cluster.
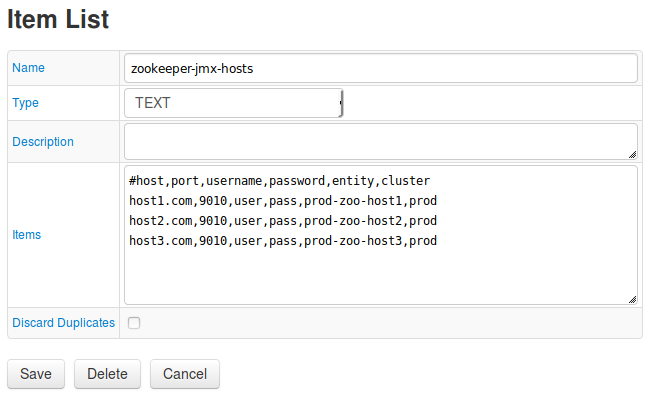
Click Save.
Import Job
Open the Jobspage. Expand the split-button below the table and select Import.
Import the zookeeper-jmx job.
Locate the zookeeper-jmx job in the Jobs list.
Adjust the cron expression if required. For more information on cron expressions, see Scheduling.
Select a target ATSD database for storing data.
Click Save.
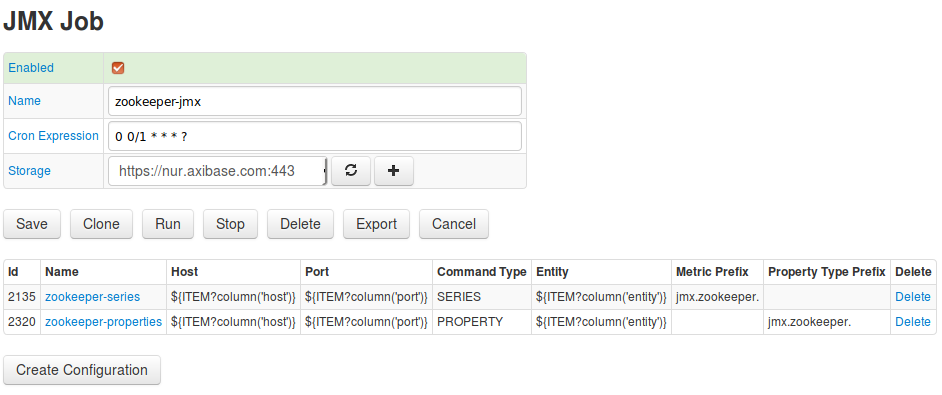
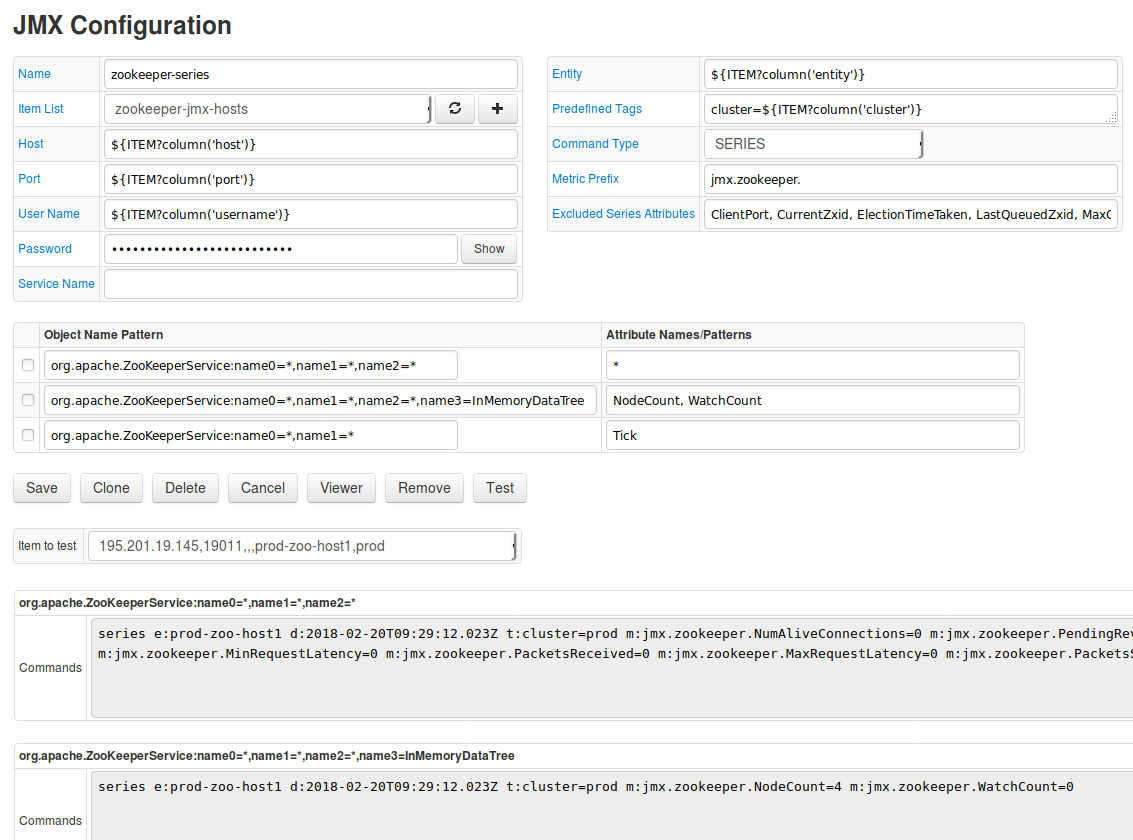
Test job configurations. Open zookeeper-series by clicking the link in Name column on the Jobs page.
If needed, change default parameters. For more information on JMX configuration, see JMX Job Documentation. Click Test.
Repeat test for zookeeper-properties.
On the JMX Job page set the Enabled checkbox and save the job.
Check data collection
Log in to the target ATSD instance at https://atsd_hostname:8443.
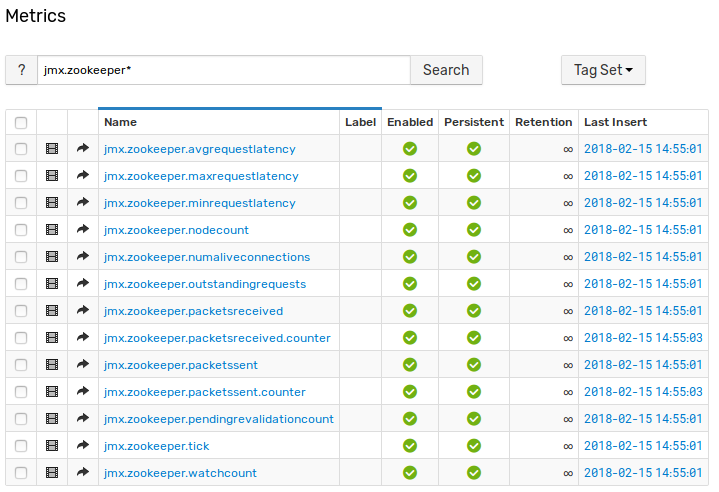
Open the Metrics tab and verify that jmx.zookeeper.* metrics are available.
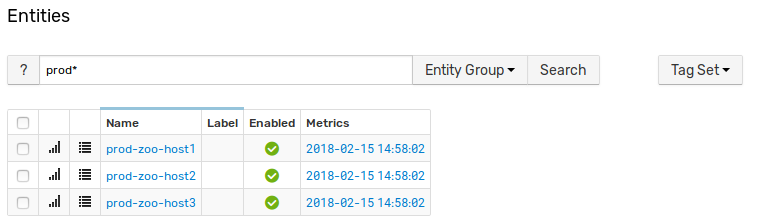
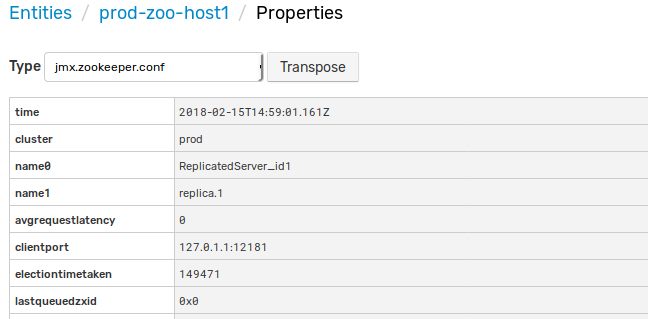
- Open the Entities tab and verify that
jmx.zookeeper.*properties are available for entities fromzookeeper-propertiesconfiguration.
Step 2: Configure Zookeeper in ATSD
Import entity group
- Open the Settings menu, select Entity Groups and import the entity group configuration file.
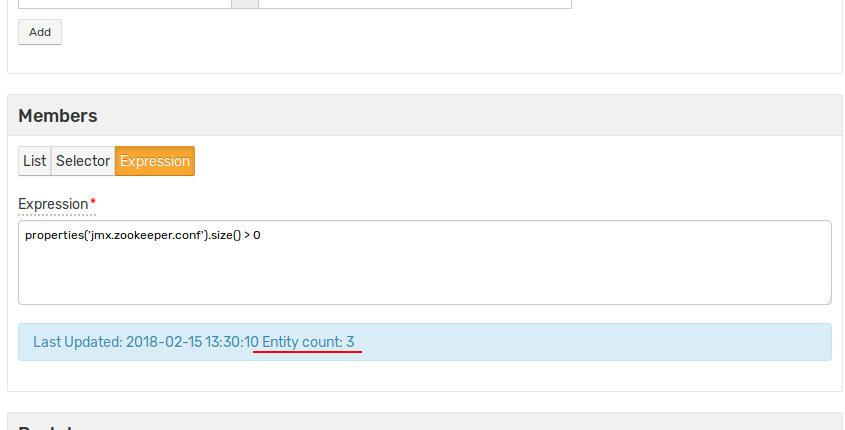
- Locate Zookeeper Nodes group and open the group by clicking the link in the Name column.
- Confirm that the database successfully imported the entities.
Import portals
- Open the Portals menu, select Configure and import portals (Enable the Auto-enable New Portals checkbox).
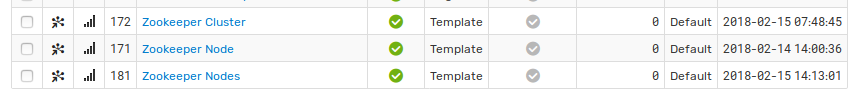
- Verify that new portals are displayed by opening the Portals menu and searching for the newly-configured portal named Zookeeper Cluster.
Import rules
Open the Alerts menu, select Rules and import rules (Enable the Auto-enable New Rules checkbox).
Confirm the database imported the rules.
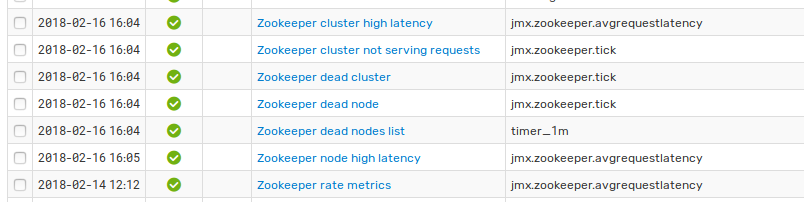
- Zookeeper cluster high latency: alert opens when more than 50% of the nodes in a cluster have average latency greater than 100 ms in 3 minutes.
- Zookeeper cluster not serving requests: alert opens when node status is
leaderelection, which means that nodes cannot choose leader. - Zookeeper dead cluster: opens when no data is collected from cluster in two minutes.
- Zookeeper dead node: opens when no data is collected from a single node in two minutes.
- Zookeeper dead nodes list: same as single dead node, but checks all nodes by timer.
- Zookeeper node high latency: opens when node average latency is above 100 in three consecutive measurements.
- Zookeeper rate metrics: always open. Used for transform
packetsreceivedandpacketssentmetrics from cumulative to difference (packets per minute) metrics. Uses derived commands.
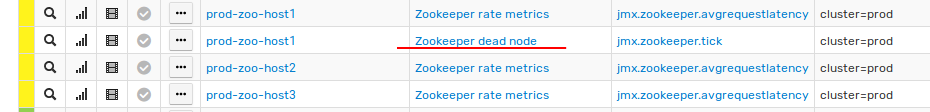
Verify rule functionality. Stop one node and check that Zookeeper dead node and Zookeeper dead nodes list rule opens (allow up to two minutes). Open the Alerts menu and select Open Alerts to view all open rules.
To check Zookeeper cluster not serving requests rule stop more than 50% of all active nodes (in this case two of three, if Zookeeper quorum is default).
To check Zookeeper dead cluster stop all nodes.
To check Zookeeper cluster high latency send large latency values from the Data > Data Entry page. For example:
series e:prod-zoo-host1 m:jmx.zookeeper.avgrequestlatency=1400 t:cluster=prod
series e:prod-zoo-host2 m:jmx.zookeeper.avgrequestlatency=1500 t:cluster=prod
To check Zookeeper node high latency send large latency for single node three times using Data Entry
series e:prod-zoo-host1 m:jmx.zookeeper.avgrequestlatency=1400 t:cluster=prod
To check Zookeeper rate metrics open the Metrics tab and verify that metrics jmx.zookeeper.packetsreceived.counter and jmx.zookeeper.packetssent.counter are collecting.
For more information about the Rule Engine, see ATSD Rule Engine Documentation.
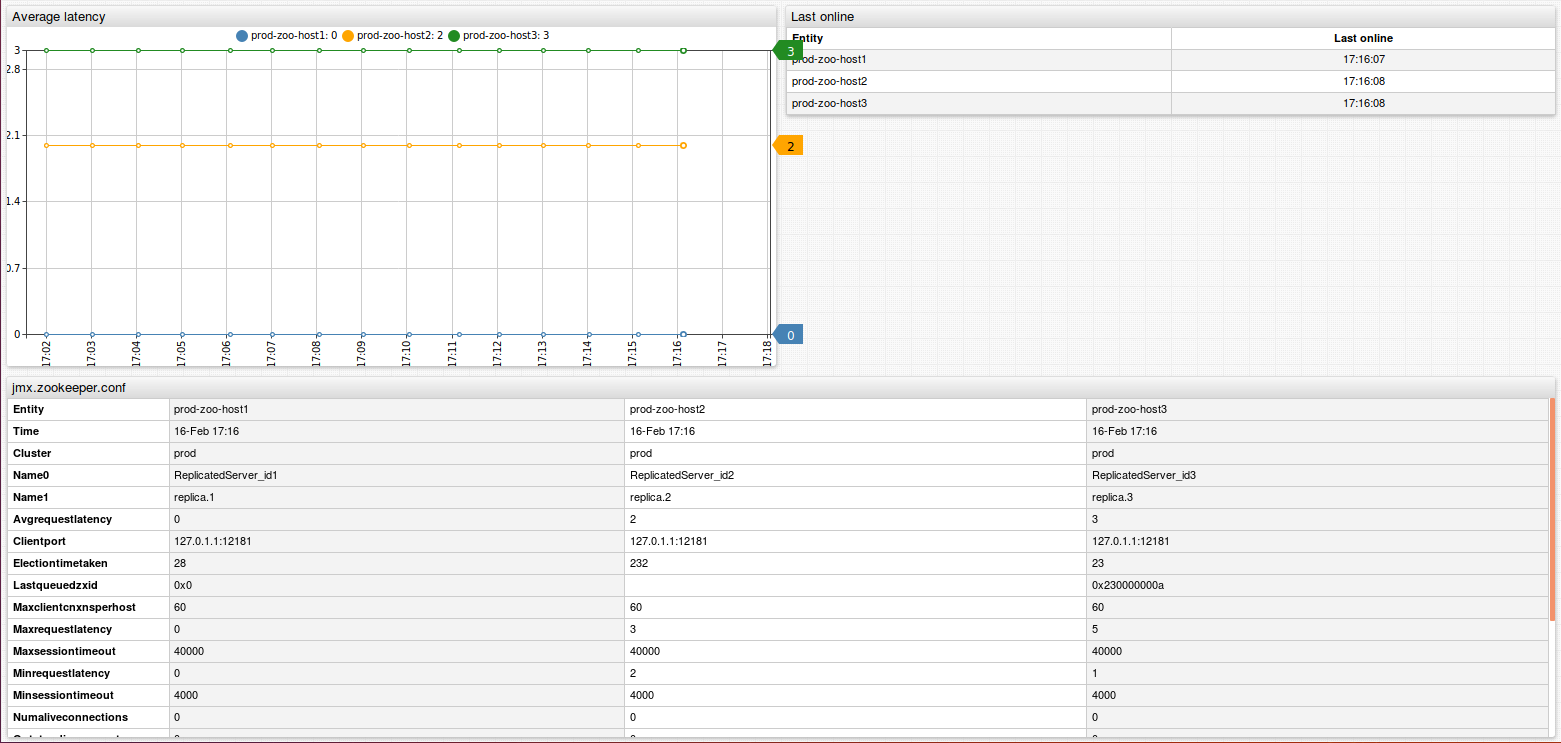
Import entity view
Open the Entity Views menu, select Configure and import the following entity view. Check entity view. Open the Entity Views menu and ensure you see Zookeeper entity view.
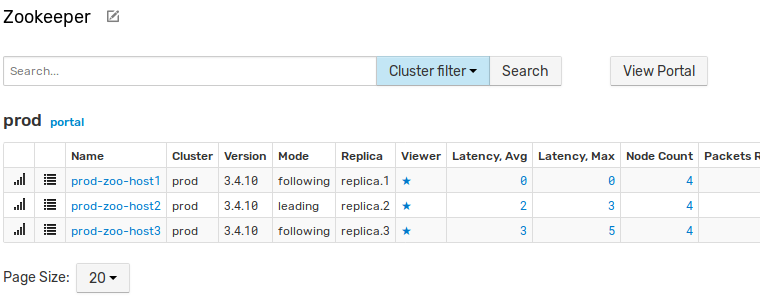
Click the Portal icon and check cluster portal.