How to Monitor Marathon Applications as Services
Overview
Marathon is a framework for automating the deployment of Linux containers on top of clusters managed by Apache Mesos. The framework supports auto-scaling and fail-over based on built-in health checks.
The primary concept implemented in Marathon is the Application, which is a resizeable collection of identical containers launched as a long-running service or a short-term batch processing job.
The framework consists of the following components:
- Marathon server to translate Application definitions into stateful services consisting of Mesos tasks.
- REST API for programmatic access and integration.
- User Interface to create and manage Applications.
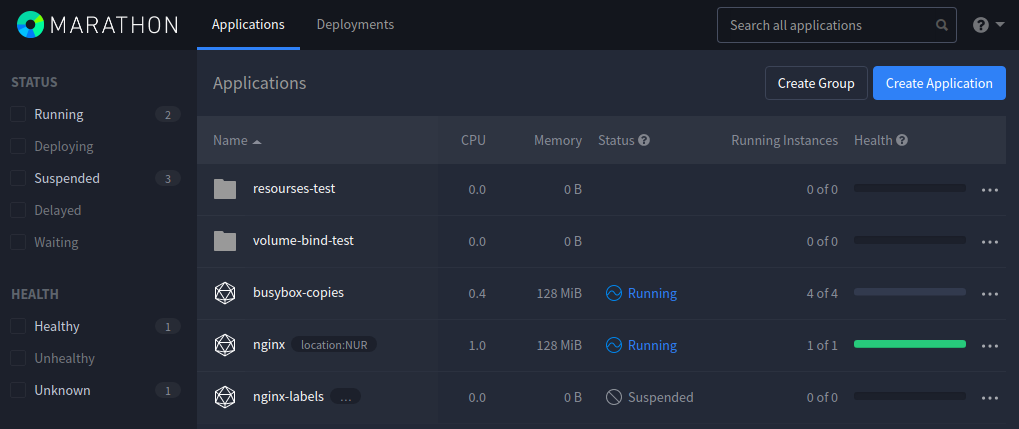
Marathon v1.5.6 user interface:
Capacity
Each container (or Task in Marathon terms) is allocated a pre-defined amount of CPU, memory, and disk resources by the application which launches the containers on underlying Mesos nodes based on available system capacity.
Allocated Capacity
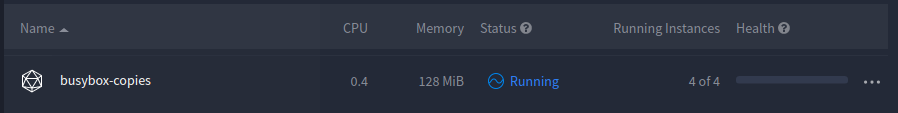
Both the API and the user interface provide a way to view allocated capacity alongside the number of launched, healthy, and unhealthy tasks aggregated for each application. Marathon reports the health statuses of these applications for tasks with enabled health checks.
Capacity Usage
Integration with ATSD adds an additional level of visibility by collecting and aggregating CPU, memory, and disk usage at the Application level which allows the user to achieve higher capacity utilization by correlating resource allocations with actual usage.
Configuration
Prerequisites
- Access to Marathon server via REST API
v2. - 4 GB RAM for the ATSD Sandbox container.
Launch ATSD Sandbox
Launch ATSD sandbox container on one of the Docker hosts.
Replace marathon_hostname, username, and password in the command below with actual Marathon user credentials.
docker run -d -p 8443:8443 -p 9443:9443 -p 8081:8081 \
  --name=atsd-sandbox \
  --volume /var/run/docker.sock:/var/run/docker.sock \
  --env ATSD_IMPORT_PATH='https://raw.githubusercontent.com/axibase/atsd-use-cases/master/integrations/marathon/capacity-and-usage/resources/atsd-marathon-xml.zip' \
  --env COLLECTOR_IMPORT_PATH='https://raw.githubusercontent.com/axibase/atsd-use-cases/master/integrations/marathon/capacity-and-usage/resources/marathon-jobs.xml' \
  --env COLLECTOR_CONFIG='marathon-jobs.xml:server=marathon_hostname,port=8080,userName=username,password=password' \
  axibase/atsd-sandbox:latest
The sandbox container includes both ATSD and Axibase Collector instances. The command uploads the needed XML files to ATSD and Axibase Collector.
If you would like to import files manually, follow the instructions for manual upload.
The Collector instance installed in the sandbox container automatically starts historizing statistics from the local Docker engine.
Wait until the sandbox initializes and you see All applications started in the logs.
docker logs -f atsd-sandbox
Log in to ATSD user interface using axibase username and axibase password.
https://atsd_hostname:8443/
Launch Axibase Collectors containers
Launch Collector instances on the other Docker hosts in the environment. The remote Collector instances send Docker statistics into the centralized ATSD database running in the sandbox container that you previously launched.

Replace atsd_hostname in the command below with the hostname or IP address where ATSD is running.
$ docker run -d -p 9443:9443 --restart=always \
   --name=axibase-collector \
   --volume /var/run/docker.sock:/var/run/docker.sock \
   --env=DOCKER_HOSTNAME=`hostname -f` \
  axibase/collector \
   -atsd-url=https://collector:collector@atsd_hostname:8443 \
   -job-enable=docker-socket
Results
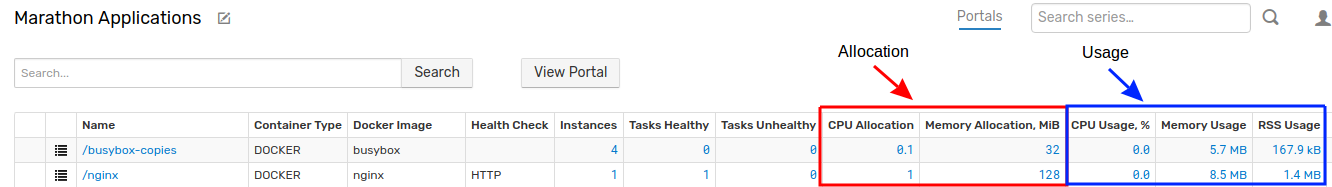
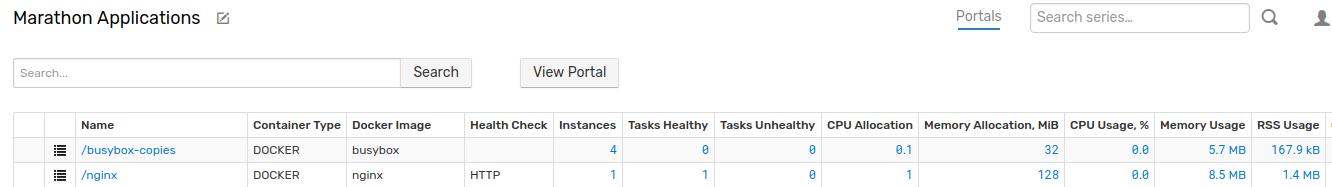
Marathon Applications Entity View
Click Marathon Applications on the menu to access the Entity View. This view displays all Marathon applications, the number of healthy tasks for each application, as well as aggregate resource utilization with breakdown by CPU, memory, and disk.
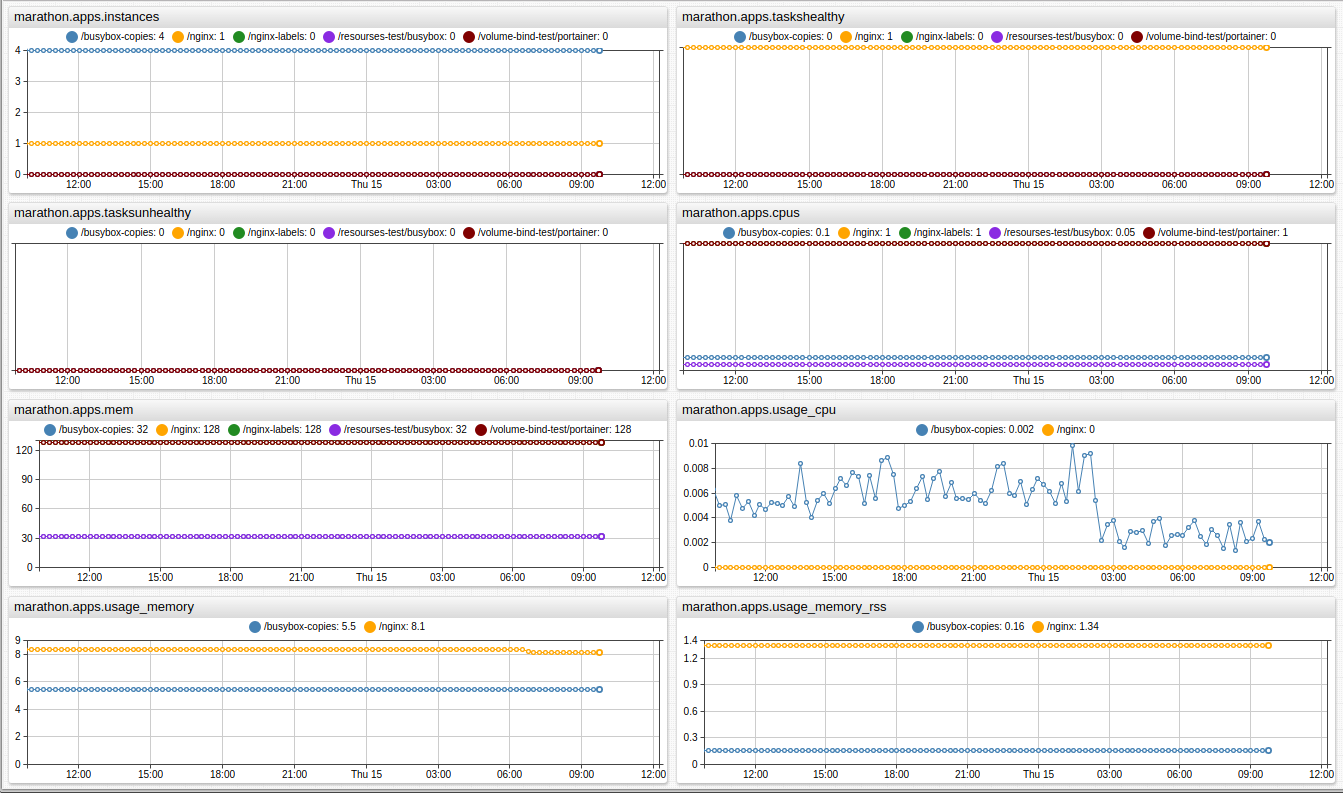
Resource Utilization Portal
The built-in portal displays daily statistics on resource allocation and usage for all applications at once.