Major Foreign Holders of Treasury Securities (2000-2018)
Toolkit
- Data Source:
treasury.gov - Visualization Tool: ChartLab
- Query Language: SQL Console
To replicate this or other portals, install ATSD or launch the Docker Container.
Securities Portal
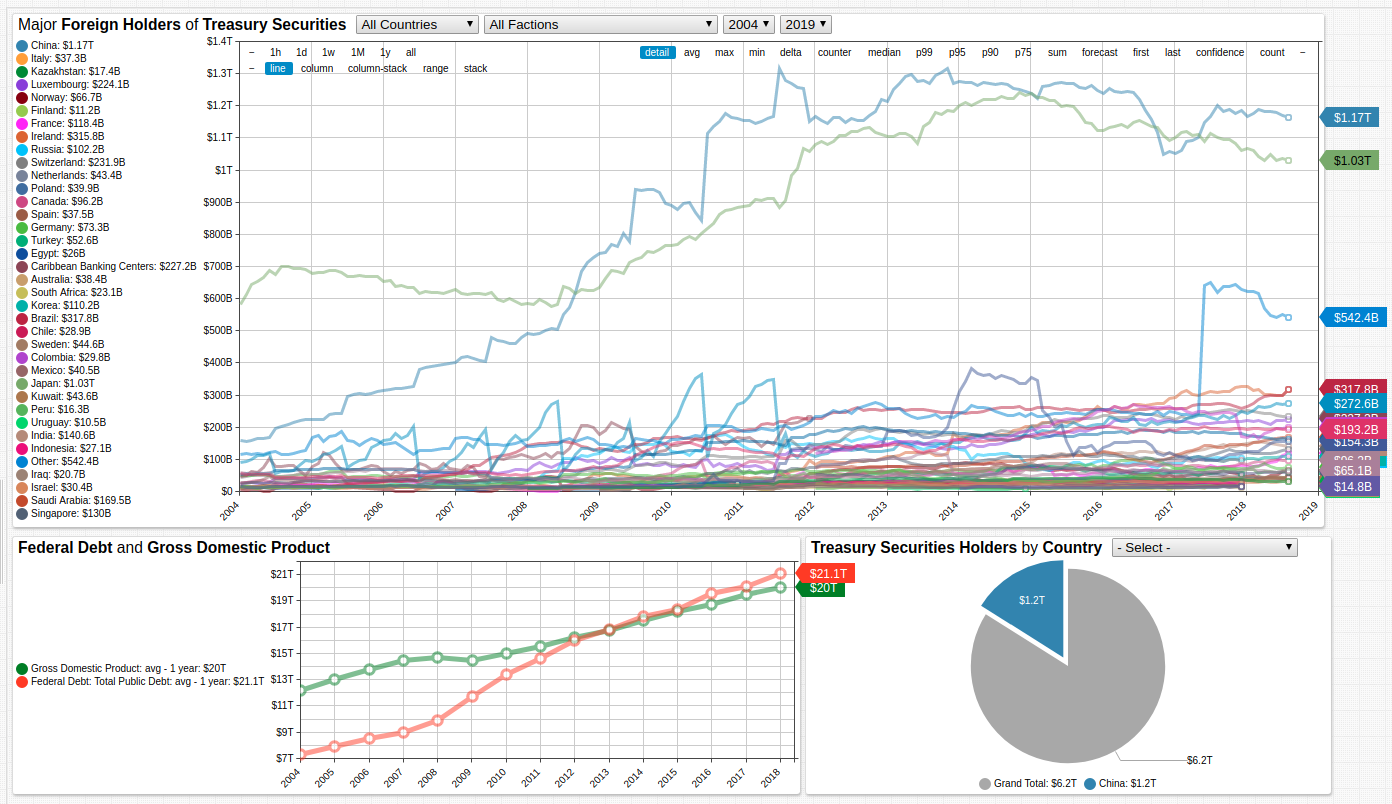
The United States Treasury releases monthly reports detailing major holders of United States Treasury securities. The Securities Portal tracks this data for the last two decades, when foreign ownership of national debt began to significantly increase. In 1988, roughly 13% of the debt was foreign held. By 2007, that figure had increased to 25%. At the present, foreign holders of national debt represent 45% of the total.

Exploring the Portal
The Securities Portal includes ad hoc transformation and filtering tools to investigate an otherwise large dataset.
ChartLab uses Charts syntax to create portals from data stored in ATSD.
Filtering Series
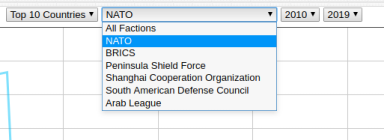
Use the drop-down lists in the widget headers to filter by value, military/economic faction, or a specific time span.

The pie chart drop-down list selects a specific country and displays the amount of Treasury bonds held as a portion of the whole.
[tags]
  country = China
Transforming Data
Use the control panel along the top of the chart to compute and display aggregated values for any of the specified time periods.
periods = 1 year, 5 year, 10 year
Select multiple aggregation functions at once to compare various results.
Isolating Information
Use the legend on the left of the chart to show or hide series, and adjust the overall chart scale.
Click a filled circle to remove a specific series from the visualization.
Modifying the Portal
To customize the visualization, expand the Editor pane. Refer to the ChartLab tutorial to get started. ChartLab documentation includes other basic configuration examples.

Querying the Data
Treasury data is accessible via SQL Console.
Greatest Absolute Increase in Securities Holdings
Data is stored by Treasury in USD billion:
1,000corresponds to $1 trillion.1corresponds to $1 billion.
SELECT tags.country as "Country", DELTA(value) as "Debt"
  FROM tic_foreign_holders
WHERE tags.country NOT LIKE 'Total'
  AND tags.country NOT LIKE 'For. Official'
  AND tags.country NOT LIKE 'T-Bonds & Notes'
  AND tags.country NOT LIKE 'Oil Exporters'
  AND tags.country NOT LIKE 'Treasury Bills'
GROUP BY PERIOD(20 year), tags.country
  ORDER BY delta(value) DESC
LIMIT 10
| Country                   | Debt |
|---------------------------|------|
| China                     | 1106 |
| Japan                     | 704  |
| Other                     | 415  |
| Ireland                   | 309  |
| Brazil                    | 307  |
| Switzerland               | 210  |
| Luxembourg                | 201  |
| Caribbean Banking Centers | 171  |
| Hong Kong                 | 148  |
| India                     | 135  |
Greatest Percent Increase in Securities Holdings
SELECT tags.country as "Country", FIRST_VALUE(value) AS "Initial", LAST_VALUE(value) AS "Final", LAST_VALUE(value)/FIRST_VALUE(value)* 100 as "%Increase"
  FROM tic_foreign_holders
WHERE tags.country NOT LIKE 'Total'
  AND tags.country NOT LIKE 'For. Official'
  AND tags.country NOT LIKE 'T-Bonds & Notes'
  AND tags.country NOT LIKE 'Oil Exporters'
  AND tags.country NOT LIKE 'Treasury Bills'
GROUP BY PERIOD(20 year), tags.country
  ORDER BY "%Increase" DESC
LIMIT 10
| Country     | Initial | Final  | %Increase |
|-------------|---------|--------|-----------|
| Ireland     | 7.2     | 315.8  | 4386.1    |
| Brazil      | 10.9    | 317.8  | 2915.6    |
| India       | 5.8     | 140.6  | 2424.1    |
| China       | 59.4    | 1165.1 | 1961.4    |
| Russia      | 8.5     | 102.2  | 1202.4    |
| Norway      | 5.7     | 66.7   | 1170.2    |
| Switzerland | 21.4    | 231.9  | 1083.6    |
| Luxembourg  | 23.1    | 224.1  | 970.1     |
| Sweden      | 6.1     | 44.6   | 731.1     |
| Thailand    | 9.7     | 63.3   | 652.6     |
Countries Which Maintain Holdings
These countries carry the greatest overall average values of Treasury securities, indicating they rarely sell what they buy. Value is aggregated over the entire recorded period.
SELECT tags.country as "Country", AVG(value) AS "Average Annual Holdings"
  FROM tic_foreign_holders
WHERE tags.country NOT LIKE 'Total'
  AND tags.country NOT LIKE 'For. Official'
  AND tags.country NOT LIKE 'T-Bonds & Notes'
  AND tags.country NOT LIKE 'Oil Exporters'
  AND tags.country NOT LIKE 'Treasury Bills'
  AND tags.country NOT LIKE 'Grand Total'
GROUP BY PERIOD(20 year), tags.country
  ORDER BY AVG(value) DESC
| Country        | Average Annual Holdings |
|----------------|-------------------------|
| Japan          | 790.0                   |
| China          | 720.0                   |
| All Other      | 639.2                   |
| Other          | 210.3                   |
| Cayman Islands | 194.9                   |
| Brazil         | 155.5                   |
| United Kingdom | 149.1                   |
| Luxembourg     | 112.9                   |
| Taiwan         | 110.5                   |
| Russia         | 109.2                   |
The Value of Treasury Securities
Debt is generally understood to be an economic disadvantage with the great transcendentalist Ralph Waldo Emerson remarking, "a man in debt is so far a slave." The general attitude towards debt has evolved as such, and national debt held by foreign government is traditionally regarded with uneasiness.
Equity analyst Michael Foster offers a different perspective, whereby the national debt should be considered a reliable long-term asset which promises the stability historically ascribed to the dollar. Certainly, various foreign countries, and several countries in particular, have made significant long-term investments in the national debt. According to Dr. Foster, that the national debt has even begun to exceed GDP is not a harbinger of imminent financial collapse.
Nonetheless, any time an asset is improperly hedged an inherent and increased risk is assumed. At the moment, roughly 35% of the national debt held by foreign governments is controlled by just two countries: China and Japan. Indeed, the combined share of the debt held by just two parties is nearly equal to half of the overall value. Such imparity can always produce unknowable outcomes. Should either economy sell their treasury securities en masse, the entire market could be affected in ways that are not predictable. Indeed, the theretofore unflappable British pound sterling was significantly rattled during Black Wednesday trading begun by parties controlling far less of the overall market.
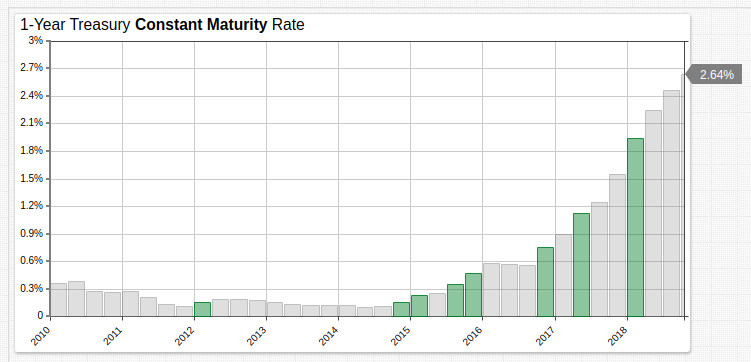
The 1-year constant maturity rate for Treasury bonds has been steadily increasing for the last several years. Encouraging considering the half-decade of less-than-one-percent yields on the same bonds during the economic recovery following global financial downturn.

The source Federal Reserve data is grouped by quarter, and periods which show an increase of greater than 25% from the previous quarter are highlighted.
[widget]
  statistics = avg
  period = 3 month

  [series]
    alert-expression = value > 1.25 * previous
