Computing U.S. Mortality Statistics with a Structured Query Language

Introduction
According to infoplease.com, life expectancy from 1935 to 2010 for both sexes in the U.S. increased from 61.7 to 78.7 years.
As reported by the Center for Disease Control and Prevention (CDC), the crude death rate in the United States fell from
10.9 to 7.9 deaths per 1,000 people from 1935 to 2010, translating to a 27% decrease. Mortality rates are vastly different across different U.S. cities and age groups.
This article explores a data.gov dataset containing mortality statistics for 122 U.S. cities using ATSD and SQL Console.
Death Statistics for 122 U.S. Cities
Download this dataset from data.gov.
On data.gov, datasets can be downloaded in CSV (16.7 MB), RDF, JSON (66.2 MB), or XML format. Parse this dataset using the JSON Job in Axibase Collector.
This file contains weekly mortality statistics from 1962 to 2016 in 122 U.S. cities until the system became obsolete on October 6th, 2016. The vital statistics offices of these cities across the United States reported the total number of death certificates processed and the number of those for which pneumonia or influenza is listed as the underlying or contributing cause of death by age group. The data is clustered by age group:
- 0 - 1 years (all causes of death).
- 1 - 24 years (all causes of death).
- 25 - 44 years (all causes of death).
- 45 - 64 years (all causes of death).
- 65 + years (all causes of death).
- All deaths.
- Pneumonia and influenza deaths.
You can find a complete list of the cities in city-list.md.
Additionally, these cities are be grouped by United States Census Bureau regions.
These regions are enumerated in region-table.md.
While possible to manually analyze this information in a spreadsheet program, it is much more convenient to interact with the data once it is loaded into a database.
Axibase Time Series Database
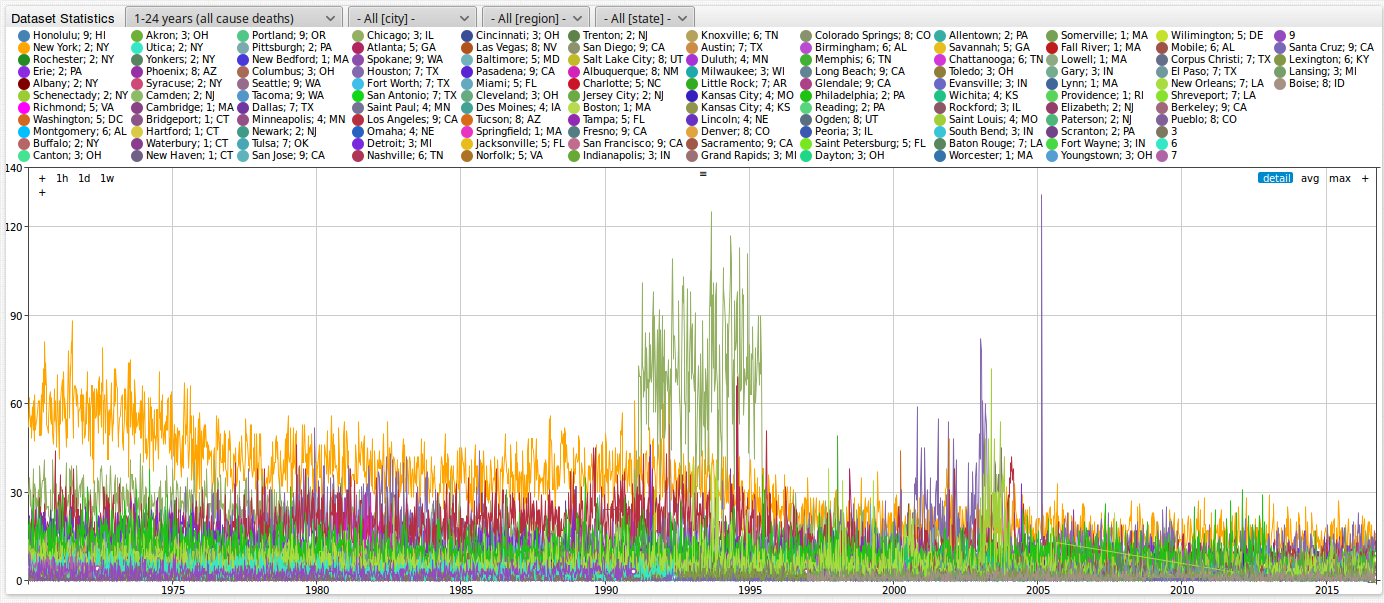
ATSD is a non-relational database capable of storing, analyzing, and visualizing datasets. This article focuses on writing and running SQL queries using the web-based SQL Console
Below is the output of the default configuration with all 122 U.S. cities parsed and imported into ATSD.

Creating Local Configurations for ATSD and Axibase Collector using Docker
To query information from this dataset, install both ATSD and Axibase Collector.
Alternatively run ATSD and Axibase Collector as a Docker image.
ATSD Schema
Before creating SQL queries, familiarize yourself with the ATSD data schema and models.
Below is a glossary of some dataset schema terminology used in this article.
- Entity: Name of the dataset that loaded from
data.gov, in this casemr8w-325u. Equivalent to the Unique Identifier used on data.gov. Each dataset fromdata.govhas one entity.
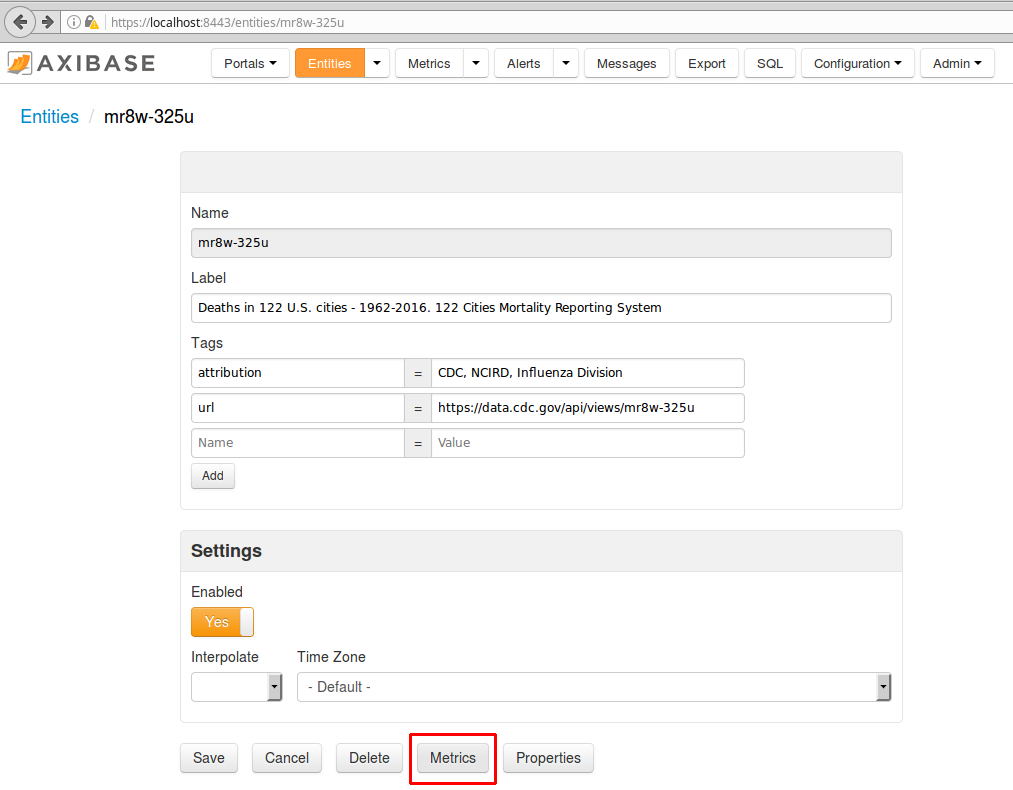
"id" : "mr8w-325u",
"name" : "Deaths in 122 U.S. cities - 1962-2016. 122 Cities Mortality Reporting System",
"attribution" : "CDC, NCIRD, Influenza Division",
- Metric: List of columns in the dataset such as
pneumonia_and_influenza_deaths. This dataset contains seven metrics.
"dataTypeName" : "number",
"fieldName" : "pneumonia_and_influenza_deaths"
- Series Tag: List of text columns contained in the dataset for example,
city. The tag columns allow us to filter and group the data. This dataset contains 3 series tags:city,state, andregion.
"name" : "City",
"dataTypeName" : "text",
"fieldName" : "city",
Procedure
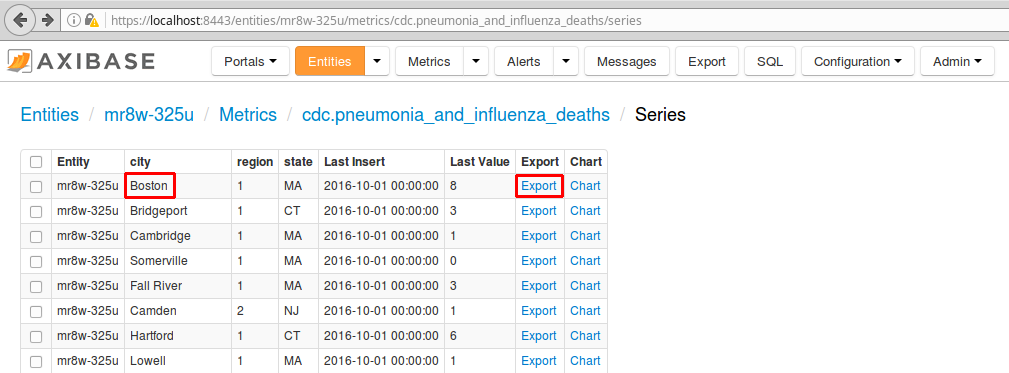
Navigate to the Entities tab in ATSD. Open the entity
mr8w-325u.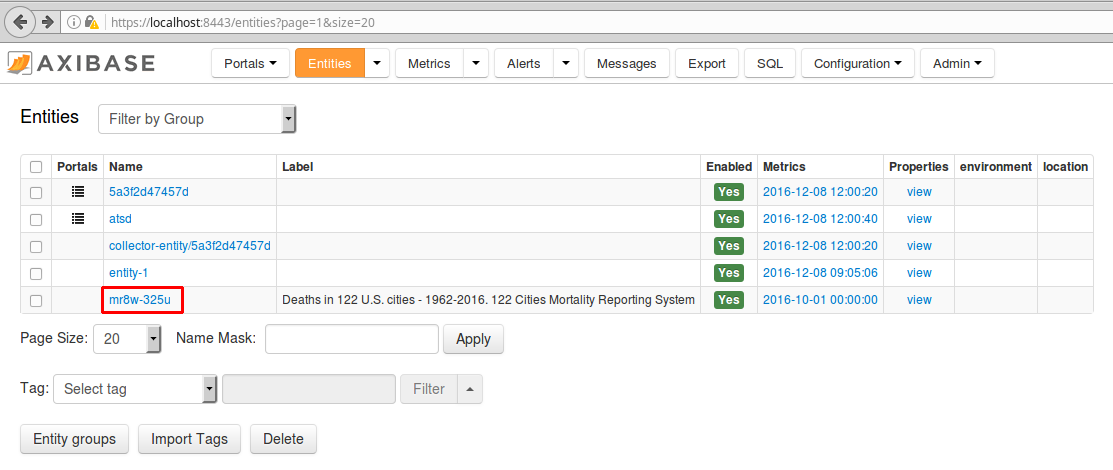
Click Metrics.
On the Metrics page, click Series for metric
cdc.pneumonia_and _influenza_deaths.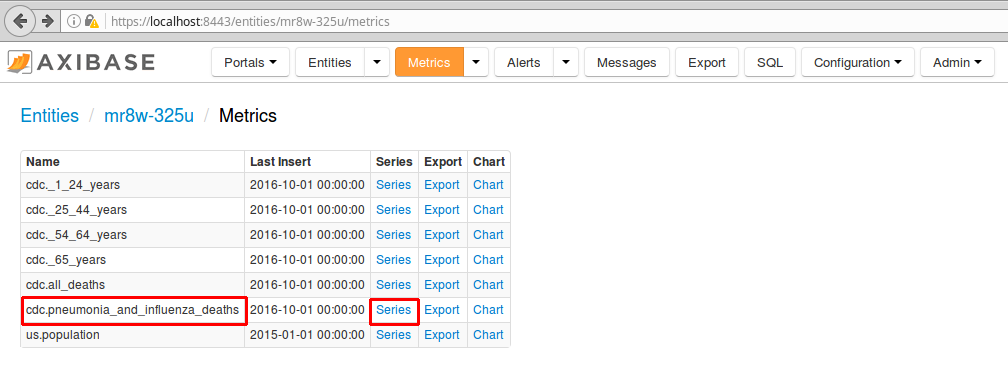
For Boston, select Export.
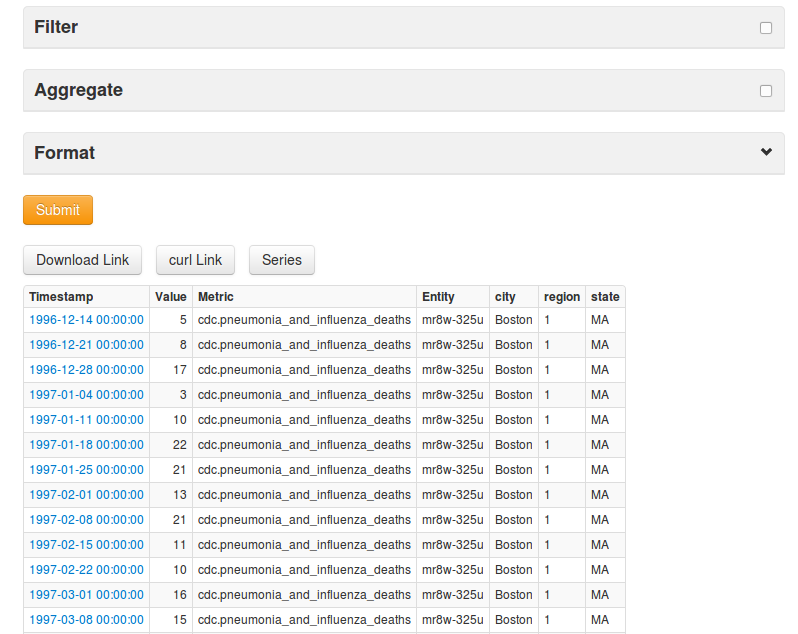
Export the last 20 years of data for pneumonia and influenza deaths. Click Submit.
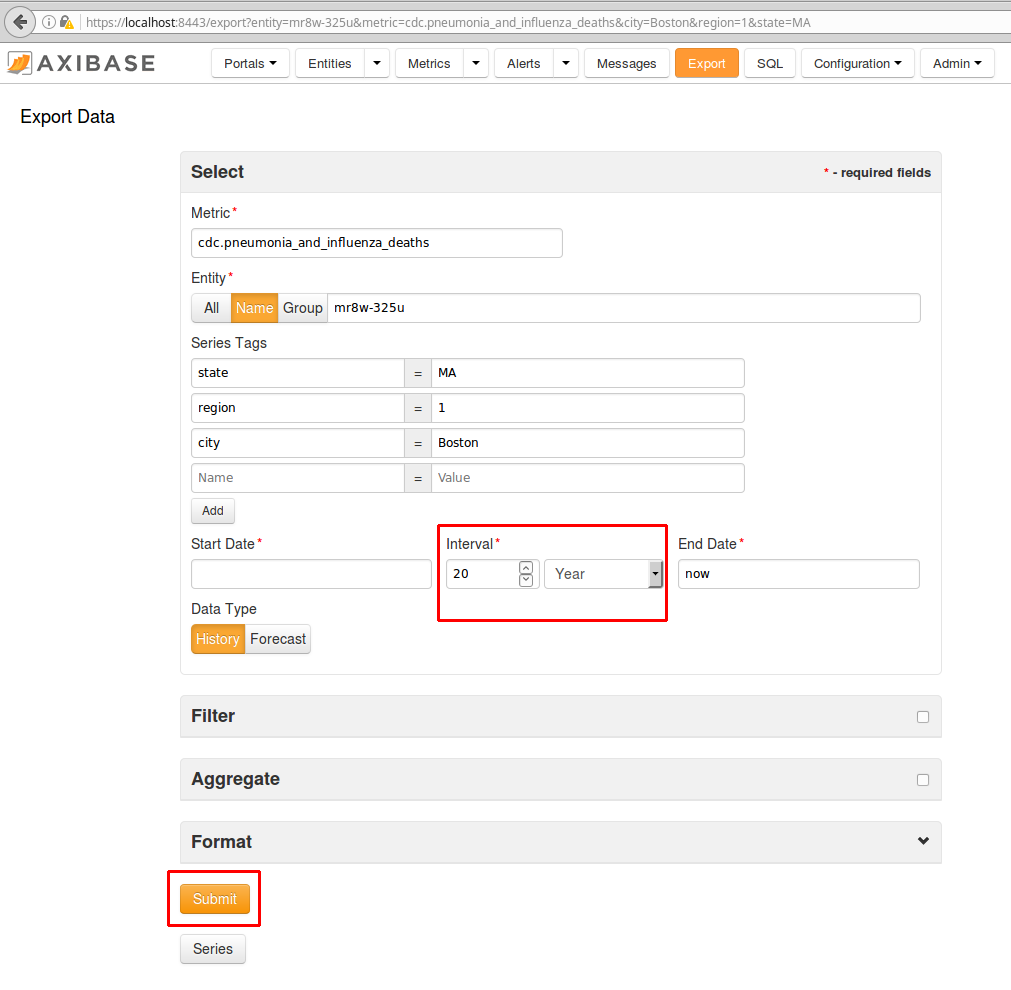
The data is shown below.
SQL Queries
Below are simple SQL queries with descriptions. Detailed instructions for creating SQL queries can be found in the Syntax Documentation.
Select all metrics:
SELECT *
  FROM cdc.all_deaths tot
LIMIT 10
Select all metrics, and order by city name and date:
SELECT *
  FROM cdc.all_deaths tot
  ORDER BY datetime, tags.city
LIMIT 10
Select mortality statistics for Boston:
SELECT *
  FROM cdc.all_deaths tot
WHERE tags.city = 'Boston'
  ORDER BY datetime
LIMIT 10
Select mortality statistics for Boston since January 1, 2016
SELECT datetime, value, tags.*
  FROM cdc.all_deaths tot
WHERE tags.city = 'Boston'
  AND datetime >= '2016-01-01T00:00:00Z'
  ORDER BY datetime
LIMIT 10
Select and group monthly mortality statistics for Boston since January 1, 2016
SELECT date_format(period(1 MONTH)), sum(value), count(value)
  FROM cdc.all_deaths tot
WHERE tags.city = 'Boston'
  AND datetime >= '2016-01-01T00:00:00Z'
GROUP BY period(1 MONTH)
  ORDER BY 1
For additional SQL examples view ATSD Documentation.
Pneumonia and Influenza Deaths in Boston
This SQL query tracks recent pneumonia and influenza deaths in Boston, Massachusetts.
SELECT datetime, value, tags.*
  FROM cdc.pneumonia_and_influenza_deaths
WHERE tags.city = 'Boston'
  ORDER BY datetime DESC
LIMIT 10
See SQL Documentation for more information.
Now, look at the latest pneumonia and influenza and total deaths for Boston, using the JOIN clause. This pairs the results with the corresponding total number of deaths in the city.
SELECT *
  FROM cdc.pneumonia_and_influenza_deaths pni
    JOIN cdc.all_deaths tot
WHERE pni.tags.city = 'Boston'
  ORDER BY pni.datetime DESC
LIMIT 10
| pni.entity  | pni.datetime              | pni.value  | pni.tags.city  | pni.tags.region  | pni.tags.state  | tot.entity  | tot.datetime              | tot.value  | tot.tags.city  | tot.tags.region  | tot.tags.state |
|-------------|---------------------------|------------|----------------|------------------|-----------------|-------------|---------------------------|------------|----------------|------------------|----------------|
| mr8w-325u   | 2016-10-01T00:00:00.000Z  | 8.0        | Boston         | 1                | MA              | mr8w-325u   | 2016-10-01T00:00:00.000Z  | 131.0      | Boston         | 1                | MA             |
| mr8w-325u   | 2016-09-24T00:00:00.000Z  | 5.0        | Boston         | 1                | MA              | mr8w-325u   | 2016-09-24T00:00:00.000Z  | 126.0      | Boston         | 1                | MA             |
| mr8w-325u   | 2016-09-17T00:00:00.000Z  | 11.0       | Boston         | 1                | MA              | mr8w-325u   | 2016-09-17T00:00:00.000Z  | 138.0      | Boston         | 1                | MA             |
| mr8w-325u   | 2016-09-10T00:00:00.000Z  | 5.0        | Boston         | 1                | MA              | mr8w-325u   | 2016-09-10T00:00:00.000Z  | 134.0      | Boston         | 1                | MA             |
| mr8w-325u   | 2016-09-03T00:00:00.000Z  | 13.0       | Boston         | 1                | MA              | mr8w-325u   | 2016-09-03T00:00:00.000Z  | 139.0      | Boston         | 1                | MA             |
| mr8w-325u   | 2016-08-27T00:00:00.000Z  | 11.0       | Boston         | 1                | MA              | mr8w-325u   | 2016-08-27T00:00:00.000Z  | 137.0      | Boston         | 1                | MA             |
| mr8w-325u   | 2016-08-20T00:00:00.000Z  | 12.0       | Boston         | 1                | MA              | mr8w-325u   | 2016-08-20T00:00:00.000Z  | 127.0      | Boston         | 1                | MA             |
| mr8w-325u   | 2016-08-13T00:00:00.000Z  | 8.0        | Boston         | 1                | MA              | mr8w-325u   | 2016-08-13T00:00:00.000Z  | 133.0      | Boston         | 1                | MA             |
| mr8w-325u   | 2016-08-06T00:00:00.000Z  | 11.0       | Boston         | 1                | MA              | mr8w-325u   | 2016-08-06T00:00:00.000Z  | 138.0      | Boston         | 1                | MA             |
| mr8w-325u   | 2016-07-30T00:00:00.000Z  | 12.0       | Boston         | 1                | MA              | mr8w-325u   | 2016-07-30T00:00:00.000Z  | 120.0      | Boston         | 1                | MA             |
The query below explicitly specifies tags. See Series Tags Documentation for more information abut using Series Tags.
SELECT datetime, value, tags.city, tags.state, tags.region
  FROM cdc.pneumonia_and_influenza_deaths
WHERE tags.city = 'Boston'
  ORDER BY datetime DESC
LIMIT 10
This query returns for latest pneumonia and influenza and total data for Boston, but with the region code translated to region name using Replacement Tables. By default, each region is listed as a number. Boston is in region 1, which includes the states of Connecticut, Maine, Massachusetts, New Hampshire, Rhode Island, and Vermont.
There is a replacement table in ATSD with region names for each number. In this instance, region 1 is New-England.
SELECT datetime, value, tags.city, tags.state,
   LOOKUP('us-region', tags.region) AS "region"
  FROM cdc.pneumonia_and_influenza_deaths
WHERE tags.city = 'Boston'
  ORDER BY datetime DESC
LIMIT 10
| datetime                  | value  | tags.city  | tags.state  | region      |
|---------------------------|--------|------------|-------------|-------------|
| 2016-10-01T00:00:00.000Z  | 8.0    | Boston     | MA          | New-England |
| 2016-09-24T00:00:00.000Z  | 5.0    | Boston     | MA          | New-England |
| 2016-09-17T00:00:00.000Z  | 11.0   | Boston     | MA          | New-England |
| 2016-09-10T00:00:00.000Z  | 5.0    | Boston     | MA          | New-England |
| 2016-09-03T00:00:00.000Z  | 13.0   | Boston     | MA          | New-England |
| 2016-08-27T00:00:00.000Z  | 11.0   | Boston     | MA          | New-England |
| 2016-08-20T00:00:00.000Z  | 12.0   | Boston     | MA          | New-England |
| 2016-08-13T00:00:00.000Z  | 8.0    | Boston     | MA          | New-England |
| 2016-08-06T00:00:00.000Z  | 11.0   | Boston     | MA          | New-England |
| 2016-07-30T00:00:00.000Z  | 12.0   | Boston     | MA          | New-England |
The query below returns total pneumonia and influenza deaths for all cities in a given region using the GROUP BY clause, which combines rows having common values into a single row. The region
specified in this query is New-England.
SELECT datetime, sum(value),
  LOOKUP('us-region', tags.region) AS "region"
  FROM cdc.pneumonia_and_influenza_deaths
WHERE tags.region = '1'
  GROUP BY tags.region, datetime
  ORDER BY datetime DESC
LIMIT 10
| datetime                  | sum(value)  | region      |
|---------------------------|-------------|-------------|
| 2016-10-01T00:00:00.000Z  | 33.0        | New-England |
| 2016-09-24T00:00:00.000Z  | 22.0        | New-England |
| 2016-09-17T00:00:00.000Z  | 34.0        | New-England |
| 2016-09-10T00:00:00.000Z  | 25.0        | New-England |
| 2016-09-03T00:00:00.000Z  | 39.0        | New-England |
| 2016-08-27T00:00:00.000Z  | 26.0        | New-England |
| 2016-08-20T00:00:00.000Z  | 32.0        | New-England |
| 2016-08-13T00:00:00.000Z  | 33.0        | New-England |
| 2016-08-06T00:00:00.000Z  | 37.0        | New-England |
| 2016-07-30T00:00:00.000Z  | 34.0        | New-England |
Monthly pneumonia and influenza death are totaled for all cities in the New-England region for the time-range from January 1st, 2016 to October 1st, 2016 with the query below.
SELECT datetime, sum(value),
  LOOKUP('us-region', tags.region) AS "region"
  FROM cdc.pneumonia_and_influenza_deaths
WHERE tags.region = '1'
  AND datetime >= '2016-01-01T00:00:00Z' AND datetime < '2016-10-01T00:00:00Z'
  GROUP BY tags.region, period(1 MONTH)
  ORDER BY datetime DESC
| datetime                  | sum(value)  | region      |
|---------------------------|-------------|-------------|
| 2016-09-01T00:00:00.000Z  | 120.0       | New-England |
| 2016-08-01T00:00:00.000Z  | 128.0       | New-England |
| 2016-07-01T00:00:00.000Z  | 196.0       | New-England |
| 2016-06-01T00:00:00.000Z  | 150.0       | New-England |
| 2016-05-01T00:00:00.000Z  | 184.0       | New-England |
| 2016-04-01T00:00:00.000Z  | 308.0       | New-England |
| 2016-03-01T00:00:00.000Z  | 200.0       | New-England |
| 2016-02-01T00:00:00.000Z  | 203.0       | New-England |
| 2016-01-01T00:00:00.000Z  | 214.0       | New-England |
Best of the Best and Worst of the Worst
Some additional examples track the most and least fatal cities in the U.S.
The least deadly week by city, based on total deaths.
SELECT date_format(time, 'yyyy-MM-dd') AS "date",
  tags.city AS "city", tags.state AS "state",
  ISNULL(LOOKUP('us-region', tags.region), tags.region) AS "region",
  value AS "all_deaths",
  LOOKUP('city-size', concat(tags.city, ',', tags.state)) AS "population"
FROM cdc.all_deaths
  WHERE entity = 'mr8w-325u' and tags.city IS NOT NULL AND value > 0
  WITH row_number(tags ORDER BY value, time DESC) <= 1
ORDER BY 'date' DESC
  OPTION (ROW_MEMORY_THRESHOLD 500000)
| date        | city              | state  | region              | all_deaths  | population |
|-------------|-------------------|--------|---------------------|-------------|------------|
| 2016-10-01  | Denver            | CO     | Mountain            | 9.0         | 682545     |
| 2016-10-01  | Somerville        | MA     | New-England         | 1.0         | 80318      |
| 2016-04-16  | Colorado Springs  | CO     | Mountain            | 3.0         | 456568     |
| 2016-02-27  | Seattle           | WA     | Pacific             | 1.0         | 684451     |
| 2016-01-16  | New York          | NY     | Middle-Atlantic     | 502.0       | 8550405    |
| 2016-01-02  | San Antonio       | TX     | West-South-Central  | 1.0         | 1469845    |
| 2016-01-02  | Spokane           | WA     | Pacific             | 1.0         | 213272     |
| 2015-12-26  | Lowell            | MA     | New-England         | 7.0         | 110699     |
| 2015-08-22  | Scranton          | PA     | Middle-Atlantic     | 11.0        | 77118      |
| 2015-02-07  | Baltimore         | MD     | South-Atlantic      | 18.0        | 621849     |
| 2015-01-03  | Milwaukee         | WI     | East-North-Central  | 25.0        | 600155     |
| 2014-12-27  | New Bedford       | MA     | New-England         | 9.0         | 94958      |
This query displays for results for all 122 cities in the dataset. For the sake of brevity, only the top 12 results are shown.
tags.city IS NOT NULLis specified to discard a few rows present in the dataset for older dates collected without a reference city.WITH row_number ... <= 1partitions rows by tags (city, state, region) and selects the row with the MINIMUM value for each partition using theORDER BYvalue condition.- The
LOOKUP('us-region', tags.region)function convertstags.region(number) into a string, for example, 3 becomes East-North-Central. LOOKUP('city-size', concat(tags.city, ',', tags.state))retrieves city size for the given city and state pair, concatenated to the{city},{state}pattern.
The deadliest week by city, based on total deaths.
SELECT date_format(time, 'yyyy-MM-dd') AS "date",
  tags.city AS "city", tags.state AS "state",
  ISNULL(LOOKUP('us-region', tags.region), tags.region) AS "region",
  value AS "all_deaths",
  LOOKUP('city-size', concat(tags.city, ',', tags.state)) AS "population"
FROM cdc.all_deaths
  WHERE entity = 'mr8w-325u' and tags.city IS NOT NULL
  WITH row_number(tags ORDER BY value desc, time desc) <= 1
ORDER BY value desc
  OPTION (ROW_MEMORY_THRESHOLD 500000)
| date        | city          | state  | region              | all_deaths  | population |
|-------------|---------------|--------|---------------------|-------------|------------|
| 1976-02-21  | New York      | NY     | Middle-Atlantic     | 2550.0      | 8550405    |
| 1998-06-27  | Atlanta       | GA     | South-Atlantic      | 1971.0      | 463878     |
| 2004-02-07  | Los Angeles   | CA     | Pacific             | 1755.0      | 3971883    |
| 2003-02-08  | Saint Louis   | MO     | West-North-Central  | 1424.0      | 315685     |
| 1991-01-26  | Chicago       | IL     | East-North-Central  | 1295.0      | 2720546    |
| 2012-02-04  | Philadelphia  | PA     | Middle-Atlantic     | 1063.0      | 1567448    |
| 2000-04-01  | Washington    | DC     | South-Atlantic      | 999.0       | 672228     |
| 1983-02-12  | Houston       | TX     | West-South-Central  | 860.0       | 2327463    |
| 1970-10-03  | Cincinnati    | OH     | East-North-Central  | 706.0       | 298550     |
| 2016-01-09  | San Antonio   | TX     | West-South-Central  | 666.0       | 1469845    |
| 1998-08-01  | Phoenix       | AZ     | Mountain            | 632.0       | 1563025    |
| 2000-06-03  | Wichita       | KS     | West-North-Central  | 560.0       | 389965     |
The line WITH row_number ... <= 1 partitions rows by tags (city, state, region) and selects the row with the MAXIMUM value for each partition using the ORDER BY value DESC condition.
Noticeably absent from the above list is New Orleans, Louisiana. On August 29th, 2005, Hurricane Katrina struck the Gulf coast of the United States, with New Orleans taking the brunt of the force. According to the Federal Emergency Management Agency (FEMA), Katrina was, "the single most catastrophic natural disaster in U.S. history." FEMA estimated the total damage from the hurricane amounted to $108 billion dollars, making it the "costliest hurricane in U.S. history." Approximately 1,833 people are estimated to have died in the storm, with 1,577 of those deaths occurring in the New Orleans area, where is New Orleans in the results?
Below is a ChartLab output for the number of deaths for New Orleans from 1970 to 2016.
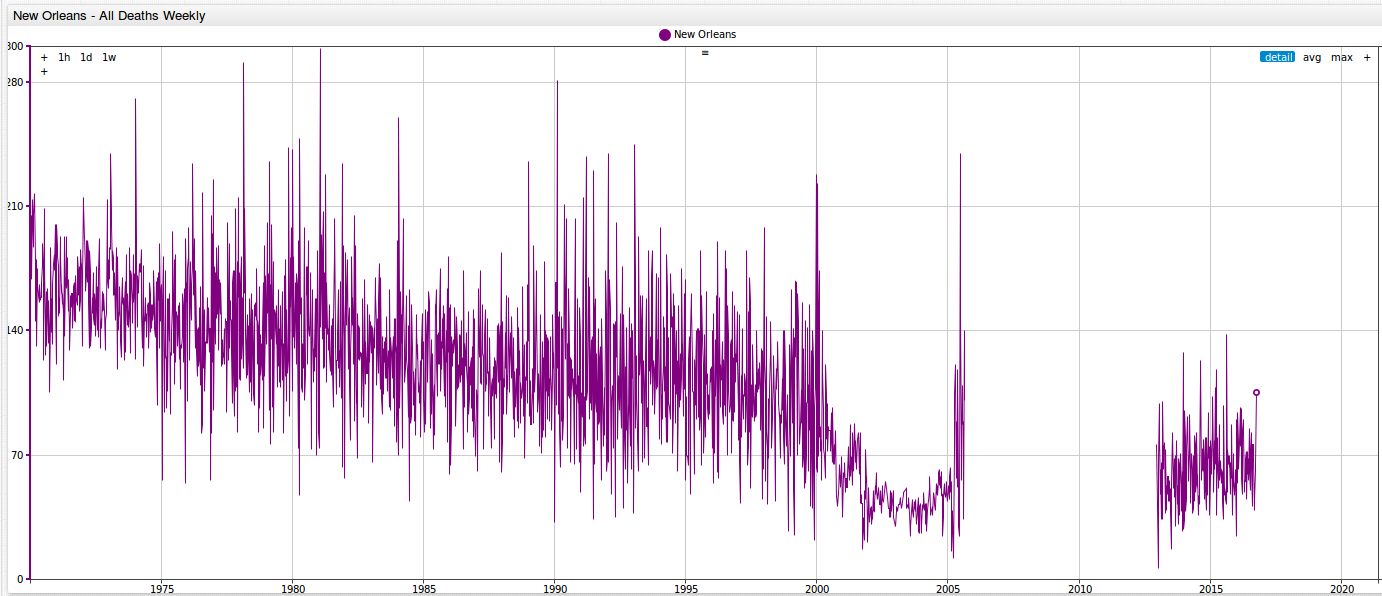
There is quite a noticeable gap in the data collection history from the city. From August 20th, 2005, to December 8th, 2012, New Orleans did not collect death total statistics.
Another example of a city stopping data collection is Philadelphia, Pennsylvania. Looking at a filtered output for Philadelphia, you can see that the city has recently experienced a significant increase in deaths. The city recorded a death total of 1,063 on February 4th, 2012; however data collection stopped on November 24th, 2012. Using this particular dataset, you cannot say whether or not this is the highest weekly total in Philadelphia history, or whether more occurred after November 24th, 2012.
The deadliest week due to pneumonia and influenza by city:
SELECT date_format(time, 'yyyy-MM-dd') AS "date",
  tags.city AS "city", tags.state AS "state",
  ISNULL(LOOKUP('us-region', tags.region), tags.region) AS "region",
  value AS "pneumonia_influenza_deaths",
  LOOKUP('city-size', concat(tags.city, ',', tags.state)) AS "population"
FROM cdc.pneumonia_and_influenza_deaths t1
  WHERE entity = 'mr8w-325u' and tags.city IS NOT NULL
  WITH row_number(tags ORDER BY value desc, time desc) <= 1
ORDER BY value desc
  OPTION (ROW_MEMORY_THRESHOLD 500000)
| date        | city         | state  | region              | pneumonia_influenza_deaths  | population |
|-------------|--------------|--------|---------------------|-----------------------------|------------|
| 1976-02-21  | New York     | NY     | Middle-Atlantic     | 280.0                       | 8550405    |
| 2004-01-17  | Los Angeles  | CA     | Pacific             | 231.0                       | 3971883    |
| 2003-02-08  | Saint Louis  | MO     | West-North-Central  | 150.0                       | 315685     |
| 2000-03-04  | Chicago      | IL     | East-North-Central  | 83.0                        | 2720546    |
| 1999-03-06  | Sacramento   | CA     | Pacific             | 77.0                        | 490712     |
The deadliest pneumonia and influenza week as a percentage of all deaths:
SELECT date_format(tot.time, 'yyyy-MM-dd') AS "date",
  tot.tags.city AS "city", tot.tags.state AS "state",
  LOOKUP('us-region', tot.tags.region) AS "region",
  tot.value AS "all_deaths",
  pni.value AS "pneumonia_influenza_deaths",
  pni.value/tot.value*100 AS "pneumonia_influenza_deaths, %",
  LOOKUP('city-size', CONCAT(tot.tags.city, ',', tot.tags.state)) AS "population"
FROM cdc.all_deaths tot
  JOIN cdc.pneumonia_and_influenza_deaths pni
  WHERE tot.entity = 'mr8w-325u' AND tot.tags.city IS NOT NULL
  AND pni.value > 1
  WITH row_number(tot.tags ORDER BY pni.value/tot.value DESC, tot.time DESC) <= 1
  ORDER BY 'pneumonia_influenza_deaths, %' DESC, pni.value DESC
  OPTION (ROW_MEMORY_THRESHOLD 500000)
| date        | city         | state  | region              | all_deaths  | pneumonia_influenza_deaths  | pneumonia_influenza_deaths, %  | population |
|-------------|--------------|--------|---------------------|-------------|-----------------------------|--------------------------------|------------|
| 2002-05-18  | Glendale     | CA     | Pacific             | 26.0        | 26.0                        | 100.0                          | 201020     |
| 2005-03-12  | New Orleans  | LA     | West-South-Central  | 12.0        | 12.0                        | 100.0                          | 389617     |
| 2003-10-18  | Birmingham   | AL     | East-South-Central  | 9.0         | 9.0                         | 100.0                          | 212461     |
| 1995-05-27  | Nashville    | TN     | East-South-Central  | 9.0         | 9.0                         | 100.0                          | 654610     |
| 2015-06-20  | Washington   | DC     | South-Atlantic      | 8.0         | 8.0                         | 100.0                          | 672228     |
| 1988-02-13  | Little Rock  | AR     | West-South-Central  | 7.0         | 7.0                         | 100.0                          | 197992     |
| 2000-12-16  | Trenton      | NJ     | Middle-Atlantic     | 3.0         | 3.0                         | 100.0                          | 84225      |
| 2003-06-28  | Akron        | OH     | East-North-Central  | 2.0         | 2.0                         | 100.0                          | 197542     |
- Two metrics are specified:
cdc.pneumonia_and_influenza_deathsandcdc.all_deaths. JOINmerges records with the same entity, tags, and time. Read more theJOINclause in SQL Documentation.- A derived metric,
pni.value/tot.value, is calculated to show a percentage of the part to the total number of deaths. - Only weeks with greater than one
pneumonia and influenzadeath are selected with theAND pni.value > 1condition.
OUTER JOIN finds all instances when a city failed to report pneumonia_and_influenza_deaths:
SELECT tot.datetime, tot.value AS "total",
  ISNULL(pni.value, 'N/A') AS "pneumonia/influenza"
FROM cdc.all_deaths tot
  OUTER JOIN cdc.pneumonia_and_influenza_deaths pni
WHERE tot.entity = 'mr8w-325u'
  AND tot.tags.city = 'Baton Rouge'
  AND pni.value IS NULL
The query sorts for rows for the city of Baton Rouge where the pni.value is NULL.
| tot.datetime              | total  | pneumonia/influenza |
|---------------------------|--------|---------------------|
| 2008-10-04T00:00:00.000Z  | 76.0   | N/A                 |
| 2008-11-01T00:00:00.000Z  | 37.0   | N/A                 |
| 2008-11-08T00:00:00.000Z  | 49.0   | N/A                 |
| 2008-11-15T00:00:00.000Z  | 49.0   | N/A                 |
| 2008-11-22T00:00:00.000Z  | 70.0   | N/A                 |
The top ten deadliest cities based on year-to-date deaths:
SELECT tags.city AS "city", tags.state AS "state",
  ISNULL(LOOKUP('us-region', tags.region), tags.region) AS "region",
  sum(value) AS "all_deaths",
  LOOKUP('city-size', concat(tags.city, ',', tags.state)) AS "population"
FROM cdc.all_deaths
  WHERE entity = 'mr8w-325u' and tags.city IS NOT NULL
  AND datetime > current_year
GROUP BY tags
ORDER BY 'all_deaths' DESC
  LIMIT 10
| city         | state  | region              | all_deaths  | population |
|--------------|--------|---------------------|-------------|------------|
| New York     | NY     | Middle-Atlantic     | 41291.0     | 8550405    |
| Houston      | TX     | West-South-Central  | 15058.0     | 2327463    |
| Las Vegas    | NV     | Mountain            | 13305.0     | 623747     |
| Los Angeles  | CA     | Pacific             | 11934.0     | 3971883    |
| San Antonio  | TX     | West-South-Central  | 11444.0     | 1469845    |
| Chicago      | IL     | East-North-Central  | 11389.0     | 2720546    |
| Cleveland    | OH     | East-North-Central  | 11156.0     | 388072     |
| Columbus     | OH     | East-North-Central  | 9934.0      | 850106     |
| Sacramento   | CA     | Pacific             | 9070.0      | 490712     |
| Dallas       | TX     | West-South-Central  | 8923.0      | 1300092    |
- The
LIMITclause caps the number of returned rows.AND datetime > current_yearreturns values from2016-01-01T00:00:00.000Zto2016-10-01T00:00:00.000Z.
Top 10 cities by pneumonia and influenza year-to-date deaths in 2016.
SELECT tags.city AS "city", tags.state AS "state",
  ISNULL(LOOKUP('us-region', tags.region), tags.region) AS "region",
  sum(value) AS "pneumonia_influenza_deaths",
  LOOKUP('city-size', concat(tags.city, ',', tags.state)) AS "population"
FROM cdc.pneumonia_and_influenza_deaths
  WHERE entity = 'mr8w-325u' and tags.city IS NOT NULL
  AND datetime > current_year
GROUP BY tags
ORDER BY 'pneumonia_influenza_deaths' DESC
  LIMIT 10
| city          | state  | region              | pneumonia_influenza_deaths  | population |
|---------------|--------|---------------------|-----------------------------|------------|
| New York      | NY     | Middle-Atlantic     | 1531.0                      | 8550405    |
| Los Angeles   | CA     | Pacific             | 1147.0                      | 3971883    |
| Las Vegas     | NV     | Mountain            | 1066.0                      | 623747     |
| San Antonio   | TX     | West-South-Central  | 735.0                       | 1469845    |
| Sacramento    | CA     | Pacific             | 678.0                       | 490712     |
| Chicago       | IL     | East-North-Central  | 666.0                       | 2720546    |
| Indianapolis  | IN     | East-North-Central  | 654.0                       | 853173     |
| Houston       | TX     | West-South-Central  | 649.0                       | 2327463    |
| Memphis       | TN     | East-South-Central  | 648.0                       | 655770     |
| Columbus      | OH     | East-North-Central  | 588.0                       | 850106     |
Top 10 cities with the highest percentage of year-to-date deaths caused by pneumonia and influenza in 2016:
SELECT tot.tags.city AS "city", tot.tags.state AS "state",
  LOOKUP('us-region', tot.tags.region) AS "region",
  sum(tot.value) AS "all_deaths",
  sum(pni.value) AS "pneumonia_influenza_deaths",
  sum(pni.value)/sum(tot.value)*100 AS "pneumonia_influenza_deaths, %",
  LOOKUP('city-size', CONCAT(tot.tags.city, ',', tot.tags.state)) AS "population"
FROM cdc.all_deaths tot
  JOIN cdc.pneumonia_and_influenza_deaths pni
WHERE tot.entity = 'mr8w-325u' AND tot.tags.city IS NOT NULL
  AND tot.datetime > current_year AND tot.value > 0
GROUP BY tot.tags
  ORDER BY 'pneumonia_influenza_deaths, %' DESC, 'pneumonia_influenza_deaths' DESC
  LIMIT 10
| city         | state  | region              | all_deaths  | pneumonia_influenza_deaths  | pneumonia_influenza_deaths, %  | population |
|--------------|--------|---------------------|-------------|-----------------------------|--------------------------------|------------|
| Glendale     | CA     | Pacific             | 1412.0      | 223.0                       | 15.8                           | 201020     |
| Worcester    | MA     | New-England         | 2493.0      | 352.0                       | 14.1                           | 184815     |
| Long Beach   | CA     | Pacific             | 2673.0      | 314.0                       | 11.7                           | 474140     |
| New Haven    | CT     | New-England         | 961.0       | 106.0                       | 11.0                           | 130322     |
| Pasadena     | CA     | Pacific             | 1121.0      | 123.0                       | 11.0                           | 142250     |
| Honolulu     | HI     | Pacific             | 3505.0      | 370.0                       | 10.6                           | 402500     |
| Peoria       | IL     | East-North-Central  | 2340.0      | 239.0                       | 10.2                           | 115070     |
| Fall River   | MA     | New-England         | 1039.0      | 106.0                       | 10.2                           | 88777      |
| Little Rock  | AR     | West-South-Central  | 3862.0      | 394.0                       | 10.2                           | 197992     |
| Los Angeles  | CA     | Pacific             | 11934.0     | 1147.0                      | 9.6                            | 3971883    |
Top 10 cities with the highest percentage of deaths caused by pneumonia and influenza, for the most recent 12 months.
SELECT tot.tags.city AS "city", tot.tags.state AS "state",
  LOOKUP('us-region', tot.tags.region) AS "region",
  sum(tot.value) AS "all_deaths",
  sum(pni.value) AS "pneumonia_influenza_deaths",
  sum(pni.value)/sum(tot.value)*100 AS "pneumonia_influenza_deaths, %",
  LOOKUP('city-size', CONCAT(tot.tags.city, ',', tot.tags.state)) AS "population"
FROM cdc.all_deaths tot
  JOIN cdc.pneumonia_and_influenza_deaths pni
WHERE tot.entity = 'mr8w-325u' AND tot.tags.city IS NOT NULL
  AND tot.datetime > now-1*YEAR AND tot.value > 0
GROUP BY tot.tags
  ORDER BY 'pneumonia_influenza_deaths, %' DESC, 'pneumonia_influenza_deaths' DESC
  LIMIT 10
- The line
AND tot.datetime > now-1*YEAR AND tot.value > 0filters the most recent 12 months instead of calendar year.
| city         | state  | region              | all_deaths  | pneumonia_influenza_deaths  | pneumonia_influenza_deaths, %  | population |
|--------------|--------|---------------------|-------------|-----------------------------|--------------------------------|------------|
| Glendale     | CA     | Pacific             | 1518.0      | 240.0                       | 15.8                           | 201020     |
| Worcester    | MA     | New-England         | 2679.0      | 386.0                       | 14.4                           | 184815     |
| Long Beach   | CA     | Pacific             | 2841.0      | 329.0                       | 11.6                           | 474140     |
| Pasadena     | CA     | Pacific             | 1204.0      | 130.0                       | 10.8                           | 142250     |
| Honolulu     | HI     | Pacific             | 3744.0      | 398.0                       | 10.6                           | 402500     |
| Fall River   | MA     | New-England         | 1111.0      | 117.0                       | 10.5                           | 88777      |
| New Haven    | CT     | New-England         | 1077.0      | 113.0                       | 10.5                           | 130322     |
| Peoria       | IL     | East-North-Central  | 2516.0      | 261.0                       | 10.4                           | 115070     |
| Little Rock  | AR     | West-South-Central  | 4110.0      | 420.0                       | 10.2                           | 197992     |
| Los Angeles  | CA     | Pacific             | 12787.0     | 1232.0                      | 9.6                            | 3971883    |
Top 10 cities with the highest percentage of deaths caused by pneumonia and influenza, since 1970:
SELECT tot.tags.city AS "city", tot.tags.state AS "state",
  LOOKUP('us-region', tot.tags.region) AS "region",
  sum(tot.value) AS "all_deaths",
  sum(pni.value) AS "pneumonia_influenza_deaths",
  sum(pni.value)/sum(tot.value)*100 AS "pneumonia_influenza_deaths, %",
  LOOKUP('city-size', CONCAT(tot.tags.city, ',', tot.tags.state)) AS "population"
FROM cdc.all_deaths tot
  JOIN cdc.pneumonia_and_influenza_deaths pni
WHERE tot.entity = 'mr8w-325u' AND tot.tags.city IS NOT NULL
  AND tot.value > 0
GROUP BY tot.tags
  ORDER BY 'pneumonia_influenza_deaths, %' DESC, 'pneumonia_influenza_deaths' DESC
  OPTION (ROW_MEMORY_THRESHOLD 500000)
In this example, there is no tot.datetime. As such, results are returned for all times ranging back to the start of the dataset.
| city          | state  | region              | all_deaths  | pneumonia_influenza_deaths  | pneumonia_influenza_deaths, %  | population |
|---------------|--------|---------------------|-------------|-----------------------------|--------------------------------|------------|
| Cambridge     | MA     | New-England         | 51209.0     | 6090.0                      | 11.9                           | 110402     |
| Worcester     | MA     | New-England         | 144668.0    | 14404.0                     | 10.0                           | 184815     |
| Santa Cruz    | CA     | Pacific             | 40367.0     | 3959.0                      | 9.8                            | 64220      |
| Boston        | MA     | New-England         | 407382.0    | 36691.0                     | 9.0                            | 667137     |
| Grand Rapids  | MI     | East-North-Central  | 140092.0    | 12451.0                     | 8.9                            | 195097     |
Number of pneumonia and influenza deaths per month in 2016 in the East-North-Central (tags.region = '3') region:
SELECT date_format(time, 'yyyy MMM') AS "date",
  LOOKUP('us-region', tags.region) AS "region",
  sum(value) AS "pneumonia_influenza_deaths"
FROM cdc.pneumonia_and_influenza_deaths
  WHERE entity = 'mr8w-325u' and tags.city IS NOT NULL
  AND tags.region = '3'
  AND datetime > now-5*year AND datetime < '2016-10-01T00:00:00Z'
GROUP BY tags.region, period(1 MONTH)
ORDER BY datetime desc, tags.region
| date      | region              | pneumonia_influenza_deaths |
|-----------|---------------------|----------------------------|
| 2016 Sep  | East-North-Central  | 476.0                      |
| 2016 Aug  | East-North-Central  | 430.0                      |
| 2016 Jul  | East-North-Central  | 529.0                      |
| 2016 Jun  | East-North-Central  | 425.0                      |
| 2016 May  | East-North-Central  | 566.0                      |
| 2016 Apr  | East-North-Central  | 812.0                      |
| 2016 Mar  | East-North-Central  | 633.0                      |
| 2016 Feb  | East-North-Central  | 578.0                      |
| 2016 Jan  | East-North-Central  | 732.0                      |
Total yearly pneumonia and influenza deaths in January for the East-North-Central region ranging since 1970:
SELECT date_format(time, 'yyyy MMM') AS "date",
  LOOKUP('us-region', tags.region) AS "region",
  sum(value) AS "pneumonia_influenza_deaths"
FROM cdc.pneumonia_and_influenza_deaths
  WHERE entity = 'mr8w-325u' and tags.city IS NOT NULL
  AND tags.region = '3'
  AND date_format(time, 'MMM') = 'Jan'
GROUP BY tags.region, period(1 MONTH)
ORDER BY datetime, tags.region
| date      | region              | pneumonia_influenza_deaths |
|-----------|---------------------|----------------------------|
| 1970 Jan  | East-North-Central  | 526.0                      |
| 1971 Jan  | East-North-Central  | 457.0                      |
| 1972 Jan  | East-North-Central  | 764.0                      |
| 1973 Jan  | East-North-Central  | 479.0                      |
| 1974 Jan  | East-North-Central  | 289.0                      |
| 1975 Jan  | East-North-Central  | 384.0                      |
| 1976 Jan  | East-North-Central  | 368.0                      |
| 1977 Jan  | East-North-Central  | 346.0                      |
| 1978 Jan  | East-North-Central  | 547.0                      |
| 1979 Jan  | East-North-Central  | 303.0                      |
| 1980 Jan  | East-North-Central  | 249.0                      |
Top 3 deadliest Januaries from pneumonia and influenza in the East-North-Central region:
SELECT date_format(time, 'yyyy MMM') AS "date",
  LOOKUP('us-region', tags.region) AS "region",
  sum(value) AS "pneumonia_influenza_deaths"
FROM cdc.pneumonia_and_influenza_deaths
  WHERE entity = 'mr8w-325u' and tags.city IS NOT NULL
  AND tags.region = '3'
  AND date_format(time, 'MMM') = 'Jan'
GROUP BY tags.region, period(1 MONTH)
ORDER BY sum(value) desc
  LIMIT 3
| date      | region              | pneumonia_influenza_deaths |
|-----------|---------------------|----------------------------|
| 2000 Jan  | East-North-Central  | 1292.0                     |
| 2004 Jan  | East-North-Central  | 1279.0                     |
| 2015 Jan  | East-North-Central  | 1203.0                     |
Deadliest pneumonia and influenza by month in the Pacific region:
SELECT date_format(time, 'MMM') AS "Month",
  LOOKUP('us-region', tags.region) AS "region",
  sum(value) AS "pneumonia_influenza_deaths"
FROM cdc.pneumonia_and_influenza_deaths
  WHERE entity = 'mr8w-325u' and tags.city IS NOT NULL
  AND LOOKUP('us-region', tags.region) = 'Pacific'
GROUP BY tags.region, date_format(time, 'MMM')
ORDER BY sum(value) DESC
| Month  | region   | pneumonia_influenza_deaths |
|--------|----------|----------------------------|
| Jan    | Pacific  | 32144.0                    |
| Mar    | Pacific  | 30288.0                    |
| Feb    | Pacific  | 28677.0                    |
| Apr    | Pacific  | 25047.0                    |
| Dec    | Pacific  | 23639.0                    |
| May    | Pacific  | 22972.0                    |
| Jun    | Pacific  | 20664.0                    |
| Jul    | Pacific  | 20374.0                    |
| Oct    | Pacific  | 19626.0                    |
| Nov    | Pacific  | 19363.0                    |
| Aug    | Pacific  | 19279.0                    |
| Sep    | Pacific  | 18611.0                    |
Calculating Mortality Rates
Compute mortality statistics using the data.gov dataset. Mortality Rate is the average annual number of deaths during a year per 1,000 individuals in the population. As of 2016, the United States as a whole ranks 90th in the world, with a rate of 8.20 deaths per 1,000 individuals. The table below enumerates the top 5 death rates in the world.
| Rank | Country | (Deaths/1,000 Population) | Date of Information |
|---|---|---|---|
| 1 | Lesotho | 14.90 | 2016 |
| 2 | Bulgaria | 14.50 | 2016 |
| 3 | Lithuania | 14.50 | 2016 |
| 4 | Ukraine | 14.40 | 2016 |
| 5 | Latvia | 14.40 | 2016 |
To calculate your own mortality rates for a city in a given year, divide the total number of deaths in the city by the population and multiply the result by 1,000. This dataset does not include population numbers, see Step 12 in the Configuration Guide for guided data acquisition.
Cities with the highest mortality rate in 2015:
SELECT tags.city AS "city", tags.state AS "state",
  ISNULL(LOOKUP('us-region', tags.region), tags.region) AS "region",
  sum(value) AS "all_deaths",
  cast(LOOKUP('city-size', concat(tags.city, ',', tags.state))) AS "population",
  sum(value)/cast(LOOKUP('city-size', concat(tags.city, ',', tags.state)))*1000 AS "mortality_rate"
FROM cdc.all_deaths
  WHERE entity = 'mr8w-325u' and tags.city IS NOT NULL
  AND datetime >= '2015-01-01T00:00:00Z' AND datetime < '2016-01-01T00:00:00Z'
GROUP BY tags
ORDER BY mortality_rate DESC
The syntax responsible for calculating Mortality Rate.
sum(value)/cast(LOOKUP('city-size', concat(tags.city, ',', tags.state)))*1000 AS "mortality_rate"
| city              | state  | region              | all_deaths  | population  | mortality_rate |
|-------------------|--------|---------------------|-------------|-------------|----------------|
| Youngstown        | OH     | East-North-Central  | 3523.0      | 64628.0     | 54.5           |
| Dayton            | OH     | East-North-Central  | 7328.0      | 140599.0    | 52.1           |
| Birmingham        | AL     | East-South-Central  | 9385.0      | 212461.0    | 44.2           |
| Salt Lake City    | UT     | Mountain            | 7377.0      | 192672.0    | 38.3           |
| Cleveland         | OH     | East-North-Central  | 14320.0     | 388072.0    | 36.9           |
| Rochester         | NY     | Middle-Atlantic     | 7439.0      | 209802.0    | 35.5           |
| Knoxville         | TN     | East-South-Central  | 6273.0      | 185291.0    | 33.9           |
| Tacoma            | WA     | Pacific             | 7021.0      | 207948.0    | 33.8           |
| Syracuse          | NY     | Middle-Atlantic     | 4150.0      | 144142.0    | 28.8           |
| Little Rock       | AR     | West-South-Central  | 5673.0      | 197992.0    | 28.7           |
| Albany            | NY     | Middle-Atlantic     | 2729.0      | 98469.0     | 27.7           |
| Erie              | PA     | Middle-Atlantic     | 2746.0      | 99475.0     | 27.6           |
| Chattanooga       | TN     | East-South-Central  | 4851.0      | 176588.0    | 27.5           |
| Santa Cruz        | CA     | Pacific             | 1718.0      | 64220.0     | 26.8           |
| South Bend        | IN     | East-North-Central  | 2710.0      | 101516.0    | 26.7           |
| Peoria            | IL     | East-North-Central  | 3046.0      | 115070.0    | 26.5           |
| Las Vegas         | NV     | Mountain            | 16294.0     | 623747.0    | 26.1           |
| Sacramento        | CA     | Pacific             | 12056.0     | 490712.0    | 24.6           |
| Canton            | OH     | East-North-Central  | 1757.0      | 71885.0     | 24.4           |
| Mobile            | AL     | East-South-Central  | 4675.0      | 194288.0    | 24.1           |
| Hartford          | CT     | New-England         | 2947.0      | 124006.0    | 23.8           |
| Lansing           | MI     | East-North-Central  | 2696.0      | 115056.0    | 23.4           |
| Ogden             | UT     | Mountain            | 1964.0      | 85444.0     | 23.0           |
| Evansville        | IN     | East-North-Central  | 2735.0      | 119943.0    | 22.8           |
| Savannah          | GA     | South-Atlantic      | 3248.0      | 145674.0    | 22.3           |
| Rockford          | IL     | East-North-Central  | 3262.0      | 148278.0    | 22.0           |
| Baton Rouge       | LA     | West-South-Central  | 5002.0      | 228590.0    | 21.9           |
| Duluth            | MN     | West-North-Central  | 1717.0      | 86110.0     | 19.9           |
| Camden            | NJ     | Middle-Atlantic     | 1482.0      | 76119.0     | 19.5           |
| Providence        | RI     | New-England         | 3439.0      | 179207.0    | 19.2           |
| Reading           | PA     | Middle-Atlantic     | 1823.0      | 97879.0     | 18.6           |
| Spokane           | WA     | Pacific             | 3951.0      | 213272.0    | 18.5           |
| Worcester         | MA     | New-England         | 3397.0      | 184815.0    | 18.4           |
| Shreveport        | LA     | West-South-Central  | 3595.0      | 197204.0    | 18.2           |
| Toledo            | OH     | East-North-Central  | 5086.0      | 279789.0    | 18.2           |
| Scranton          | PA     | Middle-Atlantic     | 1399.0      | 77118.0     | 18.1           |
| Atlanta           | GA     | South-Atlantic      | 8288.0      | 463878.0    | 17.9           |
| Buffalo           | NY     | Middle-Atlantic     | 4607.0      | 258071.0    | 17.9           |
| Schenectady       | NY     | Middle-Atlantic     | 1165.0      | 65305.0     | 17.8           |
| Grand Rapids      | MI     | East-North-Central  | 3324.0      | 195097.0    | 17.0           |
| Tampa             | FL     | South-Atlantic      | 6255.0      | 369075.0    | 16.9           |
| Tucson            | AZ     | Mountain            | 8981.0      | 531641.0    | 16.9           |
| Tulsa             | OK     | West-South-Central  | 6795.0      | 403505.0    | 16.8           |
| Fort Wayne        | IN     | East-North-Central  | 4351.0      | 260326.0    | 16.7           |
| Boise             | ID     | Mountain            | 3431.0      | 218281.0    | 15.7           |
| Columbus          | OH     | East-North-Central  | 13046.0     | 850106.0    | 15.3           |
| Saint Louis       | MO     | West-North-Central  | 4821.0      | 315685.0    | 15.3           |
| Memphis           | TN     | East-South-Central  | 9888.0      | 655770.0    | 15.1           |
| Fall River        | MA     | New-England         | 1328.0      | 88777.0     | 15.0           |
| Pueblo            | CO     | Mountain            | 1624.0      | 109412.0    | 14.8           |
| Waterbury         | CT     | New-England         | 1577.0      | 108802.0    | 14.5           |
| New Haven         | CT     | New-England         | 1887.0      | 130322.0    | 14.5           |
| Lexington         | KY     | East-South-Central  | 4539.0      | 314488.0    | 14.4           |
| Akron             | OH     | East-North-Central  | 2839.0      | 197542.0    | 14.4           |
| Montgomery        | AL     | East-South-Central  | 2862.0      | 200602.0    | 14.3           |
| Cincinnati        | OH     | East-North-Central  | 4240.0      | 298550.0    | 14.2           |
| Saint Petersburg  | FL     | South-Atlantic      | 3481.0      | 257083.0    | 13.5           |
| Nashville         | TN     | East-South-Central  | 8806.0      | 654610.0    | 13.5           |
| Fresno            | CA     | Pacific             | 6954.0      | 520052.0    | 13.4           |
| Richmond          | VA     | South-Atlantic      | 2938.0      | 220289.0    | 13.3           |
| Allentown         | PA     | Middle-Atlantic     | 1595.0      | 120207.0    | 13.3           |
| New Bedford       | MA     | New-England         | 1259.0      | 94958.0     | 13.3           |
| Utica             | NY     | Middle-Atlantic     | 800.0       | 61100.0     | 13.1           |
| Wichita           | KS     | West-North-Central  | 4937.0      | 389965.0    | 12.7           |
| Springfield       | MA     | New-England         | 1896.0      | 154341.0    | 12.3           |
| Kansas City       | MO     | West-North-Central  | 5654.0      | 475378.0    | 11.9           |
| Albuquerque       | NM     | Mountain            | 6649.0      | 559121.0    | 11.9           |
| Indianapolis      | IN     | East-North-Central  | 10079.0     | 853173.0    | 11.8           |
| Trenton           | NJ     | Middle-Atlantic     | 987.0       | 84225.0     | 11.7           |
| Baltimore         | MD     | South-Atlantic      | 7229.0      | 621849.0    | 11.6           |
| Omaha             | NE     | West-North-Central  | 5119.0      | 443885.0    | 11.5           |
| Detroit           | MI     | East-North-Central  | 7788.0      | 677116.0    | 11.5           |
| Boston            | MA     | New-England         | 7669.0      | 667137.0    | 11.5           |
| Lowell            | MA     | New-England         | 1212.0      | 110699.0    | 10.9           |
| Bridgeport        | CT     | New-England         | 1595.0      | 147629.0    | 10.8           |
| Honolulu          | HI     | Pacific             | 4323.0      | 402500.0    | 10.7           |
| San Jose          | CA     | Pacific             | 10894.0     | 1026908.0   | 10.6           |
| Portland          | OR     | Pacific             | 6707.0      | 632309.0    | 10.6           |
| Corpus Christi    | TX     | West-South-Central  | 3427.0      | 324074.0    | 10.6           |
| Saint Paul        | MN     | West-North-Central  | 3124.0      | 300851.0    | 10.4           |
| San Antonio       | TX     | West-South-Central  | 14858.0     | 1469845.0   | 10.1           |
| Kansas City       | KS     | West-North-Central  | 1521.0      | 151306.0    | 10.1           |
| Jacksonville      | FL     | South-Atlantic      | 8318.0      | 868031.0    | 9.6            |
| Glendale          | CA     | Pacific             | 1891.0      | 201020.0    | 9.4            |
| Norfolk           | VA     | South-Atlantic      | 2313.0      | 246393.0    | 9.4            |
| Lincoln           | NE     | West-North-Central  | 2571.0      | 277348.0    | 9.3            |
| Pasadena          | CA     | Pacific             | 1312.0      | 142250.0    | 9.2            |
| Charlotte         | NC     | South-Atlantic      | 7589.0      | 827097.0    | 9.2            |
| Wilimington       | DE     | South-Atlantic      | 651.0       | 71948.0     | 9.0            |
| Dallas            | TX     | West-South-Central  | 11252.0     | 1300092.0   | 8.7            |
| Minneapolis       | MN     | West-North-Central  | 3556.0      | 410939.0    | 8.7            |
| Colorado Springs  | CO     | Mountain            | 3902.0      | 456568.0    | 8.5            |
| New Orleans       | LA     | West-South-Central  | 3317.0      | 389617.0    | 8.5            |
| Gary              | IN     | East-North-Central  | 649.0       | 77156.0     | 8.4            |
| Washington        | DC     | South-Atlantic      | 5620.0      | 672228.0    | 8.4            |
| El Paso           | TX     | West-South-Central  | 5633.0      | 681124.0    | 8.3            |
| Miami             | FL     | South-Atlantic      | 3490.0      | 441003.0    | 7.9            |
| Houston           | TX     | West-South-Central  | 18294.0     | 2327463.0   | 7.9            |
| Long Beach        | CA     | Pacific             | 3348.0      | 474140.0    | 7.1            |
| Milwaukee         | WI     | East-North-Central  | 4228.0      | 600155.0    | 7.0            |
| Cambridge         | MA     | New-England         | 771.0       | 110402.0    | 7.0            |
| San Francisco     | CA     | Pacific             | 6013.0      | 864816.0    | 7.0            |
| Newark            | NJ     | Middle-Atlantic     | 1945.0      | 281944.0    | 6.9            |
| Elizabeth         | NJ     | Middle-Atlantic     | 859.0       | 129007.0    | 6.7            |
| Seattle           | WA     | Pacific             | 4551.0      | 684451.0    | 6.6            |
| San Diego         | CA     | Pacific             | 8897.0      | 1394928.0   | 6.4            |
| New York          | NY     | Middle-Atlantic     | 54301.0     | 8550405.0   | 6.4            |
| Denver            | CO     | Mountain            | 4264.0      | 682545.0    | 6.2            |
| Phoenix           | AZ     | Mountain            | 9480.0      | 1563025.0   | 6.1            |
| Berkeley          | CA     | Pacific             | 716.0       | 120971.0    | 5.9            |
| Austin            | TX     | West-South-Central  | 5150.0      | 931830.0    | 5.5            |
| Paterson          | NJ     | Middle-Atlantic     | 798.0       | 147754.0    | 5.4            |
| Chicago           | IL     | East-North-Central  | 14227.0     | 2720546.0   | 5.2            |
| Yonkers           | NY     | Middle-Atlantic     | 923.0       | 201116.0    | 4.6            |
| Lynn              | MA     | New-England         | 386.0       | 92457.0     | 4.2            |
| Pittsburgh        | PA     | Middle-Atlantic     | 1153.0      | 304391.0    | 3.8            |
| Jersey City       | NJ     | Middle-Atlantic     | 991.0       | 264290.0    | 3.7            |
| Los Angeles       | CA     | Pacific             | 13887.0     | 3971883.0   | 3.5            |
| Somerville        | MA     | New-England         | 177.0       | 80318.0     | 2.2            |
| Des Moines        | IA     | West-North-Central  | 0.0         | 210330.0    | 0.0            |
Of the 122 cities in the dataset, 95 have a higher mortality rate than the US average of 8.2. The highest 2015 mortality rate is in Youngstown, Ohio 54.5. Which is 6.56 times higher than the US national average and on par with the mortality rate in Lesotho, the highest in the world. Dayton, Ohio has a mortality rate of 52.1 which is much lower than in Youngstown.
Below is a table comparing population estimates for top six cities with the highest 2015 mortality rates.
| City | 1960 Population | 2015 Population | Population Change (%) |
|---|---|---|---|
| Youngstown | 166,689 | 64,628 | (-) 61.2 |
| Dayton | 262,332 | 140,599 | (-) 46.4 |
| Birmingham | 340,887 | 212,461 | (-) 37.7 |
| Salt Lake City | 189,454 | 192,672 | (+) 1.6 |
| Cleveland | 876,050 | 388,072 | (-) 55.7 |
| Rochester | 318,611 | 209,802 | (-) 34.2 |
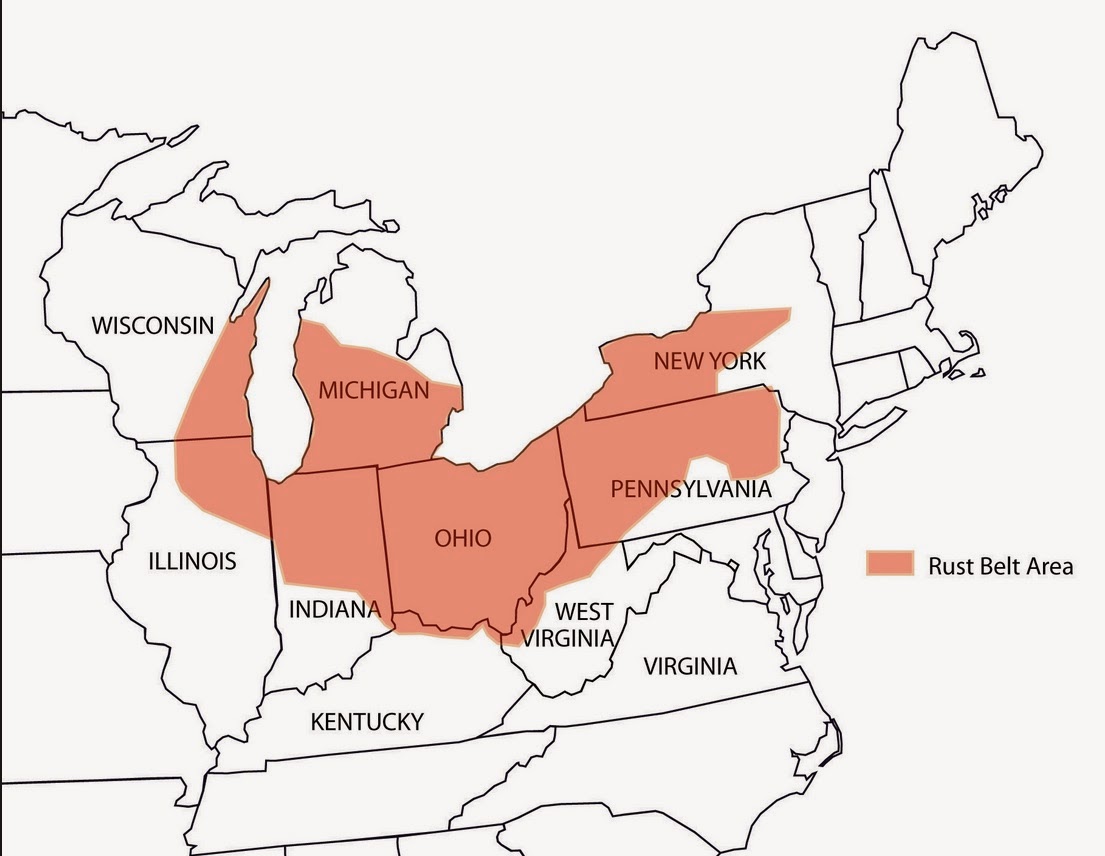
Four of these six cities are located in the infamous Rust Belt. According to geography.about.com,
the Rust Belt is an area of the United States which once served as the hub of American industry. In the early to mid 20th century, abundant natural resources led to thriving coal, steel,
and manufacturing industries. However, in the middle of the twentieth century many of these cities fell upon hard times, as manufacturing jobs went elsewhere or overseas, and populations began to decline as a result.
Along with Detroit, MI and Gary, IN, Youngstown, OH is often used to showcase the rise and fall of manufacturing in the United States. Youngstown was once a city where steel was king. Steel
dominated every aspect of life, and as this industry grew, Youngstown grew as well. According to the Hampton Institute, the
population of Youngstown grew from 33,000 in 1890 to 170,000 in 1930. Youngstown became the center of Mahoning Valley, which became to be known as "Steel Valley." By the thirties, Youngstown
ranked fifth in the nation with respect to home ownership. But the glory of Youngstown was short lived. According to encyclopedia.com:
"The U.S. worldwide market share of manufactured steel went from 20 percent in 1970 to 12 percent by 1990, and American employment in the industry dropped from 400,000 to 140,000 over the same period. Starting in the late 1970s, steel factories began closing. Among the hardest hit of the communities was Youngstown, Ohio, where the closure of three steel mills starting in 1977 eliminated nearly 10,000 high-paying jobs."
The loss of the manufacturing industry is devastating to Youngstown. Large swaths of the population moved out. Crime soared in the city. The crime rate in Youngstown in 2014 is 496.3, compared to 287.5 for the U.S. as a whole.
Data from census.gov compares Youngstown to overall United States trends:
- Persons without health insurance, under age 65 (percent): 15.0% vs 10.5%.
- Persons in poverty (percent): 38.3% vs 13.5%.
- Per capita income in past 12 months (in 2015 dollars), 2011-2015: $15,056 vs $28,930.
Mortality rates in New York City which has a relatively fixed population:
SELECT tot.datetime, tot.tags.city AS "city", tot.tags.state AS "state",
  ISNULL(LOOKUP('us-region', tot.tags.region), tot.tags.region) AS "region",
  sum(tot.value - t1.value - t24.value - t44.value - t64.value - t64o.value) AS "other_deaths",
  sum(t1.value) AS "infant_deaths",
  sum(t24.value) AS "1-24_deaths",
  sum(t44.value) AS "25-44_deaths",
  sum(t64.value) AS "45-64_deaths",
  sum(t64o.value) AS "64+_deaths",
  sum(tot.value) AS "all_deaths",
  cast(LOOKUP('city-size', concat(tot.tags.city, ',', tot.tags.state))) AS "population",
  sum(tot.value)/cast(LOOKUP('city-size', concat(tot.tags.city, ',', tot.tags.state)))*1000 AS "total_mortality_rate"
FROM cdc.all_deaths tot
  JOIN cdc._1_year t1
  JOIN cdc._1_24_years t24
  JOIN cdc._25_44_years t44
  JOIN cdc._54_64_years t64
  JOIN cdc._65_years t64o
  WHERE tot.entity = 'mr8w-325u' and tot.tags.city IS NOT NULL
  AND tot.datetime >= '1970-01-01T00:00:00Z' AND tot.datetime < '2016-01-01T00:00:00Z'
  and tot.tags.city = 'New York'
GROUP BY tot.tags, tot.period(1 year)
  HAVING sum(tot.value) > 0
ORDER BY tot.tags.city, tot.datetime
- Multiple metrics are joined to provide a breakdown of all deaths by age group, using the
JOINclause. - Observations are grouped by a period of one year to view total number of deaths in each age group in a given year.
- The total mortality rate is calculated by dividing the number of all deaths by the 2015 New York City population size, which is retrieved from a replacement table for 2015 to simplify the query.
- The data is limited to one city in the
WHEREclause. - The timespan is limited to
2016-01-01to exclude in complete 2016 data. other_deathsis included to account for deaths which are not included in any of the age groups but are included in theall_deaths. This may be for instances when the age of a person is unknown.
| tot.datetime              | city      | state  | region           | other_deaths  | infant_deaths  | 1-24_deaths  | 25-44_deaths  | 45-64_deaths  | 64+_deaths  | all_deaths  | population  | total_mortality_rate |
|---------------------------|-----------|--------|------------------|---------------|----------------|--------------|---------------|---------------|-------------|-------------|-------------|----------------------|
| 1970-01-01T00:00:00.000Z  | New York  | NY     | Middle-Atlantic  | 0.0           | 3243.0         | 2966.0       | 6323.0        | 23540.0       | 52021.0     | 88093.0     | 8550405.0   | 10.3                 |
| 1971-01-01T00:00:00.000Z  | New York  | NY     | Middle-Atlantic  | 0.0           | 2748.0         | 3140.0       | 6242.0        | 22769.0       | 51816.0     | 86715.0     | 8550405.0   | 10.1                 |
| 1972-01-01T00:00:00.000Z  | New York  | NY     | Middle-Atlantic  | 0.0           | 2333.0         | 3079.0       | 6182.0        | 22429.0       | 52436.0     | 86459.0     | 8550405.0   | 10.1                 |
| 1973-01-01T00:00:00.000Z  | New York  | NY     | Middle-Atlantic  | 0.0           | 2201.0         | 2947.0       | 5896.0        | 20727.0       | 50474.0     | 82245.0     | 8550405.0   | 9.6                  |
| 1974-01-01T00:00:00.000Z  | New York  | NY     | Middle-Atlantic  | 0.0           | 2117.0         | 2704.0       | 5460.0        | 19589.0       | 49867.0     | 79737.0     | 8550405.0   | 9.3                  |
| 1975-01-01T00:00:00.000Z  | New York  | NY     | Middle-Atlantic  | 0.0           | 2143.0         | 2377.0       | 5359.0        | 18781.0       | 47390.0     | 76050.0     | 8550405.0   | 8.9                  |
| 1976-01-01T00:00:00.000Z  | New York  | NY     | Middle-Atlantic  | 0.0           | 2048.0         | 2259.0       | 5287.0        | 18517.0       | 49016.0     | 77127.0     | 8550405.0   | 9.0                  |
| 1977-01-01T00:00:00.000Z  | New York  | NY     | Middle-Atlantic  | 0.0           | 1977.0         | 2143.0       | 5206.0        | 18170.0       | 48585.0     | 76081.0     | 8550405.0   | 8.9                  |
| 1978-01-01T00:00:00.000Z  | New York  | NY     | Middle-Atlantic  | 0.0           | 1824.0         | 1958.0       | 4954.0        | 17231.0       | 47020.0     | 72987.0     | 8550405.0   | 8.5                  |
| 1979-01-01T00:00:00.000Z  | New York  | NY     | Middle-Atlantic  | 0.0           | 1750.0         | 2047.0       | 4863.0        | 16566.0       | 46451.0     | 71677.0     | 8550405.0   | 8.4                  |
| 1980-01-01T00:00:00.000Z  | New York  | NY     | Middle-Atlantic  | 0.0           | 1683.0         | 2022.0       | 5363.0        | 16714.0       | 49927.0     | 75709.0     | 8550405.0   | 8.9                  |
| 1981-01-01T00:00:00.000Z  | New York  | NY     | Middle-Atlantic  | 0.0           | 1692.0         | 2013.0       | 5476.0        | 16240.0       | 48500.0     | 73921.0     | 8550405.0   | 8.6                  |
| 1982-01-01T00:00:00.000Z  | New York  | NY     | Middle-Atlantic  | 0.0           | 1679.0         | 1913.0       | 5517.0        | 15956.0       | 47850.0     | 72915.0     | 8550405.0   | 8.5                  |
| 1983-01-01T00:00:00.000Z  | New York  | NY     | Middle-Atlantic  | 0.0           | 1637.0         | 1903.0       | 5962.0        | 15939.0       | 49259.0     | 74700.0     | 8550405.0   | 8.7                  |
| 1984-01-01T00:00:00.000Z  | New York  | NY     | Middle-Atlantic  | 0.0           | 1536.0         | 1762.0       | 6377.0        | 15590.0       | 48246.0     | 73511.0     | 8550405.0   | 8.6                  |
| 1985-01-01T00:00:00.000Z  | New York  | NY     | Middle-Atlantic  | 0.0           | 1546.0         | 1732.0       | 7327.0        | 15644.0       | 48232.0     | 74481.0     | 8550405.0   | 8.7                  |
| 1986-01-01T00:00:00.000Z  | New York  | NY     | Middle-Atlantic  | 0.0           | 1638.0         | 1848.0       | 8303.0        | 15371.0       | 48443.0     | 75603.0     | 8550405.0   | 8.8                  |
| 1987-01-01T00:00:00.000Z  | New York  | NY     | Middle-Atlantic  | 0.0           | 1599.0         | 1857.0       | 9098.0        | 15451.0       | 48280.0     | 76285.0     | 8550405.0   | 8.9                  |
| 1988-01-01T00:00:00.000Z  | New York  | NY     | Middle-Atlantic  | 0.0           | 1759.0         | 2047.0       | 9654.0        | 15569.0       | 49694.0     | 78723.0     | 8550405.0   | 9.2                  |
| 1989-01-01T00:00:00.000Z  | New York  | NY     | Middle-Atlantic  | 0.0           | 1824.0         | 1895.0       | 9993.0        | 14828.0       | 47239.0     | 75779.0     | 8550405.0   | 8.9                  |
| 1990-01-01T00:00:00.000Z  | New York  | NY     | Middle-Atlantic  | 0.0           | 1614.0         | 1925.0       | 9711.0        | 14318.0       | 46140.0     | 73708.0     | 8550405.0   | 8.6                  |
| 1991-01-01T00:00:00.000Z  | New York  | NY     | Middle-Atlantic  | 1.0           | 1570.0         | 1901.0       | 9799.0        | 13687.0       | 44154.0     | 71112.0     | 8550405.0   | 8.3                  |
| 1992-01-01T00:00:00.000Z  | New York  | NY     | Middle-Atlantic  | 0.0           | 1420.0         | 1759.0       | 9795.0        | 13942.0       | 43903.0     | 70819.0     | 8550405.0   | 8.3                  |
| 1993-01-01T00:00:00.000Z  | New York  | NY     | Middle-Atlantic  | 2.0           | 1350.0         | 1737.0       | 9616.0        | 14057.0       | 46109.0     | 72871.0     | 8550405.0   | 8.5                  |
| 1994-01-01T00:00:00.000Z  | New York  | NY     | Middle-Atlantic  | 6.0           | 1300.0         | 1582.0       | 10043.0       | 14323.0       | 45169.0     | 72423.0     | 8550405.0   | 8.5                  |
| 1995-01-01T00:00:00.000Z  | New York  | NY     | Middle-Atlantic  | 2.0           | 1186.0         | 1453.0       | 9163.0        | 14193.0       | 44633.0     | 70630.0     | 8550405.0   | 8.3                  |
| 1996-01-01T00:00:00.000Z  | New York  | NY     | Middle-Atlantic  | 2.0           | 1017.0         | 1189.0       | 7227.0        | 13284.0       | 43674.0     | 66393.0     | 8550405.0   | 7.8                  |
| 1997-01-01T00:00:00.000Z  | New York  | NY     | Middle-Atlantic  | 1.0           | 924.0          | 1097.0       | 5536.0        | 12204.0       | 42941.0     | 62703.0     | 8550405.0   | 7.3                  |
| 1998-01-01T00:00:00.000Z  | New York  | NY     | Middle-Atlantic  | 0.0           | 862.0          | 997.0        | 4755.0        | 12133.0       | 42190.0     | 60937.0     | 8550405.0   | 7.1                  |
| 1999-01-01T00:00:00.000Z  | New York  | NY     | Middle-Atlantic  | 12.0          | 863.0          | 1044.0       | 4487.0        | 12304.0       | 43258.0     | 61968.0     | 8550405.0   | 7.2                  |
| 2000-01-01T00:00:00.000Z  | New York  | NY     | Middle-Atlantic  | 48.0          | 857.0          | 1000.0       | 4536.0        | 12383.0       | 43139.0     | 61963.0     | 8550405.0   | 7.2                  |
| 2001-01-01T00:00:00.000Z  | New York  | NY     | Middle-Atlantic  | 46.0          | 745.0          | 1107.0       | 5916.0        | 13192.0       | 41486.0     | 62492.0     | 8550405.0   | 7.3                  |
| 2002-01-01T00:00:00.000Z  | New York  | NY     | Middle-Atlantic  | 23.0          | 756.0          | 953.0        | 4304.0        | 12310.0       | 41361.0     | 59707.0     | 8550405.0   | 7.0                  |
| 2003-01-01T00:00:00.000Z  | New York  | NY     | Middle-Atlantic  | 180.0         | 775.0          | 951.0        | 3829.0        | 11982.0       | 39902.0     | 57619.0     | 8550405.0   | 6.7                  |
| 2004-01-01T00:00:00.000Z  | New York  | NY     | Middle-Atlantic  | 102.0         | 780.0          | 954.0        | 3605.0        | 12295.0       | 40762.0     | 58498.0     | 8550405.0   | 6.8                  |
| 2005-01-01T00:00:00.000Z  | New York  | NY     | Middle-Atlantic  | 53.0          | 774.0          | 988.0        | 3494.0        | 12387.0       | 40799.0     | 58495.0     | 8550405.0   | 6.8                  |
| 2006-01-01T00:00:00.000Z  | New York  | NY     | Middle-Atlantic  | 56.0          | 734.0          | 858.0        | 3311.0        | 11761.0       | 38562.0     | 55282.0     | 8550405.0   | 6.5                  |
| 2007-01-01T00:00:00.000Z  | New York  | NY     | Middle-Atlantic  | 63.0          | 677.0          | 798.0        | 3074.0        | 11692.0       | 37510.0     | 53814.0     | 8550405.0   | 6.3                  |
| 2008-01-01T00:00:00.000Z  | New York  | NY     | Middle-Atlantic  | 31.0          | 692.0          | 827.0        | 2939.0        | 11682.0       | 37371.0     | 53542.0     | 8550405.0   | 6.3                  |
| 2009-01-01T00:00:00.000Z  | New York  | NY     | Middle-Atlantic  | 19.0          | 690.0          | 793.0        | 2793.0        | 11547.0       | 36891.0     | 52733.0     | 8550405.0   | 6.2                  |
| 2010-01-01T00:00:00.000Z  | New York  | NY     | Middle-Atlantic  | 20.0          | 596.0          | 811.0        | 2571.0        | 11513.0       | 36953.0     | 52464.0     | 8550405.0   | 6.1                  |
| 2011-01-01T00:00:00.000Z  | New York  | NY     | Middle-Atlantic  | 23.0          | 585.0          | 799.0        | 2664.0        | 11700.0       | 38066.0     | 53837.0     | 8550405.0   | 6.3                  |
| 2012-01-01T00:00:00.000Z  | New York  | NY     | Middle-Atlantic  | 19.0          | 584.0          | 779.0        | 2549.0        | 11312.0       | 37094.0     | 52337.0     | 8550405.0   | 6.1                  |
| 2013-01-01T00:00:00.000Z  | New York  | NY     | Middle-Atlantic  | 10.0          | 575.0          | 748.0        | 2639.0        | 11383.0       | 38396.0     | 53751.0     | 8550405.0   | 6.3                  |
| 2014-01-01T00:00:00.000Z  | New York  | NY     | Middle-Atlantic  | 10.0          | 514.0          | 726.0        | 2524.0        | 11228.0       | 38227.0     | 53229.0     | 8550405.0   | 6.2                  |
| 2015-01-01T00:00:00.000Z  | New York  | NY     | Middle-Atlantic  | 11.0          | 517.0          | 727.0        | 2619.0        | 11118.0       | 39309.0     | 54301.0     | 8550405.0   | 6.4                  |
The mortality rate in the city has declined considerably since the seventies. According to their removed report on Population
and Mortality in 2010, the City of New York made following key findings:
- The 2010 New York City death rate reached a historic low of 6.4 deaths per 1,000 people in the population, a 14.7% decline since 2001.
- The 2009 New York City life expectancy reached a historic high of 80.6 years, a 3.7% (35 months) increase since 2000 and a 0.5% (5 months) increase since 2008.
- Premature deaths (before age 65) accounted for 30% of all deaths in New York City. The premature death rate decreased to 2.2 per 1,000 population, a 15.4% decline since 2001.
The death rate for 2010 that is found in the report (6.4) does not match the value from the SQL query result. This is due to using the fixed population size from 2015 to calculate all of the mortality rates. Since population numbers for 1960, 1970, 1980, 1990, 2000, 2010, and 2015 are available you can compute much more accurate mortality rates for New York City using interpolated population sizes.
SELECT tot.datetime, tot.tags.city AS "city", tot.tags.state AS "state",
  ISNULL(LOOKUP('us-region', tot.tags.region), tot.tags.region) AS "region",
  sum(tot.value - t1.value - t24.value - t44.value - t64.value - t64o.value) AS "other_deaths",
  sum(t1.value) AS "infant_deaths",
  sum(t24.value) AS "1-24_deaths",
  sum(t44.value) AS "25-44_deaths",
  sum(t64.value) AS "45-64_deaths",
  sum(t64o.value) AS "64+_deaths",
  sum(tot.value) AS "all_deaths",
  sum(tot.value)/avg(pop.value)*1000 AS "total_mortality_rate",
  last(pop.value) AS "population_end_of_year"
FROM cdc.all_deaths tot
  JOIN cdc._1_year t1
  JOIN cdc._1_24_years t24
  JOIN cdc._25_44_years t44
  JOIN cdc._54_64_years t64
  JOIN cdc._65_years t64o
  JOIN us.population pop
  WHERE tot.entity = 'mr8w-325u' and tot.tags.city IS NOT NULL
  AND tot.datetime >= '1970-01-01T00:00:00Z' AND tot.datetime < '2016-01-01T00:00:00Z'
  AND tot.tags.city = 'New York'
GROUP BY tot.tags, tot.period(1 year)
  HAVING sum(tot.value) > 0
WITH INTERPOLATE (1 WEEK, LINEAR, INNER, EXTEND, START_TIME)
  ORDER BY tot.datetime
| tot.datetime              | city      | state  | region           | other_deaths  | infant_deaths  | 1-24_deaths  | 25-44_deaths  | 45-64_deaths  | 64+_deaths  | all_deaths  | total_mortality_rate  | population_end_of_year |
|---------------------------|-----------|--------|------------------|---------------|----------------|--------------|---------------|---------------|-------------|-------------|-----------------------|------------------------|
| 1970-01-01T00:00:00.000Z  | New York  | NY     | Middle-Atlantic  | 0.0           | 3308.4         | 3030.9       | 6445.1        | 24068.3       | 53156.4     | 90009.1     | 11.5                  | 7812810.2              |
| 1971-01-01T00:00:00.000Z  | New York  | NY     | Middle-Atlantic  | 0.0           | 2733.0         | 3135.7       | 6243.4        | 22721.1       | 51819.6     | 86652.9     | 11.2                  | 7730758.4              |
| 1972-01-01T00:00:00.000Z  | New York  | NY     | Middle-Atlantic  | -0.0          | 2290.6         | 3016.4       | 6059.9        | 21980.9       | 51333.0     | 84680.7     | 11.0                  | 7648706.6              |
| 1973-01-01T00:00:00.000Z  | New York  | NY     | Middle-Atlantic  | -0.0          | 2202.1         | 2948.7       | 5897.4        | 20740.7       | 50485.7     | 82274.7     | 10.8                  | 7566654.8              |
| 1974-01-01T00:00:00.000Z  | New York  | NY     | Middle-Atlantic  | 0.0           | 2119.0         | 2704.0       | 5465.7        | 19597.0       | 49888.4     | 79774.1     | 10.6                  | 7484603.0              |
| 1975-01-01T00:00:00.000Z  | New York  | NY     | Middle-Atlantic  | 0.0           | 2146.4         | 2384.4       | 5360.1        | 18778.4       | 47432.9     | 76102.3     | 10.2                  | 7402551.2              |
| 1976-01-01T00:00:00.000Z  | New York  | NY     | Middle-Atlantic  | 0.0           | 2083.1         | 2299.6       | 5384.4        | 18871.0       | 49944.4     | 78582.6     | 10.7                  | 7318921.5              |
| 1977-01-01T00:00:00.000Z  | New York  | NY     | Middle-Atlantic  | 0.0           | 1941.0         | 2097.0       | 5103.7        | 17823.1       | 47567.4     | 74532.3     | 10.2                  | 7236869.7              |
| 1978-01-01T00:00:00.000Z  | New York  | NY     | Middle-Atlantic  | 0.0           | 1820.9         | 1956.9       | 4958.0        | 17235.0       | 47058.6     | 73029.3     | 10.1                  | 7154817.9              |
| 1979-01-01T00:00:00.000Z  | New York  | NY     | Middle-Atlantic  | 0.0           | 1750.3         | 2052.7       | 4866.1        | 16573.1       | 46461.3     | 71703.6     | 10.1                  | 7072766.1              |
| 1980-01-01T00:00:00.000Z  | New York  | NY     | Middle-Atlantic  | -0.0          | 1689.6         | 2022.0       | 5356.4        | 16704.0       | 49884.4     | 75656.4     | 10.7                  | 7096298.8              |
| 1981-01-01T00:00:00.000Z  | New York  | NY     | Middle-Atlantic  | 0.0           | 1718.6         | 2053.0       | 5597.0        | 16558.6       | 49466.3     | 75393.4     | 10.6                  | 7121782.8              |
| 1982-01-01T00:00:00.000Z  | New York  | NY     | Middle-Atlantic  | 0.0           | 1678.3         | 1915.9       | 5512.7        | 15949.6       | 47842.1     | 72898.6     | 10.2                  | 7146786.0              |
| 1983-01-01T00:00:00.000Z  | New York  | NY     | Middle-Atlantic  | 0.0           | 1610.6         | 1858.4       | 5841.9        | 15637.1       | 48305.4     | 73253.4     | 10.2                  | 7171789.2              |
| 1984-01-01T00:00:00.000Z  | New York  | NY     | Middle-Atlantic  | -0.0          | 1533.4         | 1762.3       | 6377.3        | 15591.7       | 48276.9     | 73541.6     | 10.2                  | 7196792.4              |
| 1985-01-01T00:00:00.000Z  | New York  | NY     | Middle-Atlantic  | -0.0          | 1549.1         | 1734.3       | 7321.9        | 15642.9       | 48260.0     | 74508.1     | 10.3                  | 7221795.6              |
| 1986-01-01T00:00:00.000Z  | New York  | NY     | Middle-Atlantic  | -0.0          | 1637.1         | 1848.0       | 8301.9        | 15372.4       | 48441.9     | 75601.3     | 10.5                  | 7246798.8              |
| 1987-01-01T00:00:00.000Z  | New York  | NY     | Middle-Atlantic  | -0.0          | 1626.4         | 1889.0       | 9261.3        | 15718.7       | 49197.3     | 77692.7     | 10.7                  | 7272282.8              |
| 1988-01-01T00:00:00.000Z  | New York  | NY     | Middle-Atlantic  | -0.0          | 1725.9         | 2010.4       | 9474.4        | 15291.0       | 48707.3     | 77209.0     | 10.6                  | 7297286.0              |
| 1989-01-01T00:00:00.000Z  | New York  | NY     | Middle-Atlantic  | 0.0           | 1829.4         | 1897.3       | 9993.6        | 14844.9       | 47276.7     | 75841.9     | 10.4                  | 7322289.2              |
| 1990-01-01T00:00:00.000Z  | New York  | NY     | Middle-Atlantic  | -0.0          | 1613.7         | 1929.3       | 9725.6        | 14329.1       | 46202.3     | 73800.0     | 10.0                  | 7390160.0              |
| 1991-01-01T00:00:00.000Z  | New York  | NY     | Middle-Atlantic  | 1.0           | 1589.7         | 1927.7       | 9960.9        | 13868.1       | 44775.5     | 72122.9     | 9.7                   | 7458507.1              |
| 1992-01-01T00:00:00.000Z  | New York  | NY     | Middle-Atlantic  | 0.0           | 1442.6         | 1793.4       | 9983.9        | 14211.3       | 44777.1     | 72208.3     | 9.6                   | 7528168.5              |
| 1993-01-01T00:00:00.000Z  | New York  | NY     | Middle-Atlantic  | 2.0           | 1352.9         | 1729.9       | 9605.3        | 14034.1       | 46086.1     | 72810.3     | 9.6                   | 7596515.6              |
| 1994-01-01T00:00:00.000Z  | New York  | NY     | Middle-Atlantic  | 5.7           | 1275.1         | 1555.9       | 9859.4        | 14063.7       | 44272.6     | 71032.4     | 9.3                   | 7664862.7              |
| 1995-01-01T00:00:00.000Z  | New York  | NY     | Middle-Atlantic  | 2.3           | 1184.6         | 1451.6       | 9168.1        | 14184.7       | 44663.9     | 70655.1     | 9.2                   | 7733209.8              |
| 1996-01-01T00:00:00.000Z  | New York  | NY     | Middle-Atlantic  | 2.0           | 1019.3         | 1192.4       | 7242.1        | 13315.1       | 43686.0     | 66457.0     | 8.6                   | 7801556.9              |
| 1997-01-01T00:00:00.000Z  | New York  | NY     | Middle-Atlantic  | 1.0           | 924.6          | 1093.3       | 5534.6        | 12196.6       | 42932.1     | 62682.1     | 8.0                   | 7869903.9              |
| 1998-01-01T00:00:00.000Z  | New York  | NY     | Middle-Atlantic  | 0.0           | 878.3          | 1022.7       | 4844.7        | 12377.6       | 43105.3     | 62228.6     | 7.9                   | 7939565.4              |
| 1999-01-01T00:00:00.000Z  | New York  | NY     | Middle-Atlantic  | 12.7          | 860.1          | 1036.1       | 4495.6        | 12292.6       | 43233.0     | 61930.1     | 7.8                   | 8007912.5              |
| 2000-01-01T00:00:00.000Z  | New York  | NY     | Middle-Atlantic  | 47.3          | 843.6          | 985.3        | 4447.4        | 12154.1       | 42285.3     | 60763.0     | 7.6                   | 8024821.8              |
| 2001-01-01T00:00:00.000Z  | New York  | NY     | Middle-Atlantic  | 46.0          | 745.9          | 1108.1       | 5919.7        | 13201.1       | 41514.9     | 62535.7     | 7.8                   | 8041446.9              |
| 2002-01-01T00:00:00.000Z  | New York  | NY     | Middle-Atlantic  | 23.0          | 756.6          | 951.9        | 4304.3        | 12306.3       | 41349.3     | 59691.3     | 7.4                   | 8058072.0              |
| 2003-01-01T00:00:00.000Z  | New York  | NY     | Middle-Atlantic  | 179.7         | 776.7          | 953.0        | 3831.0        | 12000.0       | 39965.7     | 57706.1     | 7.2                   | 8074697.2              |
| 2004-01-01T00:00:00.000Z  | New York  | NY     | Middle-Atlantic  | 102.3         | 788.1          | 963.9        | 3658.3        | 12441.9       | 41312.7     | 59267.1     | 7.3                   | 8091642.0              |
| 2005-01-01T00:00:00.000Z  | New York  | NY     | Middle-Atlantic  | 52.7          | 764.4          | 976.7        | 3438.4        | 12212.4       | 40139.4     | 57584.1     | 7.1                   | 8108267.1              |
| 2006-01-01T00:00:00.000Z  | New York  | NY     | Middle-Atlantic  | 56.3          | 734.0          | 859.4        | 3313.3        | 11772.4       | 38617.7     | 55353.1     | 6.8                   | 8124892.2              |
| 2007-01-01T00:00:00.000Z  | New York  | NY     | Middle-Atlantic  | 62.4          | 677.6          | 798.0        | 3076.3        | 11694.9       | 37520.0     | 53829.1     | 6.6                   | 8141517.4              |
| 2008-01-01T00:00:00.000Z  | New York  | NY     | Middle-Atlantic  | 31.6          | 692.6          | 828.4        | 2943.3        | 11696.0       | 37425.6     | 53617.4     | 6.6                   | 8158142.5              |
| 2009-01-01T00:00:00.000Z  | New York  | NY     | Middle-Atlantic  | 19.0          | 692.7          | 807.1        | 2836.1        | 11716.9       | 37429.6     | 53501.4     | 6.6                   | 8175087.3              |
| 2010-01-01T00:00:00.000Z  | New York  | NY     | Middle-Atlantic  | 20.7          | 598.9          | 802.4        | 2558.9        | 11485.9       | 36858.0     | 52324.7     | 6.4                   | 8249735.3              |
| 2011-01-01T00:00:00.000Z  | New York  | NY     | Middle-Atlantic  | 22.3          | 578.3          | 791.1        | 2633.6        | 11540.1       | 37567.6     | 53133.0     | 6.4                   | 8324543.0              |
| 2012-01-01T00:00:00.000Z  | New York  | NY     | Middle-Atlantic  | 19.0          | 583.4          | 779.9        | 2542.7        | 11310.9       | 37090.3     | 52326.1     | 6.3                   | 8399350.8              |
| 2013-01-01T00:00:00.000Z  | New York  | NY     | Middle-Atlantic  | 10.0          | 576.4          | 749.4        | 2642.7        | 11387.9       | 38398.9     | 53765.3     | 6.4                   | 8474158.6              |
| 2014-01-01T00:00:00.000Z  | New York  | NY     | Middle-Atlantic  | 10.0          | 514.6          | 722.9        | 2520.0        | 11219.1       | 38195.9     | 53182.4     | 6.2                   | 8548966.4              |
| 2015-01-01T00:00:00.000Z  | New York  | NY     | Middle-Atlantic  | 11.0          | 527.3          | 742.1        | 2680.3        | 11335.9       | 40083.7     | 55380.3     | 6.5                   | 8550405.0              |
Using interpolated population numbers, the death rate value for 2010 (6.4) matches the one found in the report by the City of New York.
Since numbers for us.population and the CDC metrics are collected at different frequencies (10 year compared to 1 week), they have different collection periods. Therefore, it is necessary to
calculate intermediate population values to match the frequency of the CDC metrics. The WITH INTERPOLATE clause is set to 1 week to match the population periods to those of the
CDC metrics. Read more about interpolation in SQL Documentation.
SELECT datetime, value
 FROM us.population pop
WHERE tags.city = 'New York'
 ORDER BY datetime
This interpolation function provides weekly estimates based on linear regression between neighboring points:
SELECT datetime, value
 FROM us.population pop
WHERE tags.city = 'New York'
WITH INTERPOLATE (1 WEEK, LINEAR, INNER, EXTEND, START_TIME)
 ORDER BY datetime
LIMIT 5
Determine mortality rate by age group in New York City using age group population statistics from nyc.gov
as part of the 2010 U.S. census. The new-york-city-2010-population file can be found in the Resources directory.
SELECT CAST(LOOKUP('new-york-city-2010-population', 'total')) AS "population",
  sum(t1.value) AS "infant_deaths",
  sum(t24.value) AS "1-24_deaths",
  sum(t44.value) AS "25-44_deaths",
  sum(t64.value) AS "45-64_deaths",
  sum(t65.value) AS "65+_deaths",
  sum(tot.value) AS "all_deaths",
  sum(t1.value)/CAST(LOOKUP('new-york-city-2010-population', 'under-1'))*1000 AS "infant_mortality_rate",
  sum(t24.value)/CAST(LOOKUP('new-york-city-2010-population', '1-24'))*1000 AS "1-24_mortality_rate",
  sum(t44.value)/CAST(LOOKUP('new-york-city-2010-population', '25-44'))*1000 AS "25-44_mortality_rate",
  sum(t64.value)/CAST(LOOKUP('new-york-city-2010-population', '45-64'))*1000 AS "45-64_mortality_rate",
  sum(t65.value)/CAST(LOOKUP('new-york-city-2010-population', '65+'))*1000 AS "65+_mortality_rate",
  sum(tot.value)/CAST(LOOKUP('new-york-city-2010-population', 'total'))*1000 AS "total_mortality_rate"
FROM cdc.all_deaths tot
  JOIN cdc._1_year t1
  JOIN cdc._1_24_years t24
  JOIN cdc._25_44_years t44
  JOIN cdc._54_64_years t64
  JOIN cdc._65_years t65
WHERE tot.entity = 'mr8w-325u'
  AND tot.datetime >= '2010-01-01T00:00:00Z' AND tot.datetime < '2011-01-01T00:00:00Z'
  AND tot.tags.city = 'New York'
GROUP BY tot.period(1 YEAR)
| population  | infant_deaths  | 1-24_deaths  | 25-44_deaths  | 45-64_deaths  | 65+_deaths  | all_deaths  | infant_mortality_rate  | 1-24_mortality_rate  | 25-44_mortality_rate  | 45-64_mortality_rate  | 65+_mortality_rate  | total_mortality_rate |
|-------------|----------------|--------------|---------------|---------------|-------------|-------------|------------------------|----------------------|-----------------------|-----------------------|---------------------|----------------------|
| 8175133.0   | 596.0          | 811.0        | 2571.0        | 11513.0       | 36953.0     | 52464.0     | 5.5                    | 0.3                  | 1.1                   | 5.8                   | 37.2                | 6.4                  |
- All metrics with death numbers are joined by year using the
SUMaggregation function. SUMaggregation is divided by the size of the corresponding age group, retrieved with aLOOKUPfunction, and multiplied by 1,000 since mortality is measured in deaths per 1,000 people.
The query below calculates mortality rates by age group in Youngstown. Population figures are available from places.mooseroots.com
as part of the 2010 U.S. Census. The youngstown-2010-population file is available in the Resources directory.
SELECT CAST(LOOKUP('youngstown-2010-population', 'total')) AS "population",
  sum(t24.value+t1.value) AS "0-24_deaths",
  sum(t44.value) AS "25-44_deaths",
  sum(t64.value) AS "45-64_deaths",
  sum(t65.value) AS "65+_deaths",
  sum(tot.value) AS "all_deaths",
  sum(t24.value+t1.value)/CAST(LOOKUP('youngstown-2010-population', '1-24'))*1000 AS "1-24_mortality_rate",
  sum(t44.value)/CAST(LOOKUP('youngstown-2010-population', '25-44'))*1000 AS "25-44_mortality_rate",
  sum(t64.value)/CAST(LOOKUP('youngstown-2010-population', '45-64'))*1000 AS "45-64_mortality_rate",
  sum(t65.value)/CAST(LOOKUP('youngstown-2010-population', '65+'))*1000 AS "65+_mortality_rate",
  sum(tot.value)/CAST(LOOKUP('youngstown-2010-population', 'total'))*1000 AS "total_mortality_rate"
FROM cdc.all_deaths tot
  OUTER JOIN cdc._1_year t1
  OUTER JOIN cdc._1_24_years t24
  OUTER JOIN cdc._25_44_years t44
  OUTER JOIN cdc._54_64_years t64
  OUTER JOIN cdc._65_years t65
WHERE tot.entity = 'mr8w-325u'
  AND tot.datetime >= '2010-01-01T00:00:00Z' AND tot.datetime < '2011-01-01T00:00:00Z'
  AND tot.tags.city = 'Youngstown'
GROUP BY tot.period(1 YEAR)
| population  | 0-24_deaths  | 25-44_deaths  | 45-64_deaths  | 65+_deaths  | all_deaths  | 1-24_mortality_rate  | 25-44_mortality_rate  | 45-64_mortality_rate  | 65+_mortality_rate  | total_mortality_rate |
|-------------|--------------|---------------|---------------|-------------|-------------|----------------------|-----------------------|-----------------------|---------------------|----------------------|
| 66982.0     | 16.0         | 40.0          | 493.0         | 2461.0      | 3039.0      | 0.7                  | 2.6                   | 27.5                  | 223.4               | 45.4                 |
Mortality rates are higher in Youngstown than New York City in almost every age group.
| Mortality Rate | New York City | Youngstown |
|---|---|---|
| Infant | 5.5 | 0.0** |
| 1 to 24 years | 0.3 | 0.7 |
| 25 to 44 years | 1.1 | 2.6 |
| 45 to 64 years | 5.8 | 27.5 |
| 65+ years | 37.2 | 223.4 |
| total | 6.5 | 45.4 |
Figures for the population under the age of 1 year in Youngstown are not available, as such it is impossible to calculate infant mortality rate. Thus the value, for the 1-24 age group for Youngstown is a little higher reality.
What can explain these unbelievably high rates in Youngstown? This is a complicated, multi-layered issue, some experts spend years analyzing such questions.
Two factors that may affect these high rates are the aging population, above average rates for a number of diseases. Below is a table comparing incident rates for 6 diseases in Mahoning County versus the United States as a whole.
| Rate (# Deaths / 100,000 Population) | Mahoning County (Youngstown) | United States |
|---|---|---|
| Heart Disease | 203.6 | 167.0 |
| Cancer | 190.5 | 171.2 |
| Chronic Lower Respiratory Disease | 47.7 | 46.1 |
| Stroke | 49.9 | 41.7 |
| Unintentional Injury (Accident) | 50.7 | 42.7 |
| Alzheimer's Disease | 30.8 | 29.8 |
Youngstown has higher incident rates for each disease. Additionally, according to the 2010 U.S. Census, the percentage of residents age 65 and older in Youngstown versus the United States is 16.44% versus 12.75%. Along with a struggling economy and high poverty and crime rates, probably result in Youngstown having such significant mortality rates.
Action Items
Recreate this experiment in a local ATSD instance:
Install Docker according to the Official Installation Instructions.
Download the
docker-compose.ymlfile to launch the ATSD Collector container bundle.curl -o docker-compose.yml https://raw.githubusercontent.com/axibase/atsd-use-cases/master/research/us-mortality/resources/docker-compose.ymlIn the console, launch containers:
export C_USER=myuser; export C_PASSWORD=mypassword; docker-compose pull && docker-compose up -dImport the
parser.xmlfile into ATSD.Import the
us.population.csvinto ATSD.Import the
city-size,us-regions,new-york-city-2010-population, andyoungstown-2010-populationreplacement tables into ATSD.Open the SQL tab and select Console.
For complete installation instructions, see the ATSD Documentation.