Using Thresholds to Track United States Inflation

Overview
Inflation is an oft-debated topic which many experts claim is a necessary part of a growing economy. At its core, inflation is a measure of the change in the cost of goods and services. High-inflation economies see steep and sometimes untenable increases in their cost of living and money supply without corresponding growth in gross domestic product (GDP) and wages. Prolonged or unmanageable inflation sometimes results in a trend known as hyperinflation, whereby the money supply is increased to such a degree that the use of the currency of the country becomes impractical due to the outrageous costs associated with even simple, everyday purchases. The wholesale price index (WPI), which is a measure of the cost of a representative basket of wholesale goods in a particular economic system, for the Weimar Republic is shown in the years after German defeat in World War I.
| Date | WPI Value |
|---|---|
| July 1922 | 100.6 |
| Jan 1923 | 2,785.0 |
| July 1923 | 194,000.0 |
| Nov 1923 | 726,000,000,000.0 |
The hyperinflation documented during 1920s Germany created the economic desperation which resulted in the 1929-1930 German Great Depression that many historians credit as being among the main reasons for the meteoric rise of the National Socialist Party, who had won just 2.6% of the vote in 1928 but went on to become the second-largest political party in the country within 5 years.
Conversely, too little inflation has been known to create what John Maynard Keynes referred to as the Paradox of Thrift whereby consumers refuse to consistently purchase new goods, instead opting to wait until the price inevitably decreases due to low or negative inflation. This phenomenon has been known to exacerbate economies already mired in recession as consumers stop spending, businesses are unable to produce goods or afford employee salaries and more people are laid off and begin to spend even less. This vicious cycle is personified by the struggling Japanese economy of the early 2000s as they recovered from the Lost Decade, marked by a speculative asset bubble of Japanese land and goods brought to a head with the Japanese stock market crash in 1989. Japanese markets took nearly two decades to fully recover.
Naturally, the ideal level of inflation is somewhere between these two extremes; high enough to encourage growth and consumption but low enough to keep the cost of living manageable. As the Fed has announced plans to raise the interest rate as many as three time in 2018, with a target inflation of 2%, the current generation of economic policy makers certainly have their work cut out for them as United States public debt continues to exceed $20 trillion.
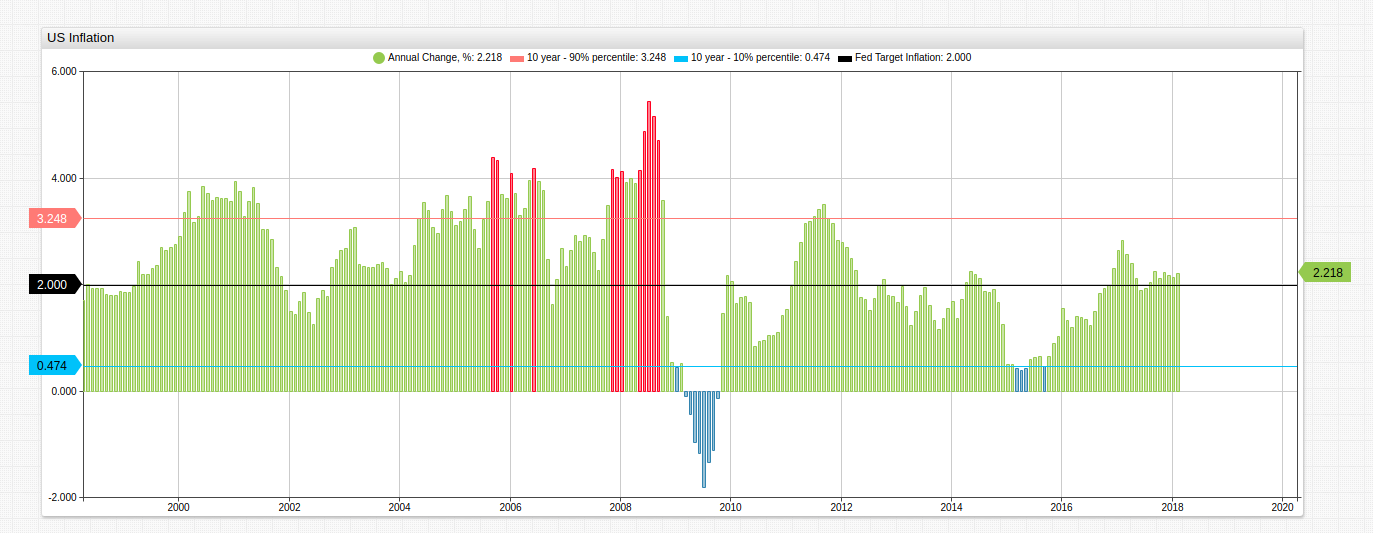
US Inflation
The chart above tracks inflation for the United States for a two-decade period beginning in 2000 and uses alert-expression and threshold settings to highlight periods outside of the user-defined range as well as to overlay percentile statistics.
The alert-expression specifies a range of observed inflation of 0.5 to 4.0 percent. Values outside of this range are filled with red and blue colors respectively.
The threshold sections calculate and display top and bottom deciles for the most recent 10-year period.
The chart is created using the declarative Charts syntax and Axibase Time Series Database.
Currently, the stated target inflation level of the Federal Reserve is around 2%. Fed Chairman Jerome Powell has claimed that online-only retailers like Amazon and others have contributed to keeping inflation levels down because of their ability to completely streamline their business models. Not exactly a criticism, but certainly not the kind of glowing praise Jeff Bezos et al are used to receiving from Obama-era policy makers.
Configuration
This section of the article discusses the underlying settings used for the chart above. For introductory information on using Trends, see this guide.
The configuration for the above chart is shown here:
[configuration]
  import fred = fred.js

  timespan = 20 year
  entity = fred.stlouisfed.org
  offset-left = 50
  offset-right = 50
  offset-top = 50
  height-units = 2
  width-units = 1
  format = fixed(3)

[group]

[widget]
  type = chart
  title = US Inflation

  [series]
    metric = cpieall
    axis = right
    display = false
    alias = s-1

  [series]
    mode = column
    label-format = Annual Change, %
    value = fred.PercentChangeFromYearAgo('s-1')
    color = yellowgreen
    alert-expression = value
    alert-style = if (alert > 4) return 'color: red'
    alert-style = if (alert < 0.5) return 'color: steelblue'
    alias = s-2

  [threshold]
    value = percentile(90, 's-2', '10 year')
    label = 10 year - 90% percentile
    color = Salmon
    pointer-position = left
    alias = t-1

  [threshold]
    value = percentile(10, 's-2', '10 year')
    label = 10 year - 10% percentile
    color = DeepSkyBlue
    pointer-position = left
    alias = t-2

  [threshold]
    value = 2.00
    label = Fed Target Inflation
    color = black
    pointer-position = left
    alias = t-3
There are five series in this configuration, defined by their alias setting:
s-1: United States Experimental CPI value for all items, sourced from the United States Federal Reserve FRED API. This series has a
display = falseexpression to hide the series in final version of the visualization but may still be used for deriving a new series. When displayed, the series is aligned to the right axis using a dual-axis setting, which is helpful when visualizing series with dramatically different orders of magnitude.s-2: A derived series which uses a collection of functions implemented in the
fred.jslibrary to calculate percent change from a year ago. This is a set of user-defined functions and must be imported using theimport fred = fred.jsexpression at the [configuration] level. This functionality may be extended with JavaScriptMathfunctions, which are supported in Trends charts. Analert-expressionis defined for this series. Wherever the condition is satisfied, the bar corresponding to the date of the alert is modified withalert-style, in this case, a specific color.t-1: The upper-limit threshold is defined with a
valuesetting,value = percentile(90, 's-2', '10 year'), where the first argument is the percentile, the second argument is the series from which the value is calculated, and the third is the time period for applying the statistic.t-2: The lower-limit threshold is defined similarly to t-1 except the percentile is specified as 10%.
t-3: The target inflation level of the Fed is defined similarly to t-1 and t-2
For more information refer to Charts Documentation.