Installation
Install ATSD
Install the database.
Create Account
Log in to the database at https://atsd_hostname:8443/.
Replace atsd_hostname with the hostname of the ATSD server.
Enter credentials for an administrator account.
Insert Sample Data
Download publicly available IEX market data for four instruments: TSLA, F, TM, ARKK covering the period between January 1, 2021 and March 15, 2021.
Download files with instrument details, trades, and daily aggregates.
curl --remote-name-all https://axibase.com/files/{gs_reference.cmd,gs_eod_ohlcv.csv,gs_trades.csv.gz}
Insert reference data.
cat gs_reference.cmd | nc -q 0 atsd_hostname 8081
Insert trades.
gunzip -c gs_trades.csv.gz | nc -q 0 atsd_hostname 8085
Insert end-of-day aggregates. Replace <username> and <password> with the account credentials specified above.
curl -k "https://atsd_hostname:8443/api/v1/trade-session-summary/import" \
  -F "data=@gs_eod_ohlcv.csv" \
  -u <username>:<password>
SQL Console
Open SQL > SQL Console page.
View trades:
SELECT *
  FROM atsd_trade
WHERE class = 'IEXG' AND symbol IN ('TSLA', 'F')
  AND datetime BETWEEN '2021-03-05 14:00:00' AND '2021-03-05 14:05:00'
  WITH TIMEZONE = 'US/Eastern'
  ORDER BY datetime, trade_num
LIMIT 100
Calculate 1-minute OHLCV bars from trades:
SELECT datetime, symbol, open(), high(), low(), close(), volume(), vwap()
  FROM atsd_trade
WHERE class = 'IEXG' AND symbol IN ('TSLA', 'F')
  AND datetime BETWEEN '2021-03-05 14:00:00' AND '2021-03-05 14:05:00'
  GROUP BY exchange, class, symbol, PERIOD(1 MINUTE)
  WITH TIMEZONE = 'US/Eastern'
  ORDER BY datetime, symbol
View daily results:
SELECT datetime, symbol, open, close, voltoday AS "volume",
  numtrades, ROUND(valtoday/1000000, 0) AS "volume_$M"
  FROM atsd_session_summary
WHERE class = 'IEXG' AND symbol = 'TSLA'
  AND datetime BETWEEN '2021-03-01 00:00:00' AND '2021-03-15 00:00:00'
  WITH TIMEZONE = 'US/Eastern'
  ORDER BY symbol, datetime
View reference data:
SELECT tags.symbol, tags.class_code, tags.figi, tags.type, tags.region, tags.currency, tags.name
  FROM atsd_entity
WHERE tags.class_code = 'IEXG' --AND tags.symbol IN ('TSLA', 'F', 'TM', 'ARKK')
  ORDER BY tags.symbol
View daily results for US auto manufacturers:
SELECT datetime, symbol, open, close, voltoday AS "volume",
  numtrades, ROUND(valtoday/1000000, 0) AS "volume_$M"
  FROM atsd_session_summary
WHERE class = 'IEXG' AND entity.tags.region = 'US' AND entity.tags.industry = 'Autos'
  AND datetime BETWEEN '2021-03-12 00:00:00' AND '2021-03-15 00:00:00'
  WITH TIMEZONE = 'US/Eastern'
  ORDER BY symbol, datetime
Calculate the ratio between two instruments based on last trade price:
SELECT datetime,
  LAST(CASE symbol WHEN 'TSLA' THEN price ELSE null END) last_TSLA,
  LAST(CASE symbol WHEN 'F' THEN price ELSE null END) last_F,
  ROUND(last_TSLA/last_F, 6) AS "TSLA/F"
FROM atsd_trade
  WHERE class = 'IEXG' AND symbol IN ('TSLA', 'F')
  AND datetime BETWEEN '2021-03-05 14:00:00' AND '2021-03-05 14:05:00'
  WITH TIMEZONE = 'US/Eastern', ROW_NUMBER(1 ORDER BY time, trade_num) >= 0
  ORDER BY datetime, trade_num
Calculate 1-minute OHLCV bars of the above ratio:
SELECT datetime,
  ROUND(MIN(ratio), 6) AS "TSLA/F_low",
  ROUND(MAX(ratio), 6) AS "TSLA/F_high",
  ROUND(LAST(ratio), 6) AS "TSLA/F_close"
FROM (
  SELECT datetime,
    LAST(CASE symbol WHEN 'TSLA' THEN price ELSE null END) last_TSLA,
    LAST(CASE symbol WHEN 'F' THEN price ELSE null END) last_F,
    ROUND(last_TSLA/last_F, 6) AS "ratio"
  FROM atsd_trade
    WHERE class = 'IEXG' AND symbol IN ('TSLA', 'F')
    AND datetime BETWEEN '2021-03-05 14:00:00' AND '2021-03-05 14:05:00'
    WITH ROW_NUMBER(1 ORDER BY time, trade_num) >= 0
    ORDER BY datetime, trade_num
) GROUP BY PERIOD(1 MINUTE)
WITH TIMEZONE = 'US/Eastern'
Explore more examples on SQL Overview page including:
- Scheduling query results for delivery as a report or an alert
- Saving query results into derived time series
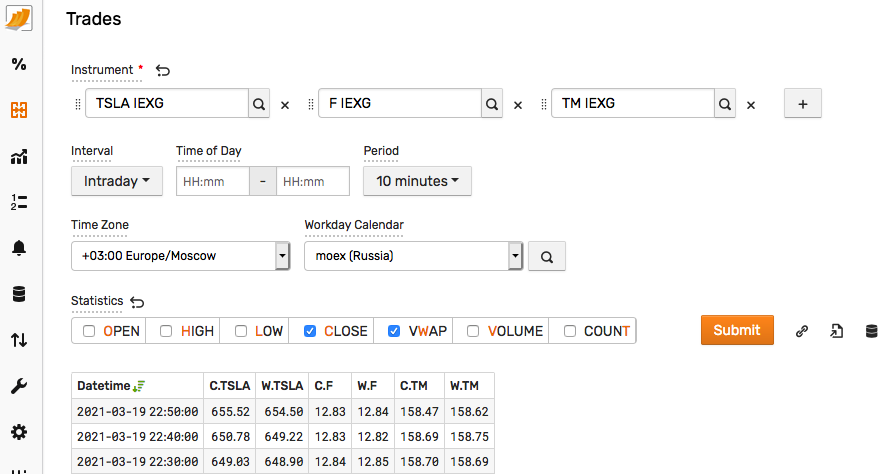
Trade Viewer
Open Trade Viewer in the side menu.
Select one or multiple instruments to view and export raw trades or aggregates.
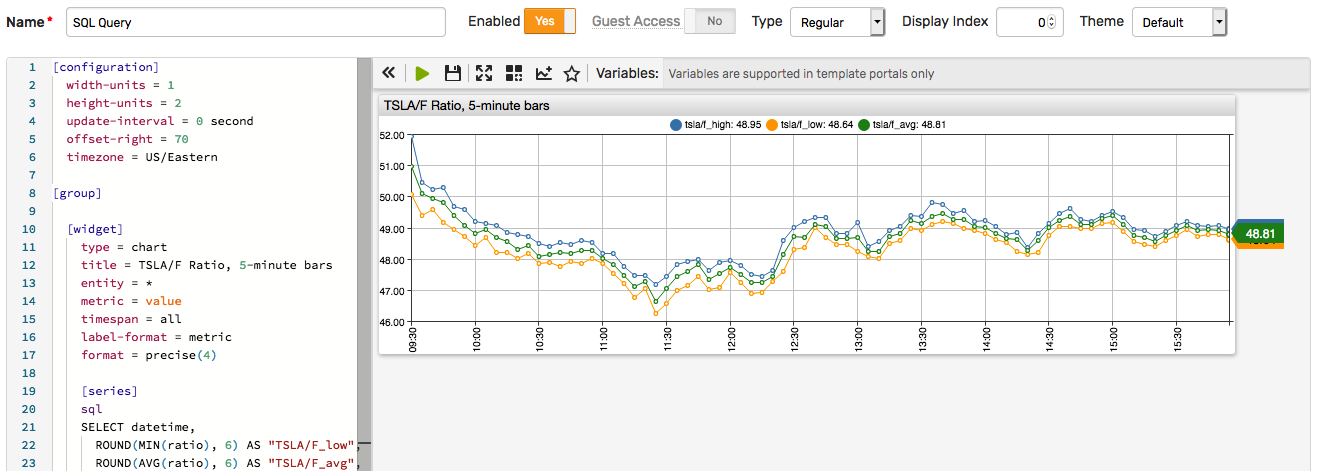
Portals
Click Portals > Add in the top menu.
Create a graph for the above SQL query by copying the query text into the sql...endsql setting:
[configuration]
  width-units = 1
  height-units = 2
  update-interval = 0 second
  offset-right = 70
  timezone = US/Eastern

[group]

  [widget]
    type = chart
    title = TSLA/F Ratio, 5-minute bars
    entity = *
    metric = value
    timespan = all
    label-format = metric
    format = precise(4)

    [series]

    sql
    SELECT datetime,
      ROUND(MIN(ratio), 6) AS "TSLA/F_low",
      ROUND(AVG(ratio), 6) AS "TSLA/F_avg",
      ROUND(MAX(ratio), 6) AS "TSLA/F_high"
    FROM (
    SELECT datetime,
      LAST(CASE symbol WHEN 'TSLA' THEN price ELSE null END) last_TSLA,
      LAST(CASE symbol WHEN 'F' THEN price ELSE null END) last_F,
      ROUND(last_TSLA/last_F, 6) AS "ratio"
    FROM atsd_trade
    WHERE class = 'IEXG' AND symbol IN ('TSLA', 'F')
    AND datetime BETWEEN '2021-03-05 09:30:00' AND '2021-03-05 16:00:00'
    WITH ROW_NUMBER(1 ORDER BY time, trade_num) >= 0
    ORDER BY datetime, trade_num
    ) GROUP BY PERIOD(5 MINUTE)
    WITH TIMEZONE = 'US/Eastern'
    endsql
To view the chart based on real-time data, the interval condition can be modified as follows:
AND datetime BETWEEN current_working_day AND now
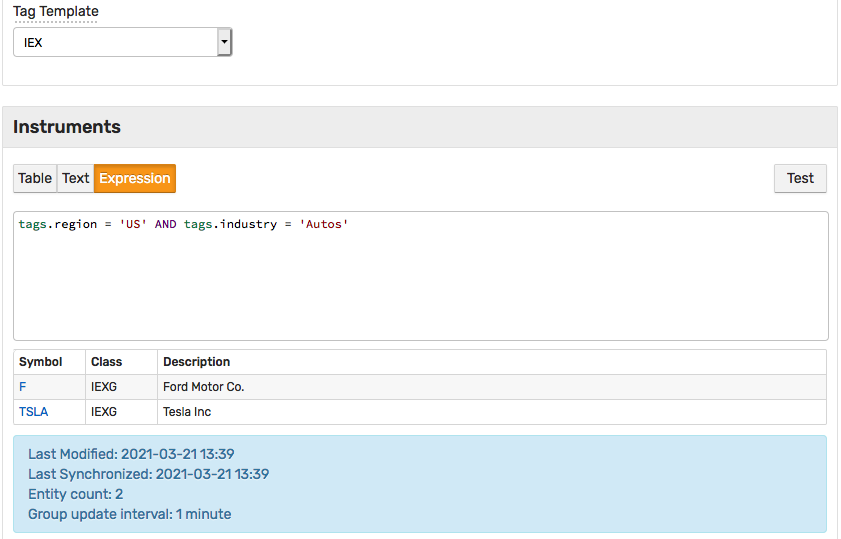
Instrument Groups
Open Instrument Groups > Create page and create an expression-based watch list which is populated and stays updated based on reference data.
Click Expression tab and enter a filter expression.
tags.region = 'US' AND tags.industry = 'Autos'
SELECT datetime, symbol, open, close, voltoday AS "volume",
  numtrades, ROUND(valtoday/1000000, 0) AS "volume_$M"
  FROM atsd_session_summary
WHERE class = 'IEXG' AND is_entity_in_group(to_entity(symbol, class), 'us-auto')
  AND datetime BETWEEN '2021-03-12 00:00:00' AND '2021-03-15 00:00:00'
  WITH TIMEZONE = 'US/Eastern'
  ORDER BY symbol, datetime
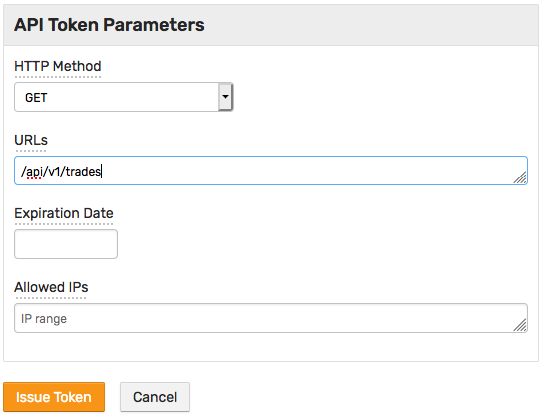
API
In the URL links below, replace atsd_hostname with the hostname where ATSD is installed.
Replace <username> and <password> with the correct credentials.
Alternatively, create API tokens on Admin > API Tokens page to access various endpoints.
Export trades:
curl "https://atsd_hostname:8443/api/v1/trades?class=IEXG&symbol=TSLA&startDate=2021-03-05%2014%3A00%3A00-05%3A00&endDate=2021-03-05%2014%3A05%3A00-05%3A00" \
 -k -u <username>:<password>
Export OHLCV bars:
curl "https://atsd_hostname:8443/api/v1/ohlcv?class=IEXG&symbol=TSLA&startDate=2021-03-05%2014%3A00%3A00-05%3A00&endDate=2021-03-05%2014%3A05%3A00-05%3A00&period=1%20MINUTE" \
 -k -u <username>:<password>
Summary
Congratulations!
You have successfully completed the Getting Started exercises.