How to Build Availability Report for AWS Route 53
Overview
AWS Route 53 provides tools to automate DNS configuration to reliably connect external user requests to infrastructure running in AWS. In addition to domain registration, AWS provides dynamic routing services, including latency-based routing, GeoDNS, Geoproximity, and Weighted Round Robin (WRR).
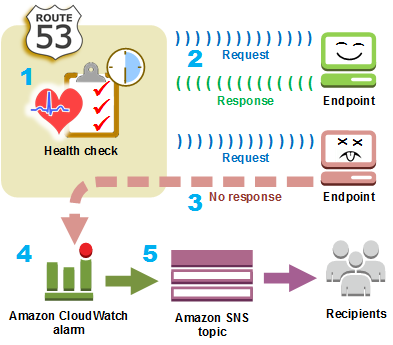
A core Route 53 functionality is the ability to configure health checks which monitor the health of an application and can route incoming traffic to healthy endpoints.
An automation procedure, such as DNS fail-over or service restart, can be initiated by Route 53 once the health check status drops below a certain threshold.
Geographic Distribution
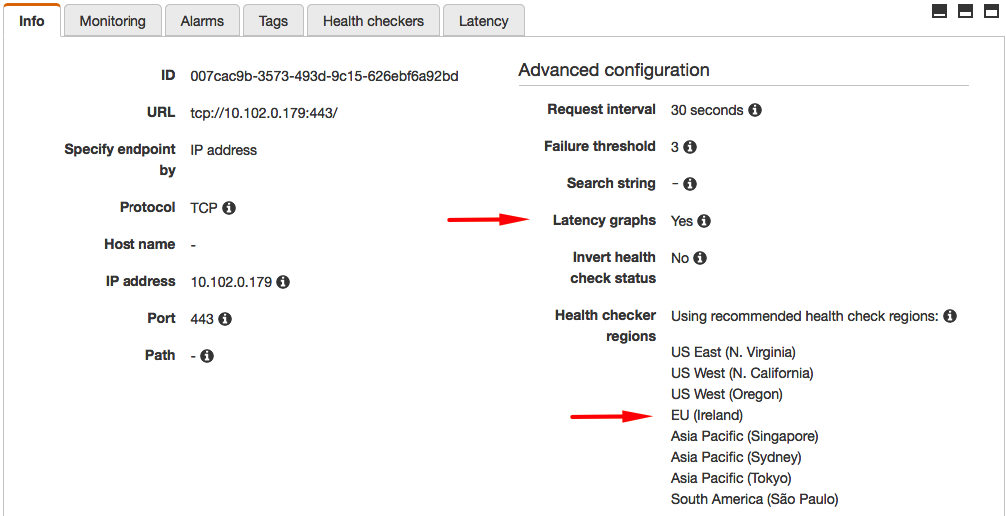
Route 53 executes health checks from different parts of the world independently verify outage and latency information. The latency and connection times collected by the checkers vary widely depending on the geographic proximity of the monitored endpoint to one of the AWS regions used for health checking.
us-east-1us-west-1us-west-2sa-east-1ap-southeast-1ap-southeast-2ap-northeast-1
Access Security
AWS publishes a list of IP ranges used by health checker nodes. Your network administrators may need to allow inbound traffic from ROUTE53_HEALTHCHECKS addresses.
{
  "ip_prefix": "192.0.2.0/24",
  "region": "us-east-1",
  "service": "ROUTE53_HEALTHCHECKS"
}
Healthy Endpoint
For HTTP and HTTPS checks, Route 53 considers the endpoint healthy if the service establishes a connection within ten seconds and the endpoint returns an HTTP status code of 2xx or 3xx within two seconds.
For TCP checks, Route 53 determines the endpoint status is healthy if the service establishes TCP connection within ten seconds.
The timeouts are hardcoded.
Monitoring Frequency
Route 53 schedules health checks in multiple regions independently using the same monitoring interval of 30 or 10 seconds (Fast mode).
- 0.5 requests per second for standard frequency of 30 seconds.
- 2.0 requests per second for Fast mode frequency of 10 seconds.
Individual checkers are not synchronized, the rate at which requests arrive is uneven.
Route 53 supports health checks HTTP, HTTPS, and TCP protocols.
The services considers the endpoint to be in a Healthy state when the specified percentage of checkers establish a TCP connection and (for HTTP/S) received a 2xx/3xx response code from the server. The response also contains the specified keyword if String Matching is enabled.
When specifying paths for HTTP or HTTPS endpoints, factor in the increased traffic sent to the target service to avoid causing excessive load on the server.
HTTPS
Health checks cannot be used to monitor validity of SSL certificates as part of HTTPS endpoint monitoring. Specifically, the service reports Healthy status even if the SSL certificate is expired, self-signed, or otherwise invalid.
Metrics
Built-in monitoring charts display endpoint health statistics for a period of up to 2 weeks.
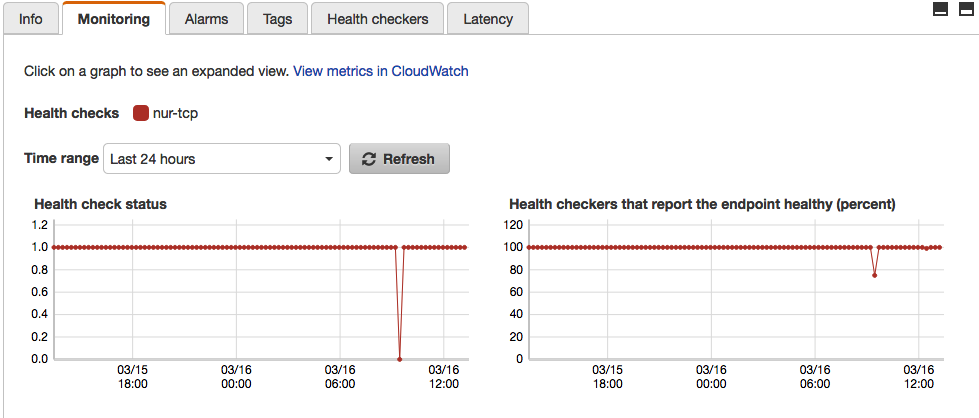
Route 53 CloudWatch metrics are available only in the us-east-1 region as specified in the Developer Guide (see section To view Route 53 metrics on the CloudWatch console).
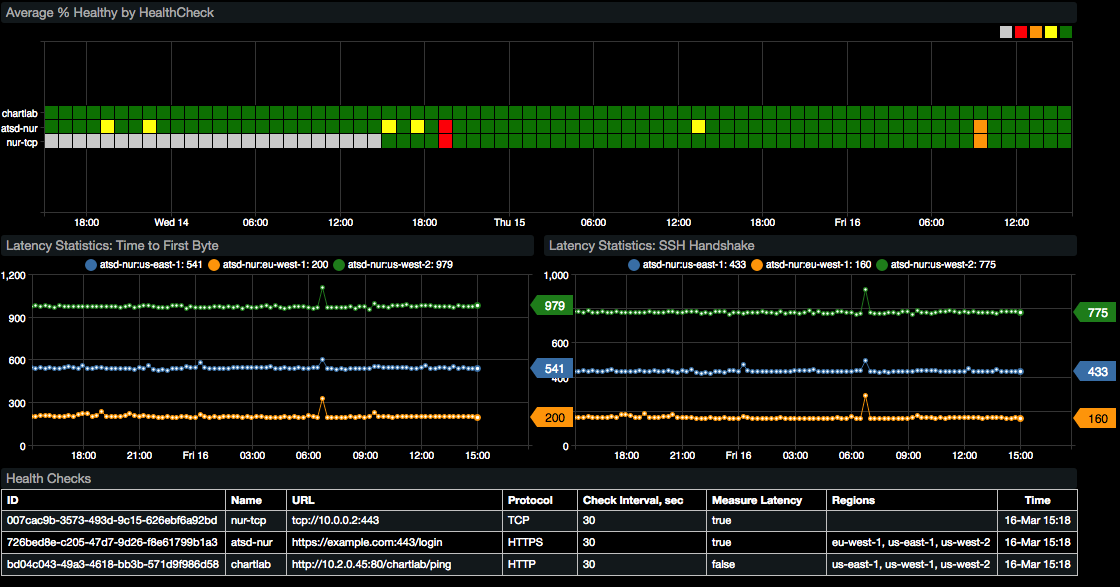
Service Availability Dashboards
Offload health check statistics to ATSD and create consolidated dashboards with custom thresholds for alerts and notifications.
Configuration
Prerequisites
- Create an AWS IAM account to query CloudWatch statistics.
- Ensure 4 GB RAM is available for the ATSD sandbox container.
Launch ATSD Sandbox
Create an import directory in the current directory:
mkdir import
cd import
Mount this directory to the Docker container to pass AWS credentials to the CloudWatch data collector without exposing sensitive information as environment variables.
Create an aws.propeties file in the import directory and replace KEY and SECRET with AWS Access Key ID and Secret Access Key respectively.
accessKeyId=KEY
secretAccessKey=SECRET
Launch the ATSD sandbox container on a Docker host:
docker run -d -p 8443:8443 -p 9443:9443 -p 8081:8081 \
  --name=atsd-sandbox \
  --volume=$(pwd)/import:/import \
  --env ATSD_IMPORT_PATH='https://github.com/axibase/atsd-use-cases/raw/master/integrations/aws/route53-health-checks/resources/aws-route53-xml.zip' \
  --env COLLECTOR_IMPORT_PATH='https://raw.githubusercontent.com/axibase/atsd-use-cases/master/integrations/aws/route53-health-checks/resources/job_aws_aws-route53.xml' \
  --env COLLECTOR_CONFIG='job_aws_aws-route53.xml:aws.properties' \
  axibase/atsd-sandbox:latest
The sandbox container includes both ATSD and Axibase Collector instances.
Use the Collector instance in the sandbox container to retrieve Route 53 statistics from AWS CloudWatch and store the statistics in ATSD.
Wait until the sandbox is initialized and All applications started is displayed by the start logs.
docker logs -f atsd-sandbox
[Collector] 2018-03-29 17:47:40,329 Job 'aws-route53' completed.
[Collector] 2018-03-29 17:47:40,330 All jobs completed.
[Collector] Checking Collector web-interface port 9443 ...
[Collector] Collector web interface:
[Collector] https://172.17.0.2:9443
[Collector] Collector start completed.
[Collector] For more details see logfile in /opt/axibase-collector/logs/axibase-collector.log
[Collector] Account 'axibase' created.
All applications started
Log in to ATSD using axibase username and axibase password at https://atsd_hostname:8443/.
Health Check Setup Attribute Copy
Configure a cron scheduled task to copy health check attributes into ATSD sandbox as described by ATSD Integration Documentation
Results
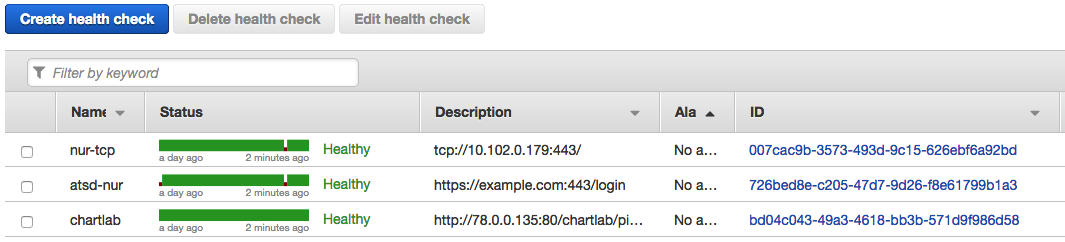
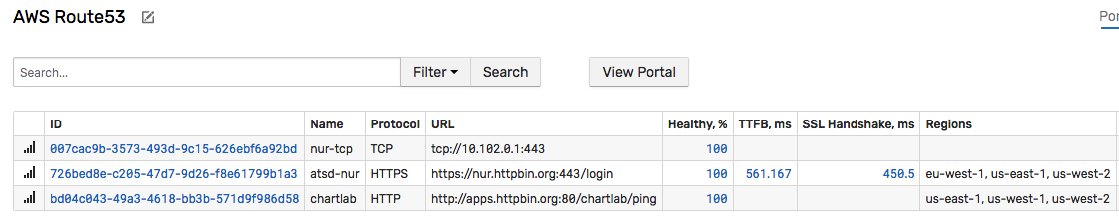
Consolidated View
View all working Route 53 health checks on the AWS Route 53 tab.
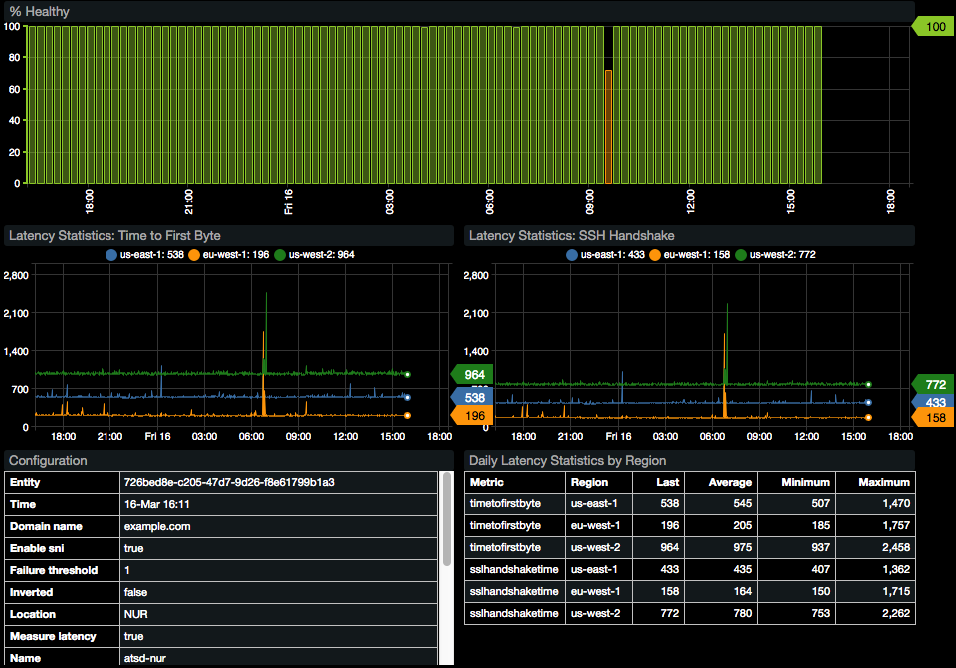
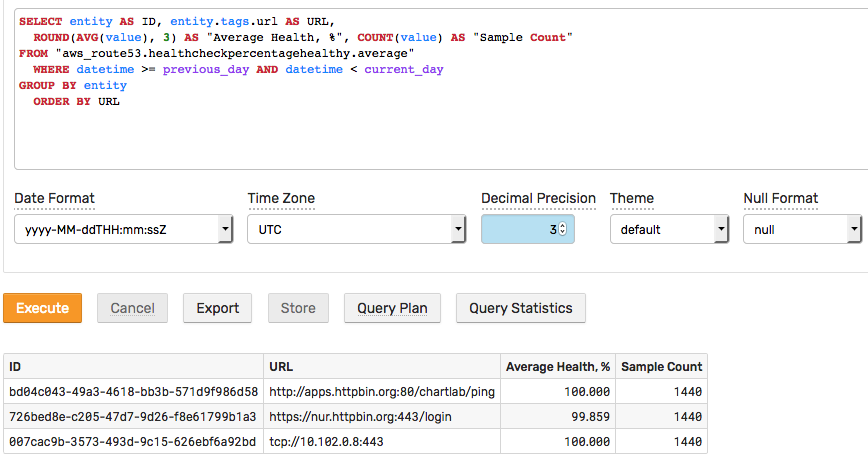
Service Level Reporting
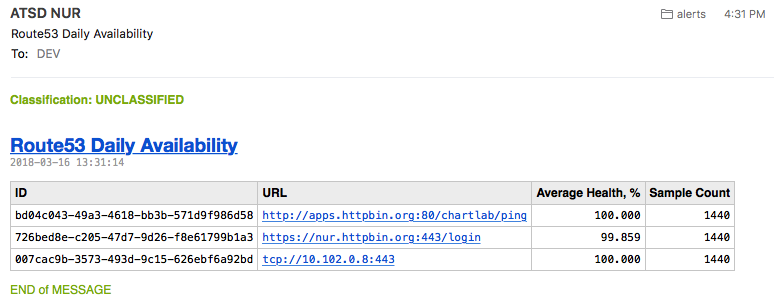
Availability Portal
The built-in portal displays availability statistics.