Pain at the Pump - a Closer Look at Hawaiian High Fuel Prices

Introduction
Hawaii has some of the most expensive consumer products in the nation. According to expatistan.com,
most Hawaiian good are more expensive than those of New York City:
- 1 liter of whole fat milk: +41%.
- 1 kg (2 lbs) of apples: +68%.
- Bread for 2 people for 1 day: +67%.
In addition to exorbitant food prices, Hawaii also has highest fuel prices in the entire United States, according to gasbuddy.com. The Aloha State has long had the
dubious honor of the most expensive fuel in the nation but until recently quantifying additional metrics was difficult. To better analyze such data in 2009 the US government established the data aggregation website data.gov. Datasets are available online to conduct research, develop web applications, and design data visualizations on a variety of topics ranging from agriculture and manufacturing, to health and economics.
These datasets are published in the Socrata Open Data Format. Socrata is a Seattle-based company that develops software for government agencies to publish and manage their data in an open format. The Socrata Open Data Format is used by the US Federal Government, as well as 25 US states, and more than 300 cities. Thus far, more than 4,000 government datasets are published in Socrata format.
Hawaiian Fuel Prices Dataset
This article uses data sourced from data.gov concerning Hawaiian fuel prices.
From 2006 to 2012, the State of Hawaii compiled AAA fuel prices for each of these fuel types:
Diesel, Gasoline - Regular, Gasoline - Midgrade, Gasoline - Premium
In turn, fuel prices are recorded for the following Hawaiian locales:
Hilo, Honolulu, Wailuku, US, State of Hawaii
Access the raw dataset on
data.gov.
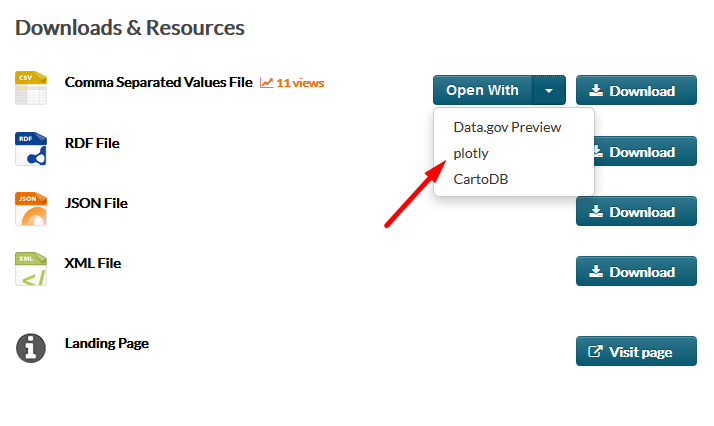
data.gov supports data download in the following formats: CSV, RDF, JSON, and XML. data.gov also supports several visualization tools directly from the site: CartoDB and plotly are currently available.
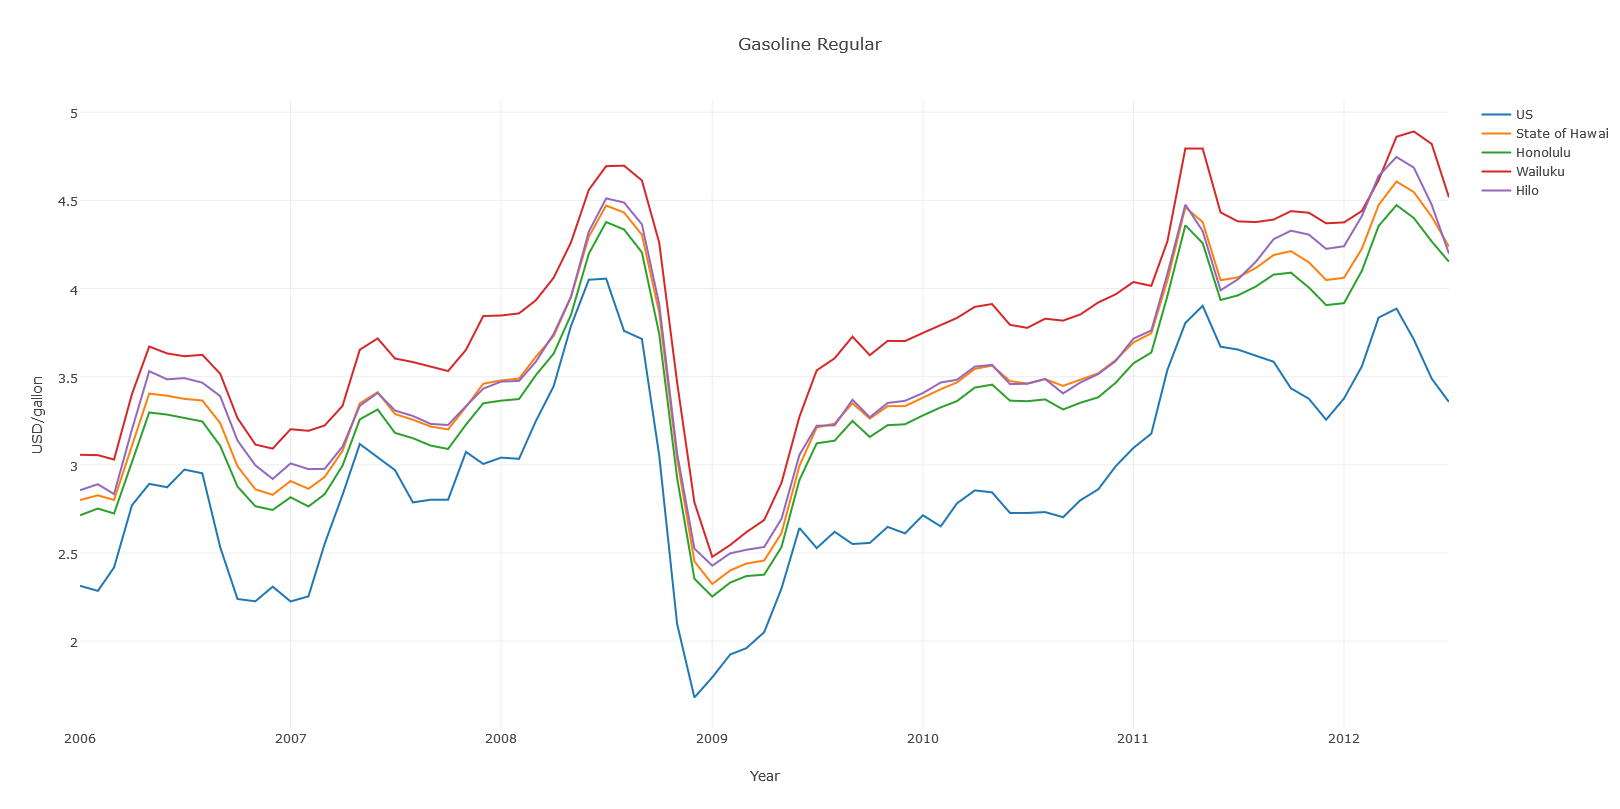
plotly
This visualization tool supports time series visualization but lacks tools to perform ad hoc data transformations.
These instructions enumerate the process of using plotly to visualize the data.
Open the Hawaii Fuel Prices dataset, and select plotly from the Open With drop-down list.
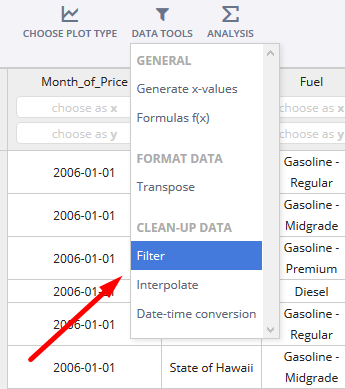
Select a Filter from the Data Tools menu, as shown below.
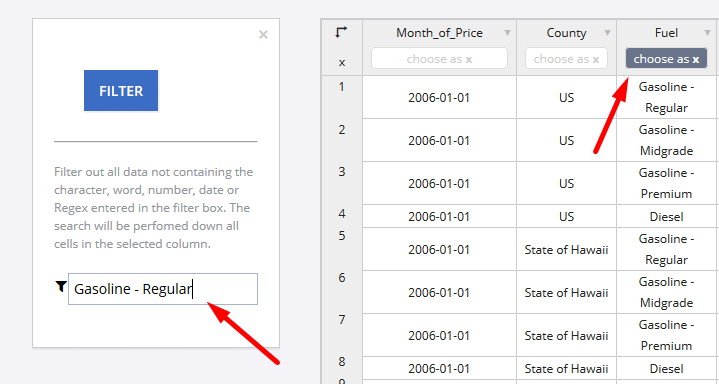
Open the Gasoline - Regular filter and select choose as x.
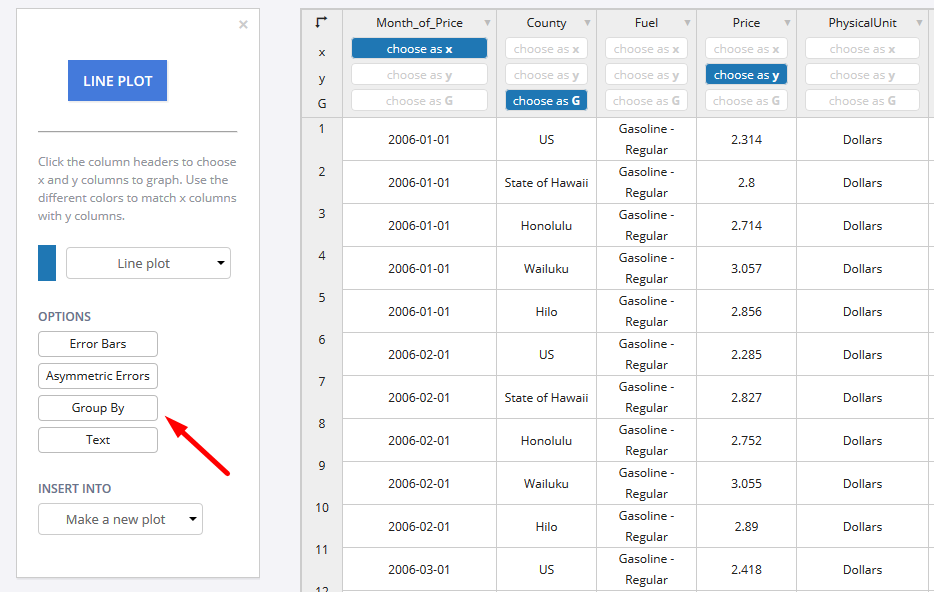
Open the Group By option and select Month_of_Price for the x axis, County as G, and Price for the y axis.
Using plotly to analyze datasets from data.gov is rendered inefficient due to the number of settings required to create a single visualization. Data in plotly is static and cannot be transformed using group statistics or aggregators.
Axibase Time Series Database
ATSD supports several collection tools with built-in heuristics to handle data.gov and other Socrata datasets. The Axibase Collector uses Socrata metadata to interpret the meaning of columns and extract dates, times, and categories from data files.
ATSD stores the data in a local database instance. As such open source and other public data can be combined with private, institutional, or other internal data sources.
ATSD does not require you to design database table schema, provision an application server, or write parsing programs to import new data.
Configure a scheduled job to retrieve data from a specified endpoint import the data into ATSD according to pre-defined rules. Once the data is stored in ATSD, creating and sharing reports and creating interactive visualizations with built-in widgets is trivial. Reports are continuously updated with the flow of incoming data.
The plotly visualization above is replicated in ChartLab below. ChartLab is a visualization application that relies on data processing and stored from ATSD.
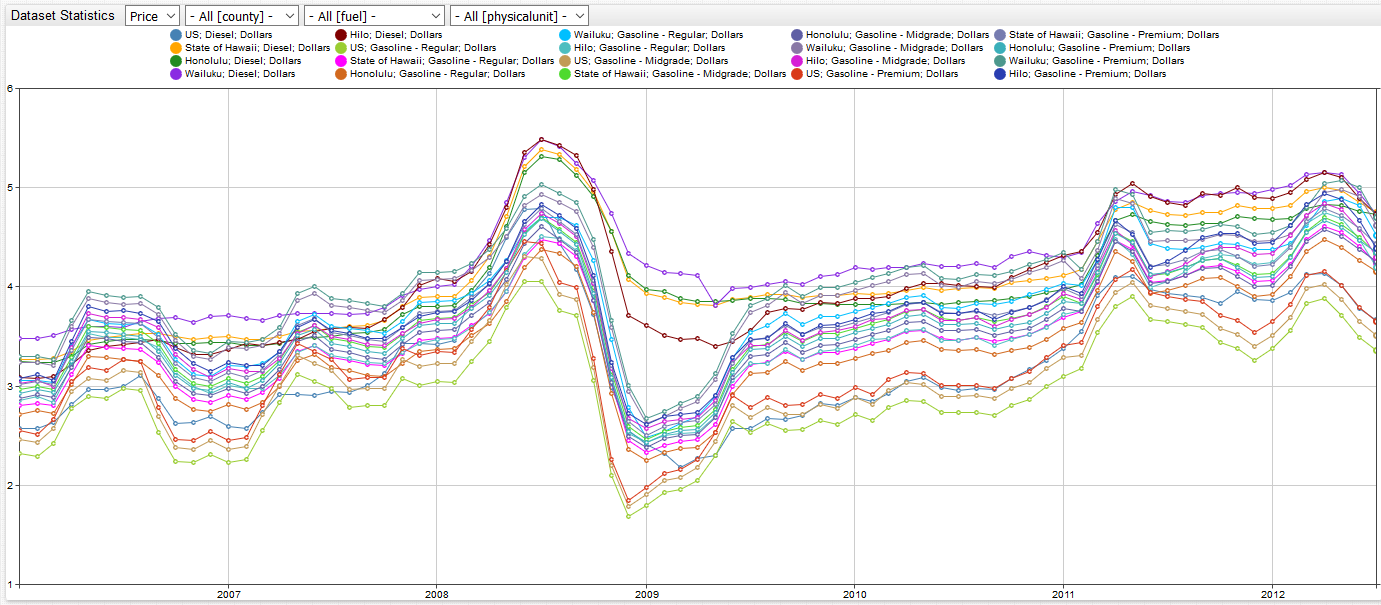

Sort the dataset by location or fuel type and easily navigate through the entire dataset using [dropdown] settings to create variable data inputs.
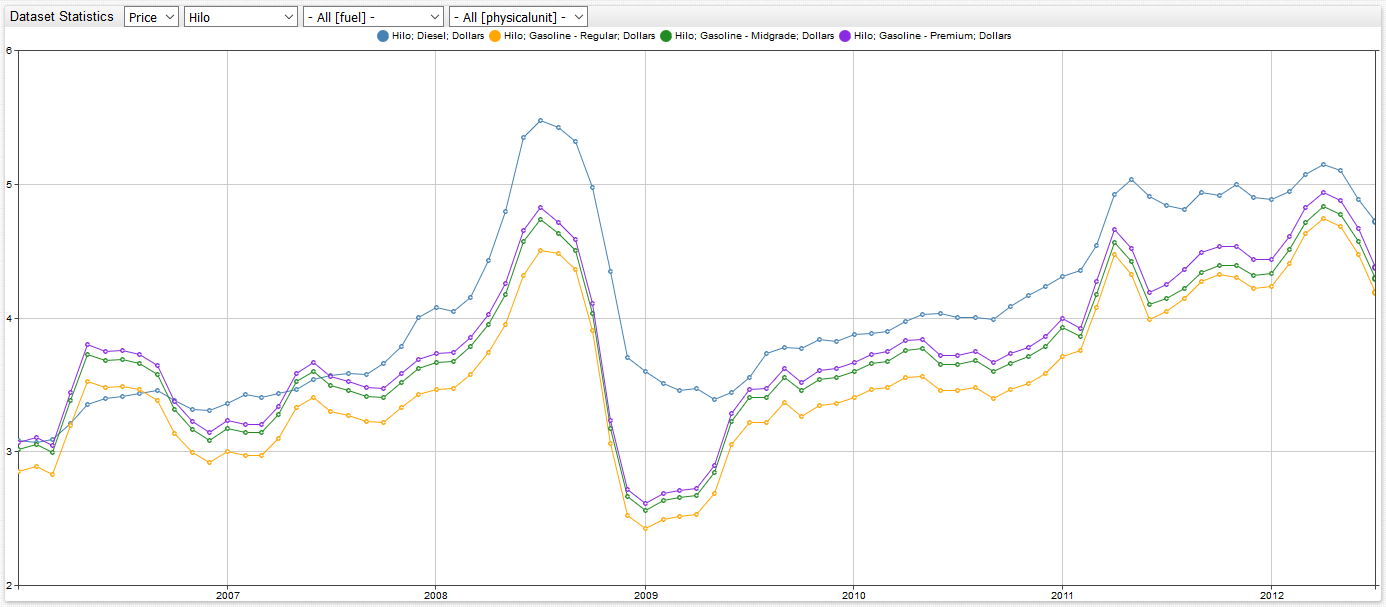
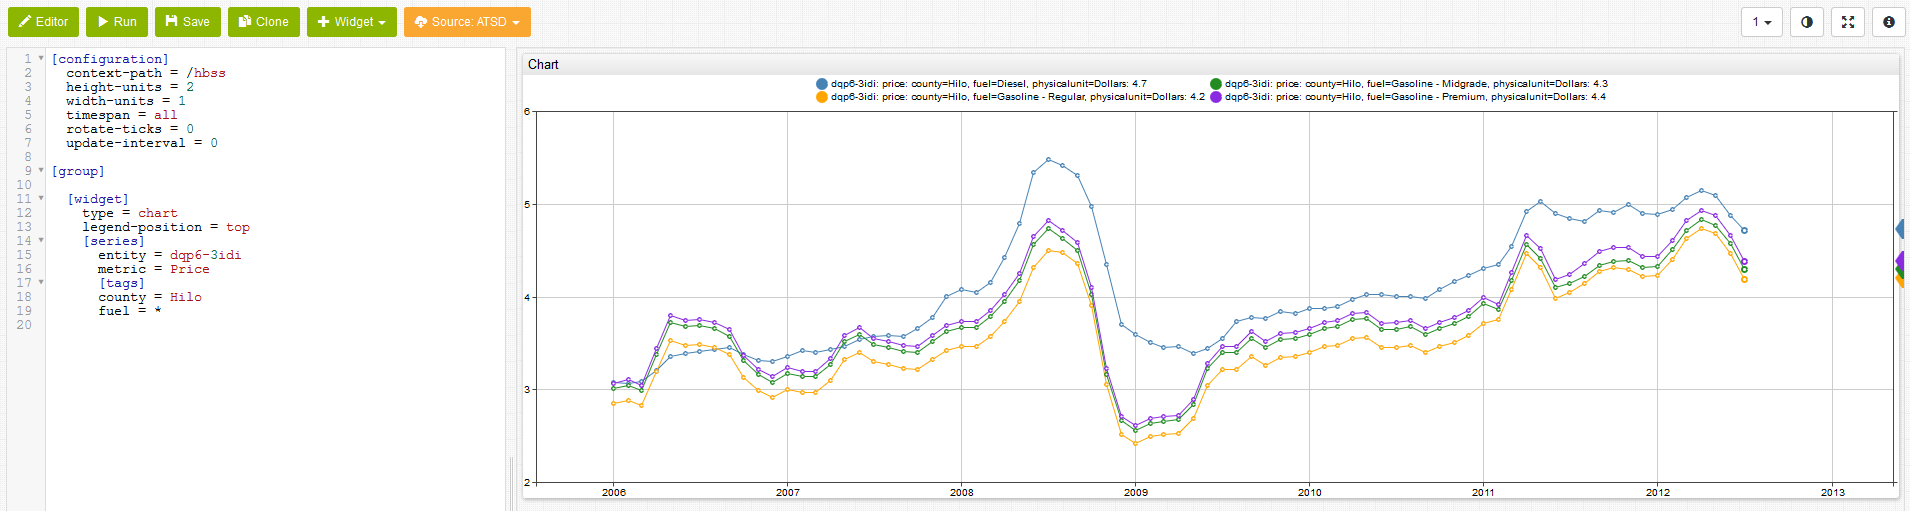
Hilo Fuel Prices (All Fuel Types)
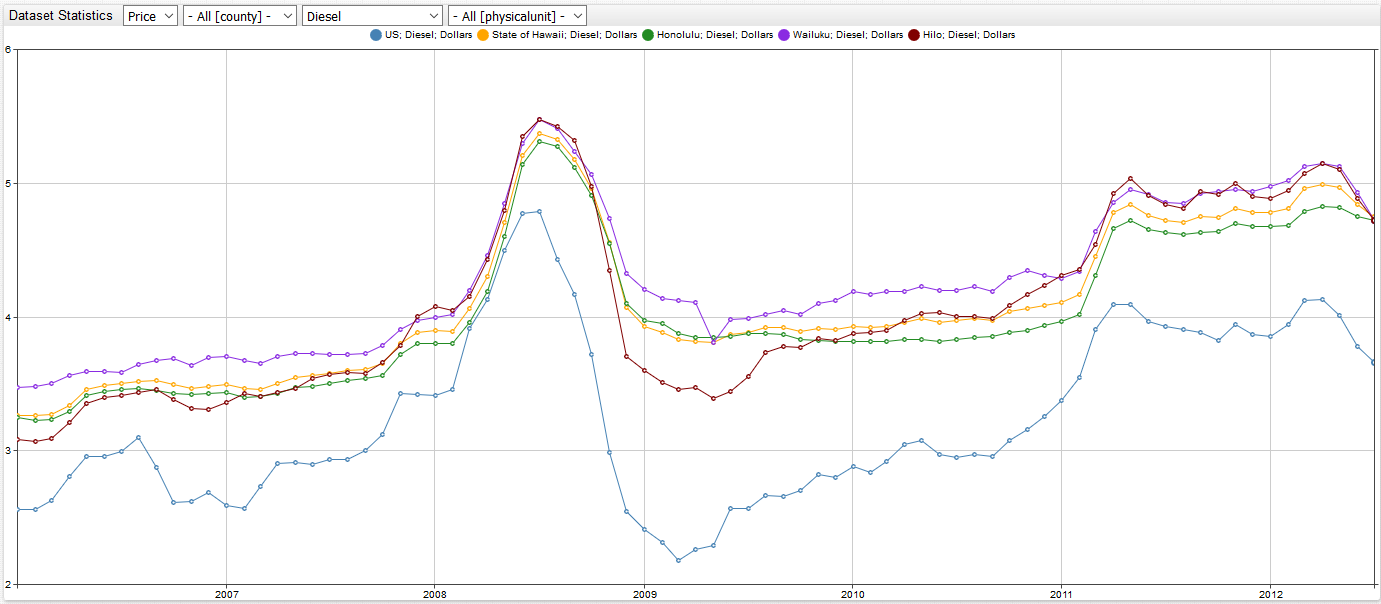
Diesel Fuel Prices (All Locations)
Creating Custom Portals
Create custom portals using the example portal above as a template. Change or display particular aspects of the dataset as needed. ChartLab supports complete visualization customization.
Recreate Hilo Fuel Prices Visualization
- Open the Fuel Portal above.
- Define the
countyandfueltags. Use Hilo for county and wildcard*for fuel to select all types. - Click Run to render the visualization.
Diesel Histogram
- In the Editor window specify
countyandfueltags asHiloanddiesel, respectively. - To calculate the difference between Hilo and mainland diesel prices, create a second series. Define the
countytag asUS.
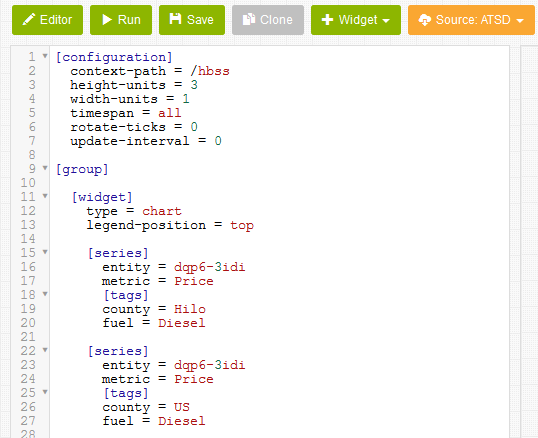
Create a derived series to calculate the difference between local and mainland prices:
- In the
Hiloseries, define an aliasalias = s1. In theUSseries, define a second aliasalias = s2. Hide both series using adisplay=falsesetting. - Define a new series with
label = Hilo over US Diesel Surchargessetting included. Use the expressionvalue = value('s1') - value('s2')to calculate the derived metric.
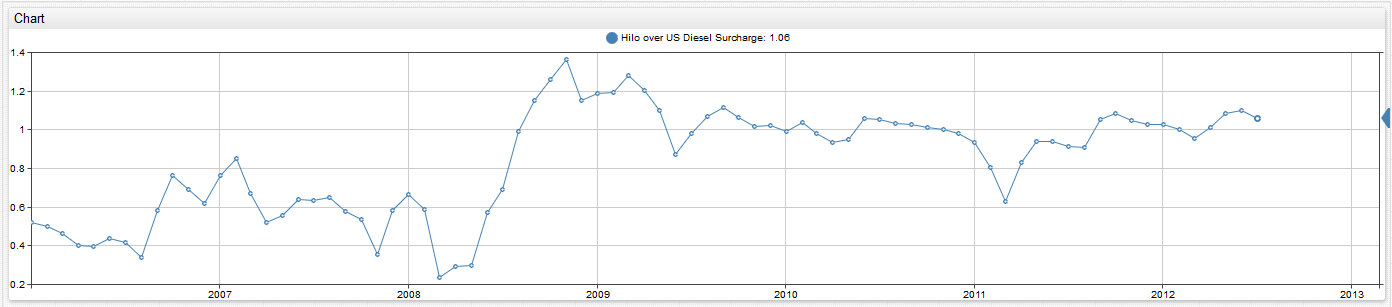
Make additional optional changes to fine tune the visualization:
- Modify the range of the visualization with
min-range = 0setting. - Change the type of visualization rendered with
mode = columnsetting. - Define custom colors with
color = redsetting. - Under
[configuration]scale the visualization withheight-units = 2orwidth-settings 2.
Read Charts Documentation for an exhaustive list of available settings.
Combining Datasets
Exploring the complete dataset for fuel prices, Wailuku is more expensive for any fuel type than Hilo and Honolulu. Are products generally more expensive in Wailuku than the other islands, or is fuel an anomaly? One way to investigate further is to investigate a second dataset tracking consumer products in Hawaii.
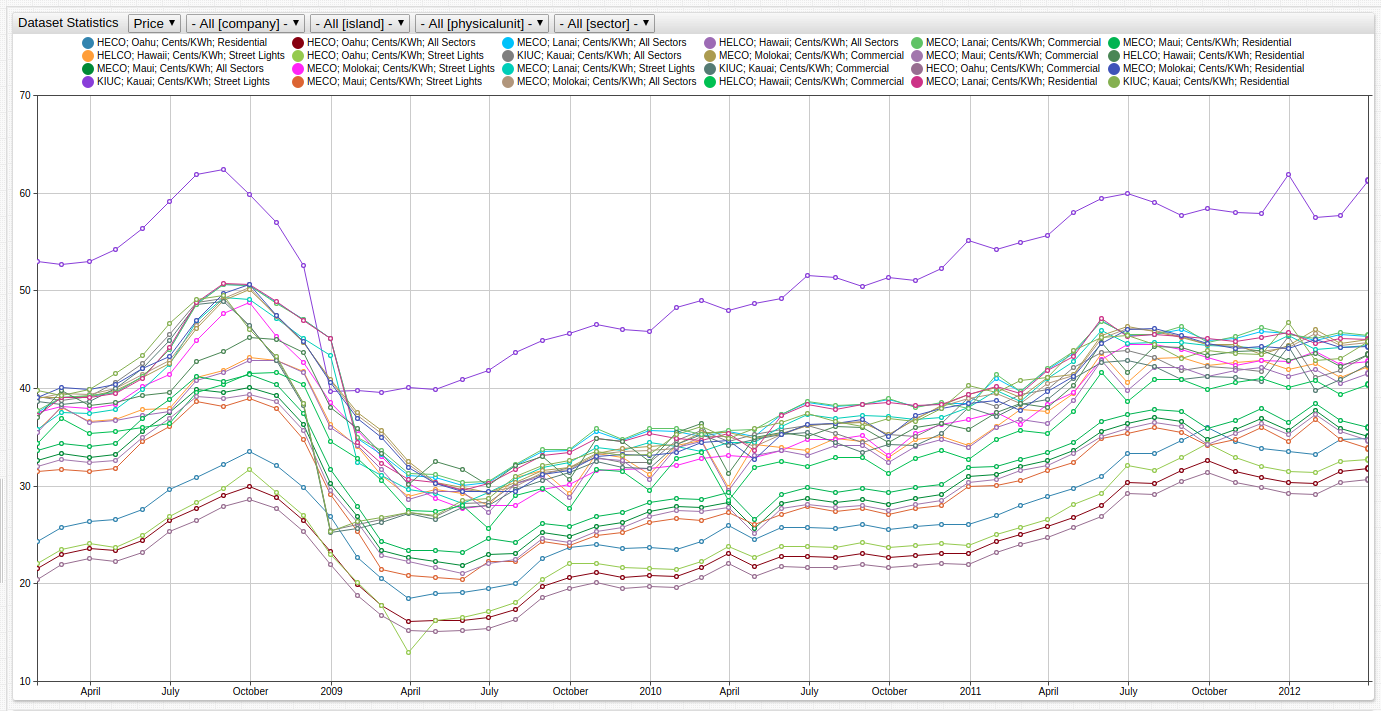
On data.gov, locate the Hawaii Electricity Prices dataset.
From 2008 to 2012, the State of Hawaii collected electricity prices (in cents/kWh) for each of the Hawaiian islands:
Hawaii, Kauai, Lanai, Maui, Molokai, Oahu
The electricity metric is tracked by sector:
All Sectors, Commercial, Residential, Street Lights
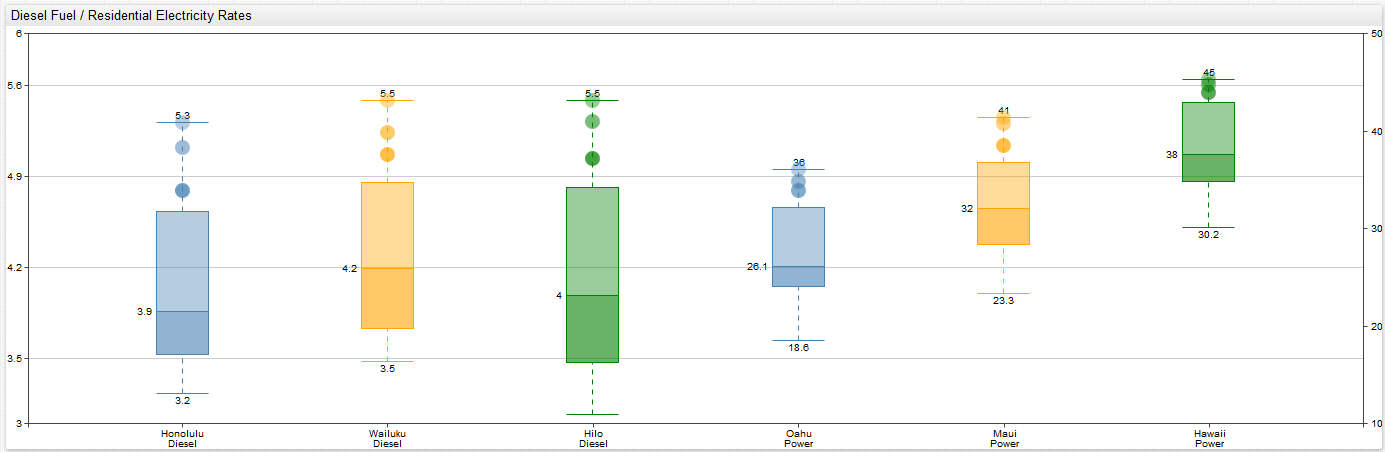
The geographic tags for the gasoline and electricity datasets are different: the former is county-based while the latter is island-based. Regions with data for both metrics are highlighted below:
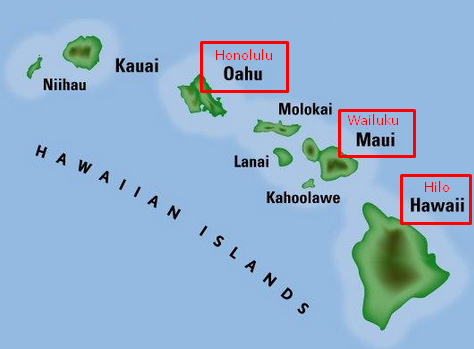
Compare Diesel prices in Honolulu, Wailuku, and Hilo with residential electricity rates on their corresponding islands (Oahu, Maui, Hawaii).
For more information about generating custom portals, see the Charts Documentation.
Additional Datasets
Action Items
- Install ATSD on a virtual machine or in a Linux container.
- Install Axibase Collector and configure Collector to write data into your ATSD instance.
- Upload the Job file to Axibase Collector.
- Import
data.govdatasets to enable data collection. - Log in to ATSD and open a sample Socrata portal to explore the data.