Getting Started: Exporting Data
Contents
- Introduction
- Inserting Data
- Portals
- Exporting Data
- SQL
- Alerting
Export Form
This section demonstrates how to retrieve data from the database using the interactive data export form.
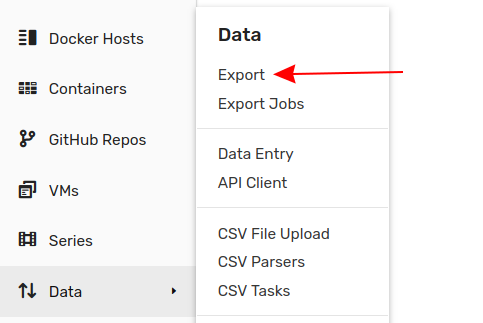
Open the *Data > Export page.
Define parameters of the series from which to download data as a CSV file or display in HTML format.
- Enter
temperatureinto the Metric field. - Click Name and enter
br-1905as the entity. - Modify the Date Interval to
1 Quarterto select values for a longer timespan. - Select CSV in the Format section.
- Click Submit.

To export statistics instead of raw values, expand the Aggregate section and select one or multiple statistical functions from the Statistics drop-down list. Set the aggregation period to 1 Day.

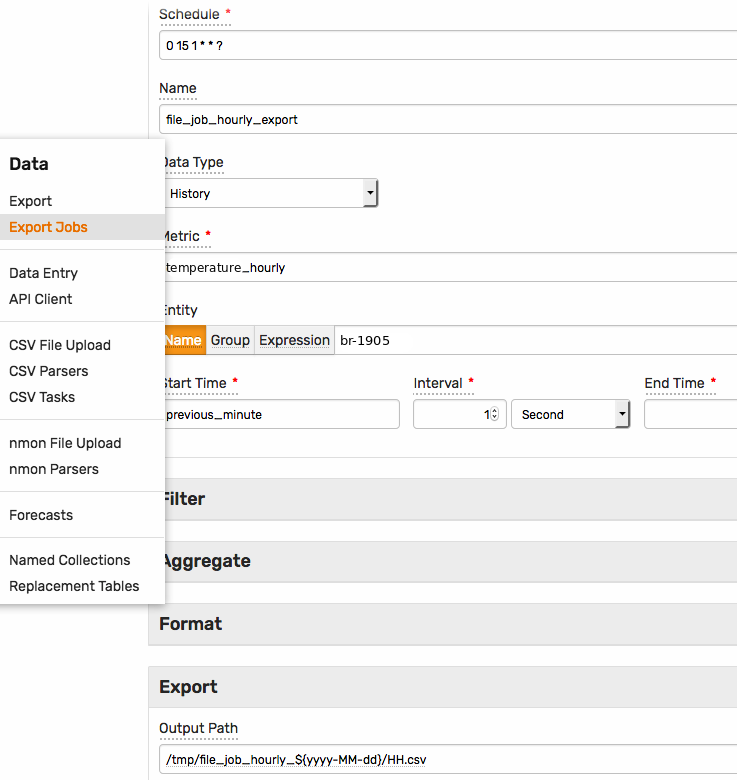
The results can also be exported on schedule to the local file system or distributed to email subscribers.
API Client
The database provides a build-in API Client to test REST API endpoints. This section shows how to export data using the series query endpoint.
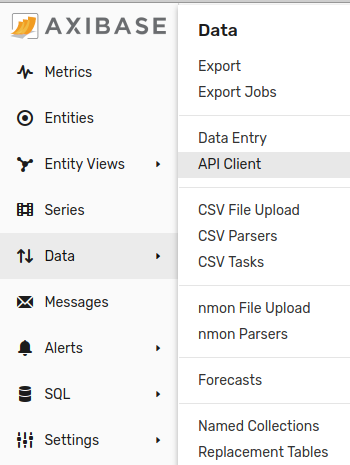
Open the Data > API Client page.
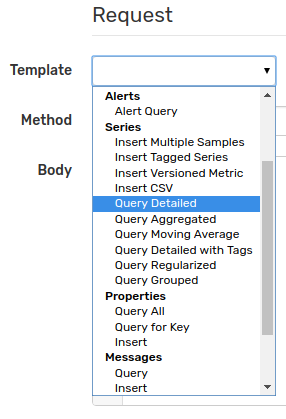
Select Series > Query Detailed template.
Adjust startDate and endDate fields, replace entity and metric field values accordingly. The date fields support both ISO format dates as well as calendar keywords such as now.
[{
  "startDate": "2019-03-01T00:00:00Z",
  "endDate":   "now",
  "entity": "br-1905",
  "metric": "temperature"
}]
The response document contains the series key and the array of time:value samples.
[
  {
    "entity": "br-1905",
    "metric": "temperature",
    "tags": {},
    "type": "HISTORY",
    "aggregate": {
      "type": "DETAIL"
    },
    "data": [
      { "d": "2019-03-01T20:10:00.000Z", "v": 15 },
      { "d": "2019-03-01T20:20:00.000Z", "v": 10.8 },
      { "d": "2019-03-01T20:30:00.000Z", "v": 24 }
    ]
  }
]
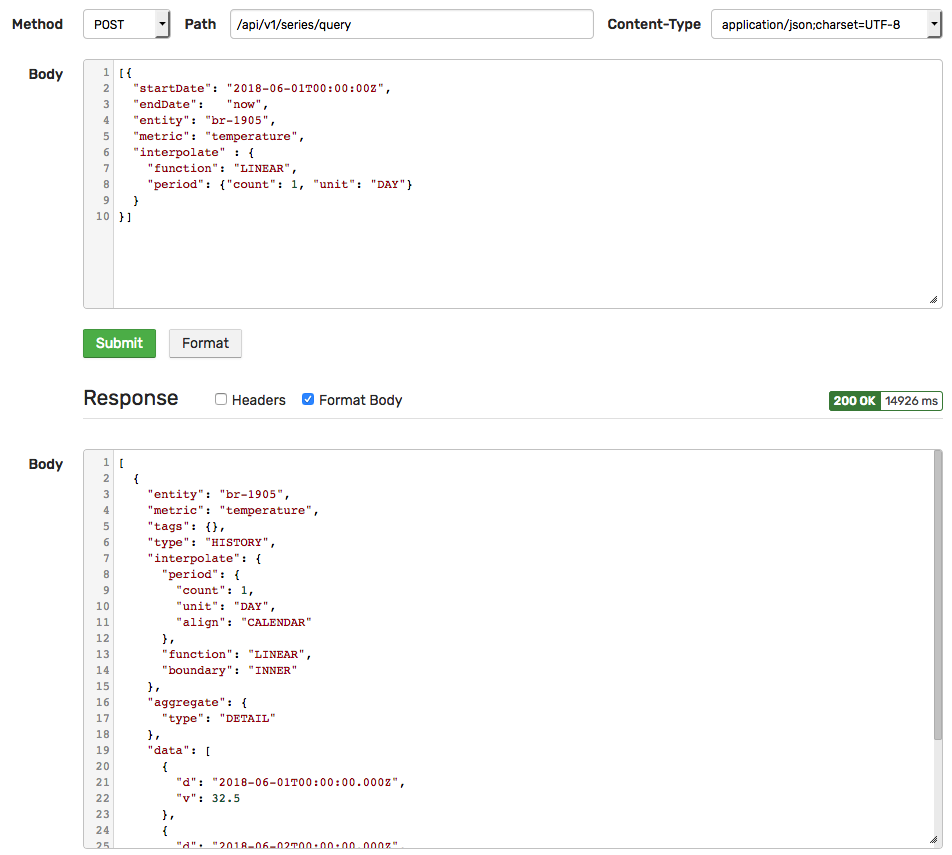
Execute another request to retrieve interpolated values for the above series.
[{
  "startDate": "2019-03-01T00:00:00Z",
  "endDate":   "now",
  "entity": "br-1905",
  "metric": "temperature",
  "interpolate" : {
    "function": "LINEAR",
    "period": {"count": 1, "unit": "DAY"}
  }
}]
Continue to Part 5: SQL.