Support
Support Options
Commercial Support:
Open a ticket in our Support Desk to expedite processing.
Trial Period Support:
Email us at
support-atsd@axibase.com.
Overview
This document helps you submit a well-prepared support ticket to ensure Axibase staff can resolve it faster.
Use the below guidelines to attach relevant details to the ticket.
Section 1 is required. Skip sections 2 - 8 if not applicable.
1. Database Information
Open Settings > Server Properties page.
Click Export Configuration.
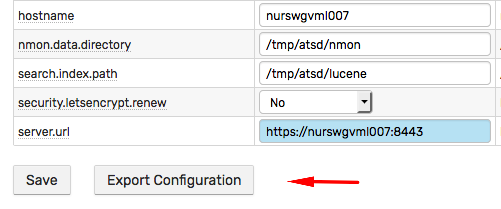
The configuration-export.json file contains key database and operating system information, including:
- Operating system name and version.
- Database build and version details.
- JVM parameters.
- Java environment variables.
- Current database metrics.
- Database properties.
Review the sample configuration file.
Note
If the database fails to start, provide the .tar.gz archive of the /opt/atsd/atsd/conf directory instead.
Note
For distributed installations, attach output of the status command in HBase shell.
2. Database Log Files
The files in the /opt/atsd/atsd/logs/ directory can be downloaded from the Settings > Diagnostics > Server Logs page.
Error log
/opt/atsd/atsd/logs/err.log.Archive (
.tar.gz) of*.logand*.zipfiles in the/opt/atsd/atsd/logsdirectory.tar czfv atsd_support.tar.gz \ /opt/atsd/atsd/logs/*.log \ /opt/atsd/atsd/logs/*.zip \ /opt/atsd/atsd/logs/*.out
3. Extended Log Files
Note
HBase and HDFS log files are accessible from the Settings > Diagnostics > Server Logs page if ATSD is running in standalone mode.
Archive (
.tar.gz) of the/opt/atsd/hbase/logs/directory if ATSD is running in standalone mode.Archive (
.tar.gz) of the/var/log/hbase/directory from the HBase HMaster server if ATSD is running in distributed mode.Archive (
.tar.gz) of the/opt/atsd/hadoop/logs/directory if ATSD is running in standalone mode.Archive (
.tar.gz) of the most recentjava_pid<pid>.hprofheap dump file in the/opt/atsd/atsd/logsdirectory, if such file is present.
4. Performance Statistics
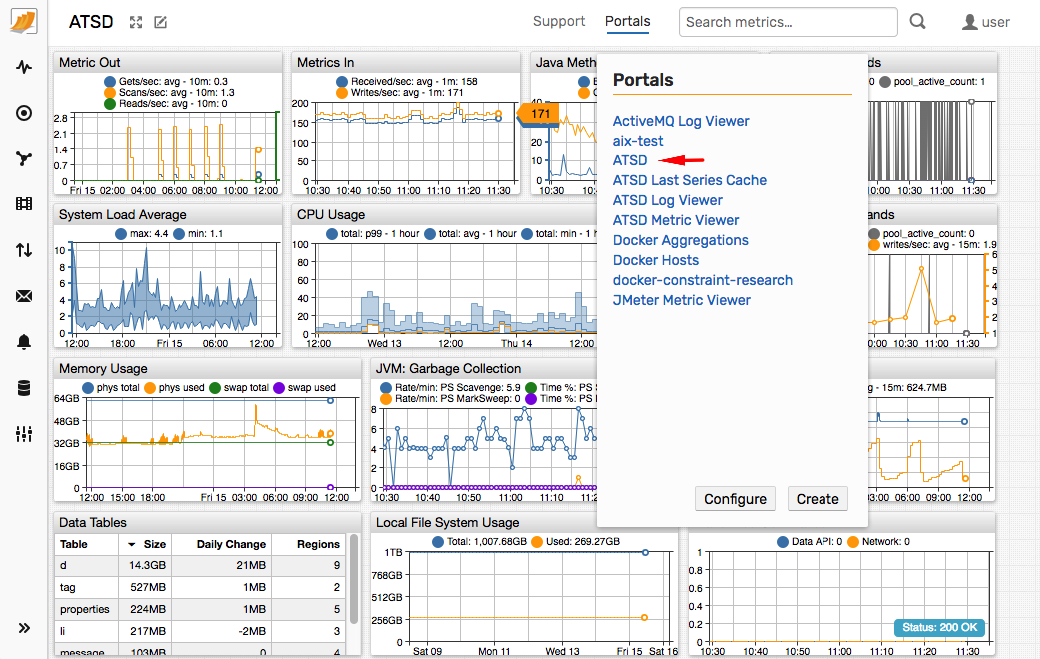
Screenshot of the Portals > ATSD portal for the time period covering the issue.
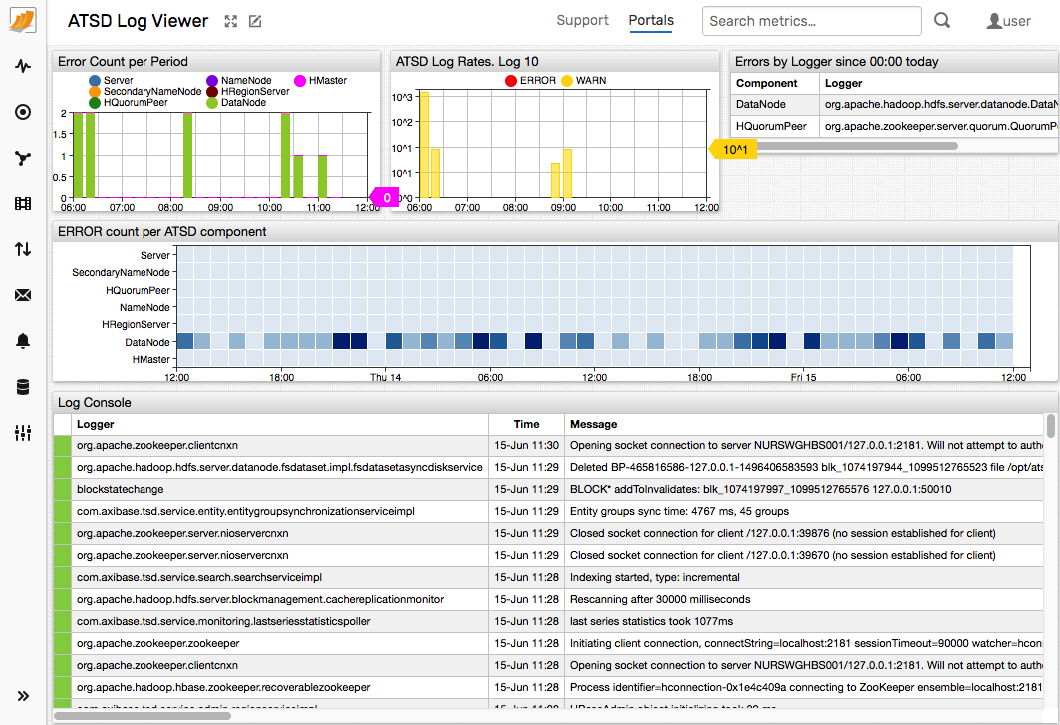
Screenshot of the Portals > ATSD Log Viewer portal for the time period covering the issue.
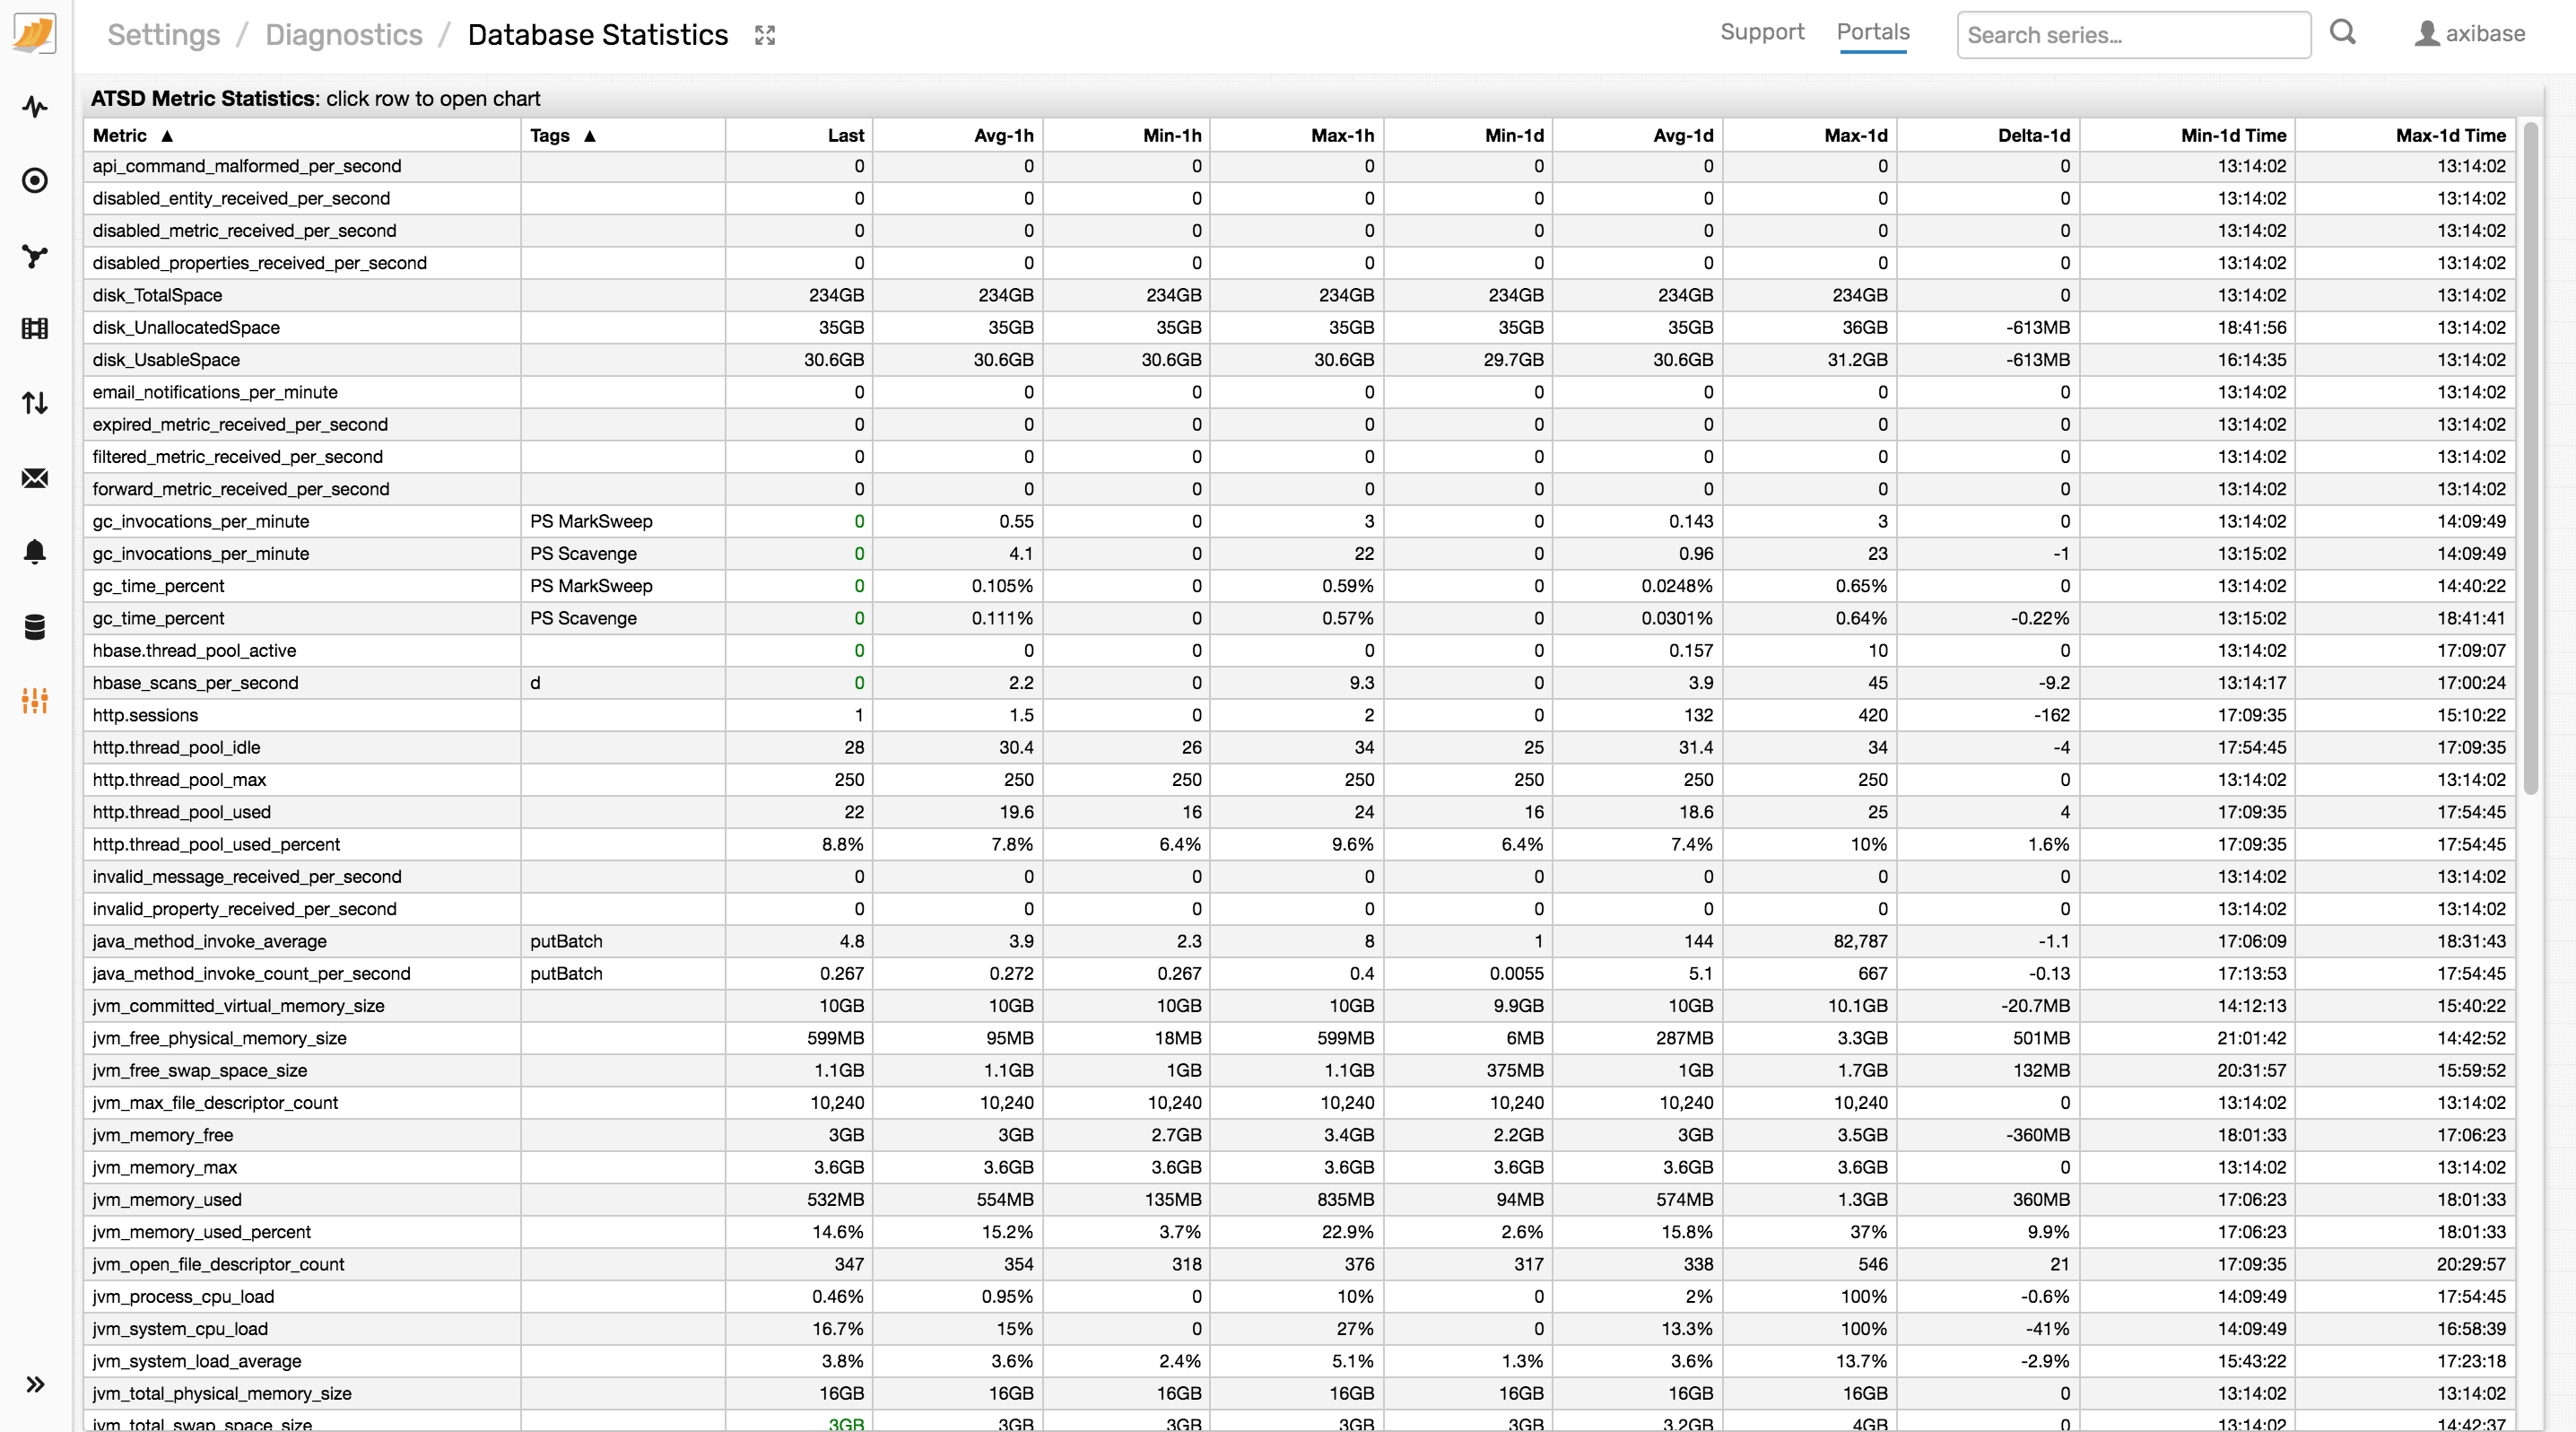
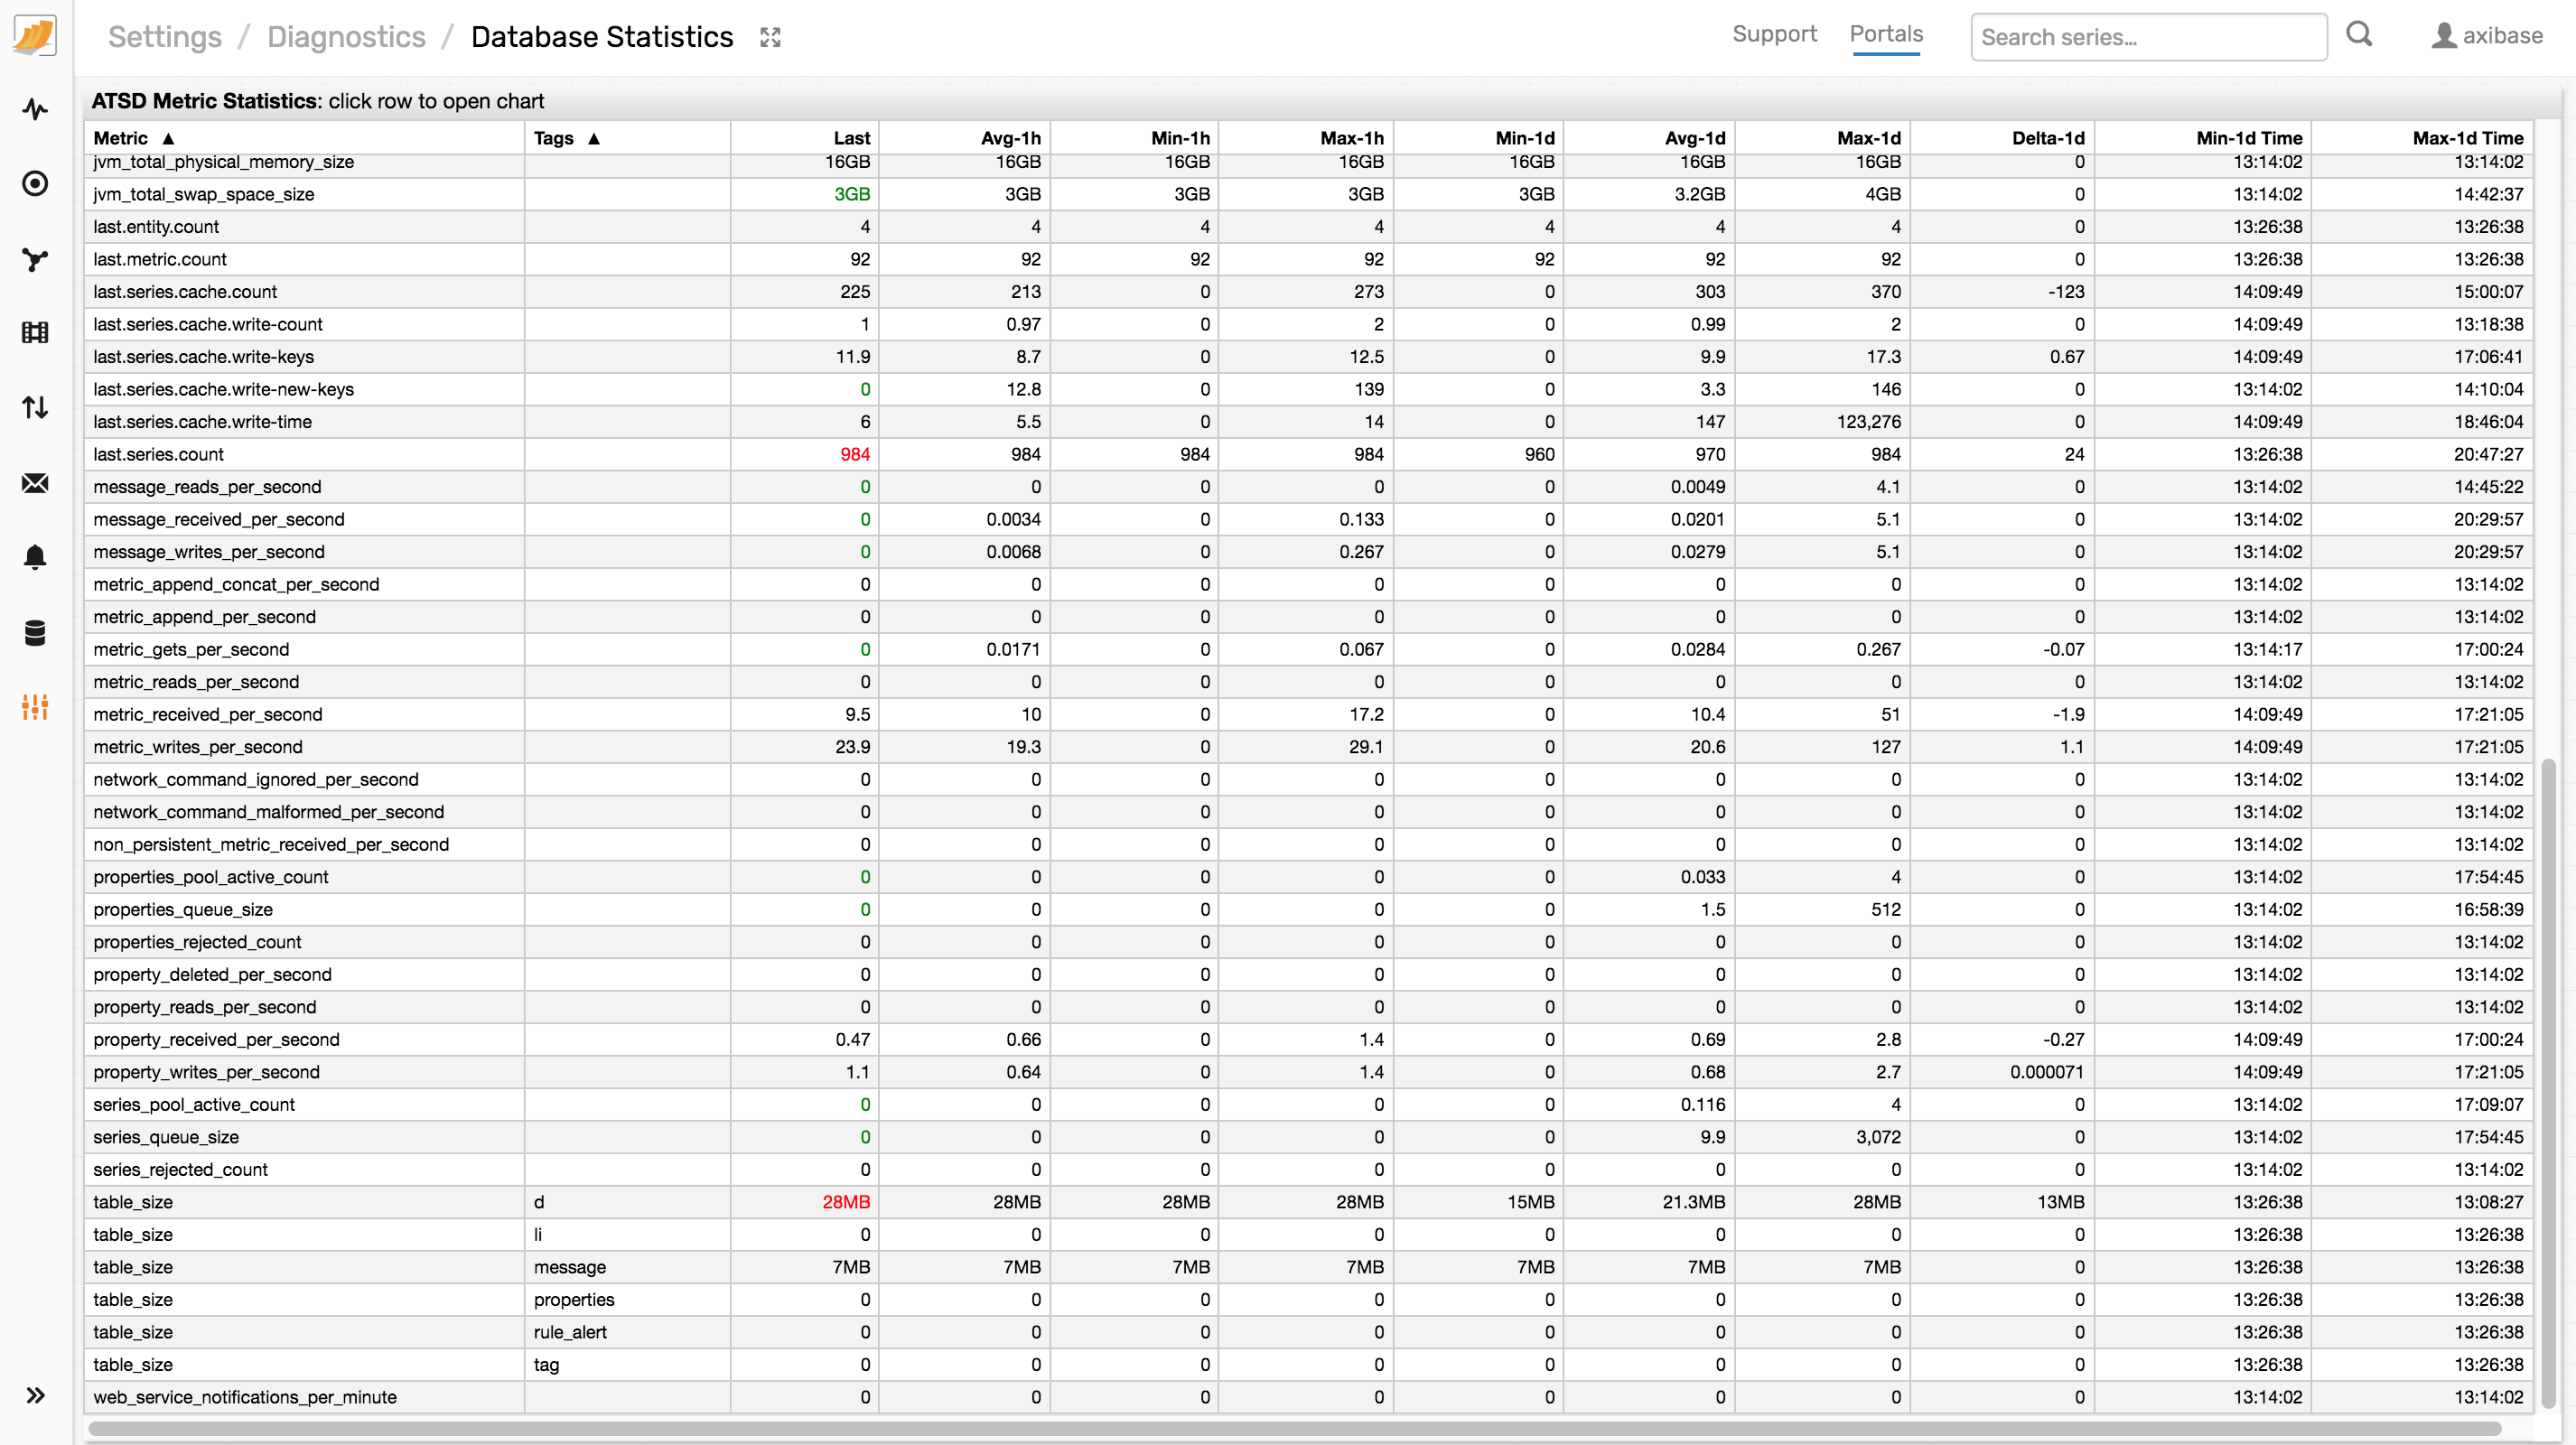
Screenshots of the Settings > Diagnostics > Database Statistics table.
CSV Export of the below query generated in the SQL Console. Modify the
datetimecondition to match the hour when the issue occurred.SELECT t1.datetime, t1.value AS api_cm, t2.value AS dis_mtr, t3.value AS exp_mtr, t4.value AS flt_mtr, t5.value AS fwd_mtr, t6.value AS hbs_scan, t7.value AS hsess, t8.value AS hpool, t9.value AS hpool_pct, t10.value AS jvm_com_vs, t11.value AS jvm_fr_pmem, t12.value AS jvm_fr_swap, t13.value AS max_file, t14.value AS mem_free, t15.value AS mem_max, t16.value AS mem_used, t17.value AS mem_used_pct, t18.value AS open_file, t19.value AS proc_load, t20.value AS sys_cpu_load, t21.value AS sys_loadavg, t22.value AS tot_phys_mem, t23.value AS tot_swap, t24.value AS mtr_gets, t25.value AS mtr_reads, t26.value AS mtr_recv, t27.value AS mtr_writes, t28.value AS net_cmd_ign, t29.value AS net_cmd_malf, t30.value AS non_pers, t31.value AS ser_pool_active, t32.value AS ser_queue, t33.value AS ser_rejc FROM api_command_malformed_per_second t1 JOIN disabled_metric_received_per_second t2 JOIN expired_metric_received_per_second t3 JOIN filtered_metric_received_per_second t4 JOIN forward_metric_received_per_second t5 JOIN using entity hbase_scans_per_second t6 JOIN http.sessions t7 JOIN http.thread_pool_used t8 JOIN http.thread_pool_used_percent t9 JOIN jvm_committed_virtual_memory_size t10 JOIN jvm_free_physical_memory_size t11 JOIN jvm_free_swap_space_size t12 JOIN jvm_max_file_descriptor_count t13 JOIN jvm_memory_free t14 JOIN jvm_memory_max t15 JOIN jvm_memory_used t16 JOIN jvm_memory_used_percent t17 JOIN jvm_open_file_descriptor_count t18 JOIN jvm_process_cpu_load t19 JOIN jvm_system_cpu_load t20 JOIN jvm_system_load_average t21 JOIN jvm_total_physical_memory_size t22 JOIN jvm_total_swap_space_size t23 JOIN metric_gets_per_second t24 JOIN metric_reads_per_second t25 JOIN metric_received_per_second t26 JOIN metric_writes_per_second t27 JOIN network_command_ignored_per_second t28 JOIN network_command_malformed_per_second t29 JOIN non_persistent_metric_received_per_second t30 JOIN series_pool_active_count t31 JOIN series_queue_size t32 JOIN series_rejected_count t33 WHERE t1.entity = 'atsd' AND t1.datetime BETWEEN '2018-05-01T08:00:00Z' AND '2018-05-01T09:00:00Z' WITH INTERPOLATE(1 MINUTE)
5. Portal Configuration
Attach the following inputs if the problem is related to charts, widgets, and portals.
Screenshot of the affected portal.
Portal configuration text from the Portals > Configure page.
Series query response captured using Developer Tools in the browser.
6. Client Libraries
API Client name and version.
Execution environment such as Python version and dependency module versions.
Error message reported by the client application.
7. JDBC Driver
Driver version.
The driver version can be obtained from the
atsd-jdbc-*.jarfile name, for exampleatsd-jdbc-1.4.0-DEPS.jaror from thePOMfile.<dependency> <groupId>com.axibase</groupId> <artifactId>atsd-jdbc</artifactId> <version>1.4.0</version> </dependency>Confirm that the driver version is compatible with the ATSD version.
JDBC URL including any connection properties specified when connecting to the database.
JVM version of the Java application executing the driver.
Java stack trace of the exception intercepted by the Java application.
8. SQL Queries
Provide the following details if an SQL query returns unexpected errors or incomplete/wrong results.
SQL query text.
Query results in CSV format exported in the SQL console or using the SQL bash client.
./sql.sh -i query.sql -f csv -o results.csvCompress the CSV file to a
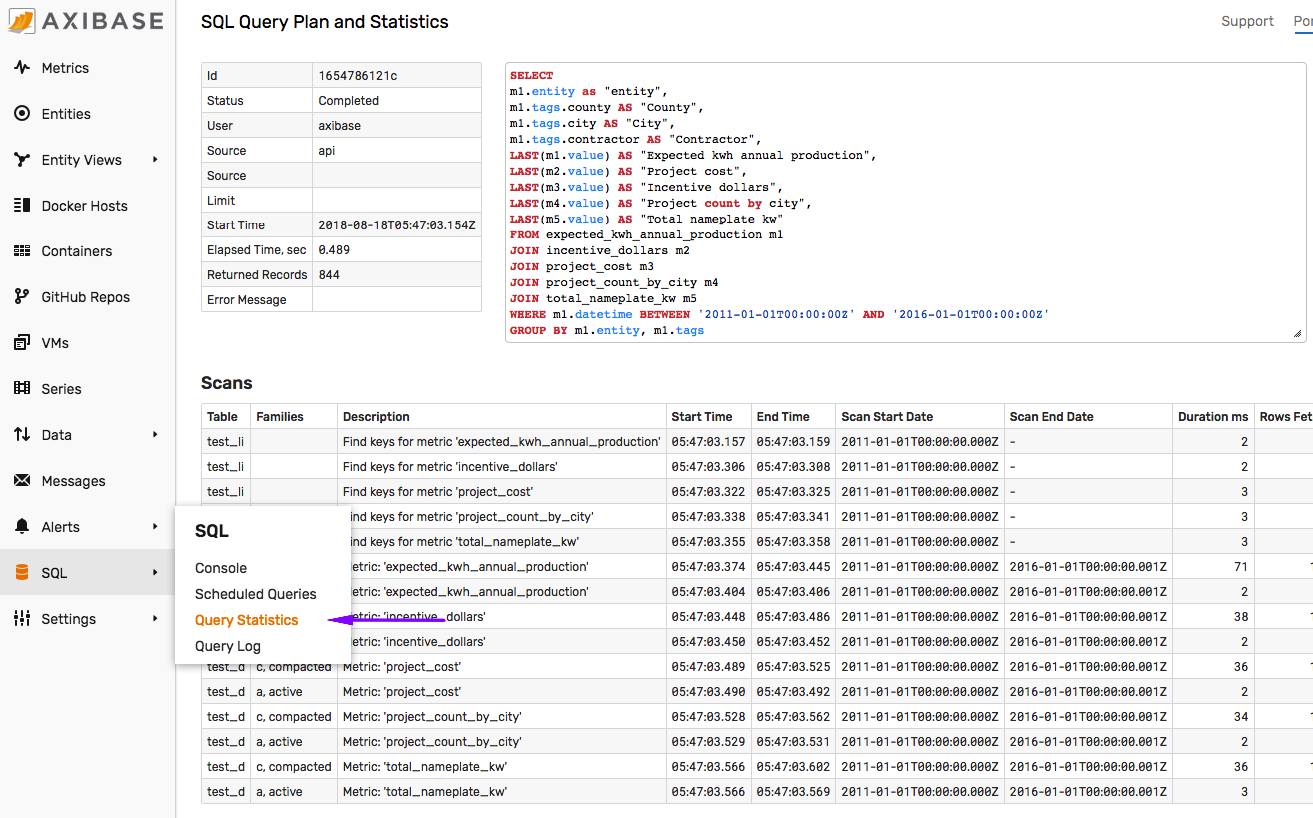
ziporgziparchive to reduce the attachment size.SQL query plan screenshot from the SQL > Query Statistics page.