Analyzing and Combining Iowa Employment and Consumer Price Index Socrata Datasets
Introduction
For easier access to public datasets like Employee Financial Compensation by Industry in Iowa, the Unites States government curates data.gov. Datasets are available online to conduct research, develop web applications, and design data visualizations on a variety of topics ranging
from agriculture and manufacturing, to healthcare and society.
- According to the US Bureau of Labor Statistics, as of September 2016, the unemployment rate in Iowa is 4.2%, which is lower than then overall US average of 5.0%.
- From September 2015 to September 2016, the state of Iowa added roughly 29,600 non-farm jobs which increased the total number of non-farm employed people in the state to around 1,587,800. This marks a growth of 1.9%. The US as a whole for this same period achieved a slight lesser growth rate of 1.8%.
The governments at the federal, state, city, and county level publish datasets in Socrata Open Data format.
ATSD supports the combination of multiple datasets in one portal. This integration uses data collected from the Bureau of Labor Statistics.
Iowa Employee Compensation Dataset
Explore the Employee Financial Compensation by Industry in Iowa on
data.gov
The state of Iowa collects estimated employee compensation values in non-adjusted dollar value. Compensation is the total remuneration, both monetary and in kind, payable by employers to employees in return for work during some period.
The state aggregates data in to one of three industries, each with sub-categories:
- Farm
- Farm
- Government and Government Enterprises
- Federal and Civilian
- Military
- State and Local
- Private Non-farm
- Administrative and support of waste management and remediation services
- Accommodation and food services
- Arts, entertainment, and recreation
- Construction
- Educational services
- Finance and insurance
- Forestry, fishing, and related activities
- Health care and social assistance
- Information
- Management of companies and enterprises
- Manufacturing
- Mining, quarrying, and oil and gas extraction
- Professional, scientific, and technical services
- Real estate and rental and leasing
- Retail trade
- Transportation and warehousing
- Wholesale trade
- Utilities
- Other Services (except public administration)
Download the dataset in CSV, RDF, JSON, or XML format.
Axibase Time Series Database
Axibase Collector contains built-in heuristics to parse Socrata format data. Collector uses Socrata metadata to interpret the meaning of columns and extract times, dates, and categories from the raw data. ATSD stores data in a local database instance which allows you to combine this public dataset with those generated locally.
With ATSD and Collector:
- Load additional datasets from
data.gov. - Design and manipulate database table schema.
- Provision application server tasks.
- Write programs which parse irregular files.
Configure a scheduled job to retrieve the data from a specified ATSD endpoint and parse any dataset according to pre-defined rules. Once a dataset is loaded, creating and sharing reports with built-in widgets is simple using examples from Charts Documentation. The database continuously updates the dataset as new data is published by the state of Iowa.
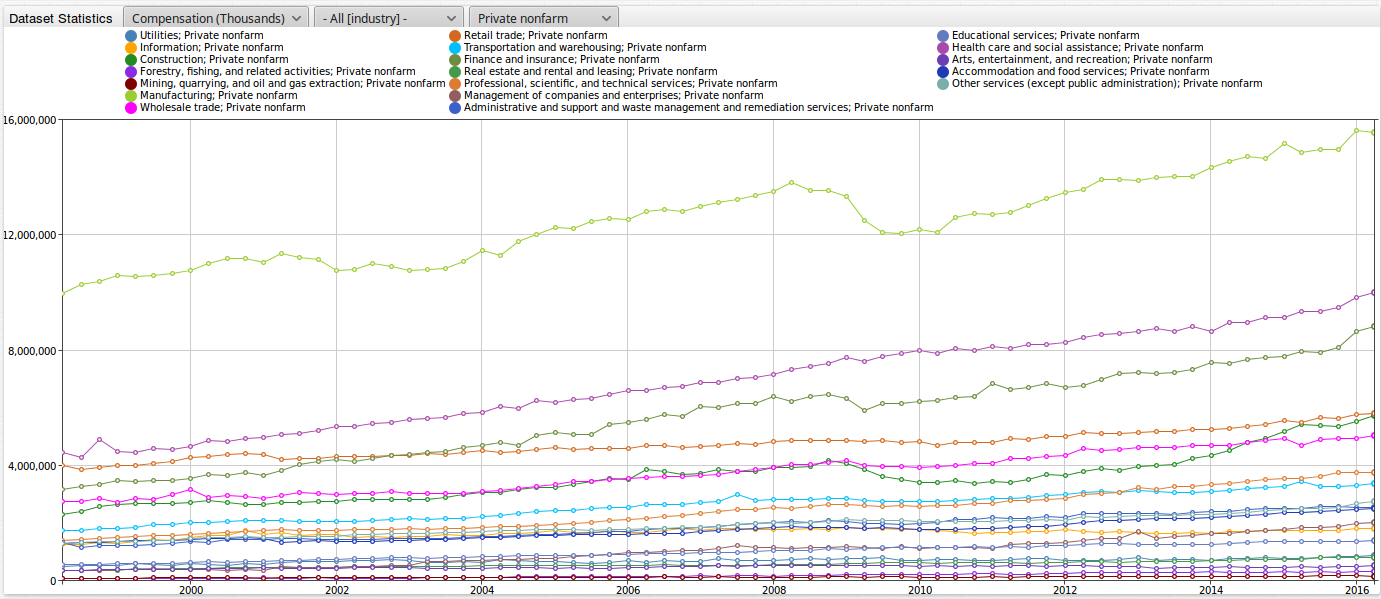
The portal below displays total statewide employee compensation for each of the 23 recorded industries.
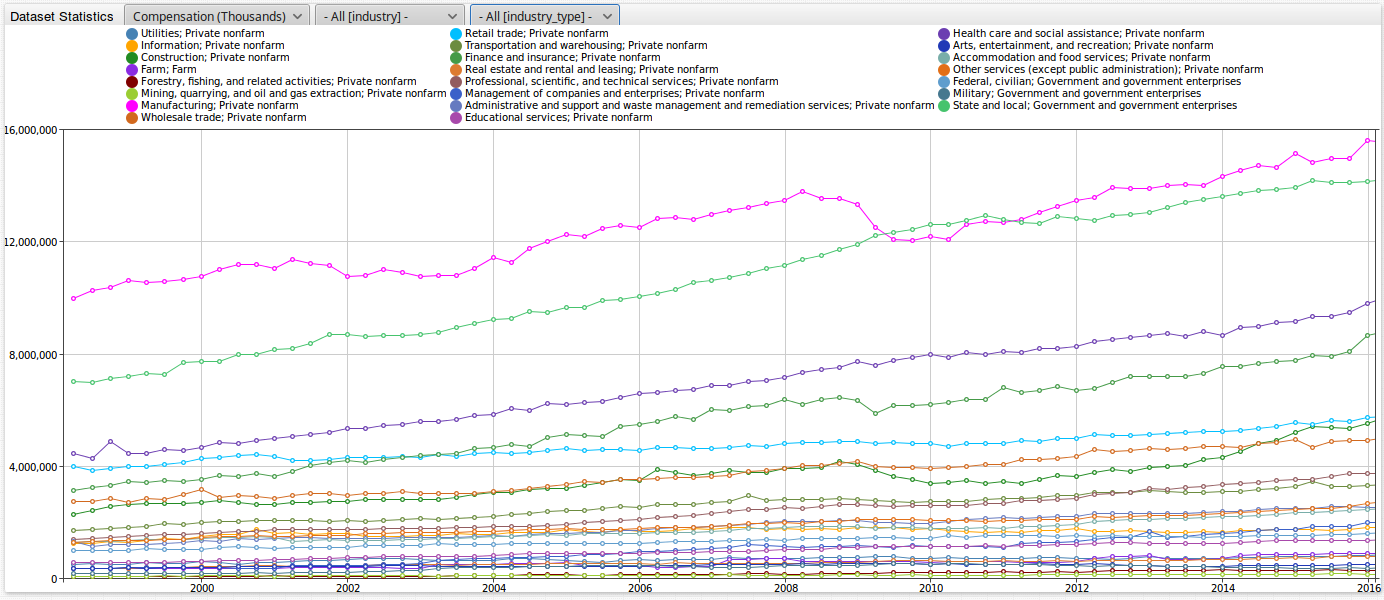

Open the ChartLab portal above and explore the Iowa compensation dataset using the drop-down lists:
- Metric: View the data for a specified metric.
- Industry: Filter each of the 23 industries. The visualization above shows all industries.
- Sub-Category: Filter by industry group.
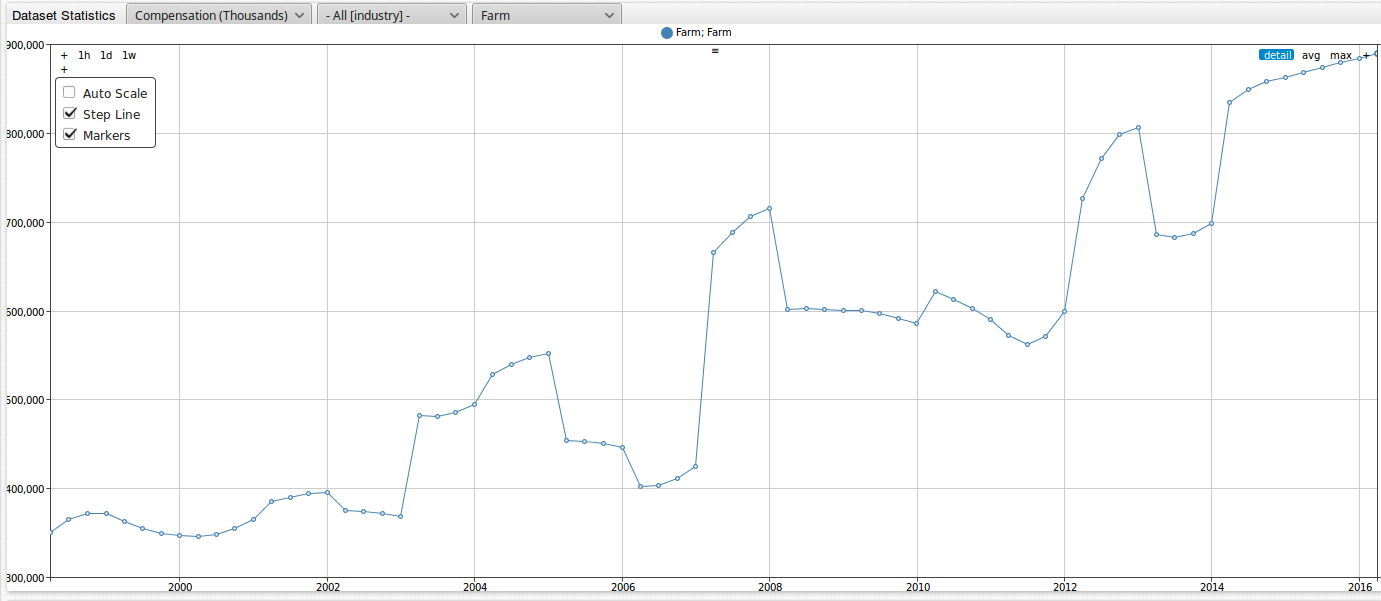
Select Farm from the industry_type drop-down list.
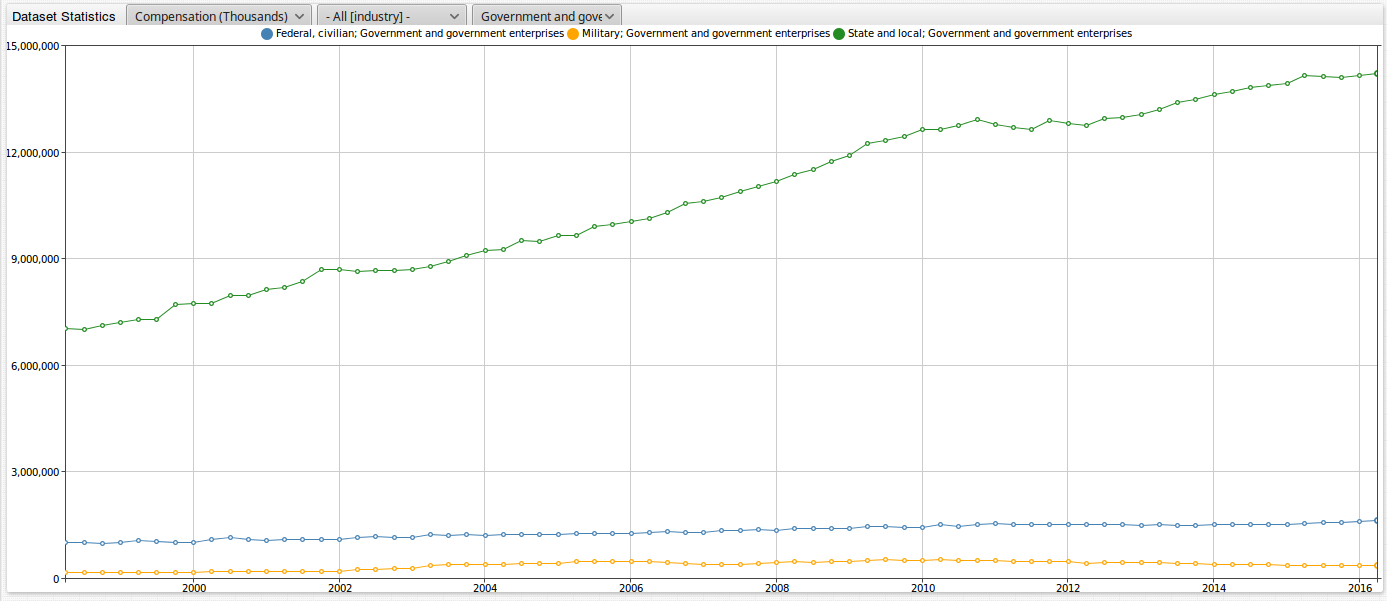
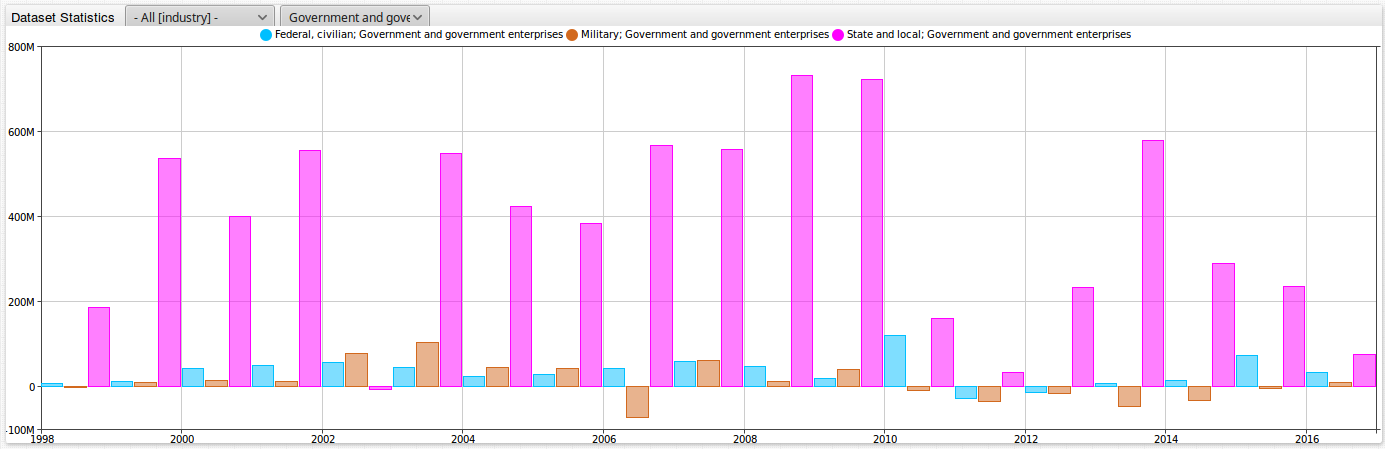
Select Government and Government Enterprises from the industry_type drop-down list.
The compensation for the Federal and Civilian and Military sectors increases at a lesser rate than State and Local compensation.
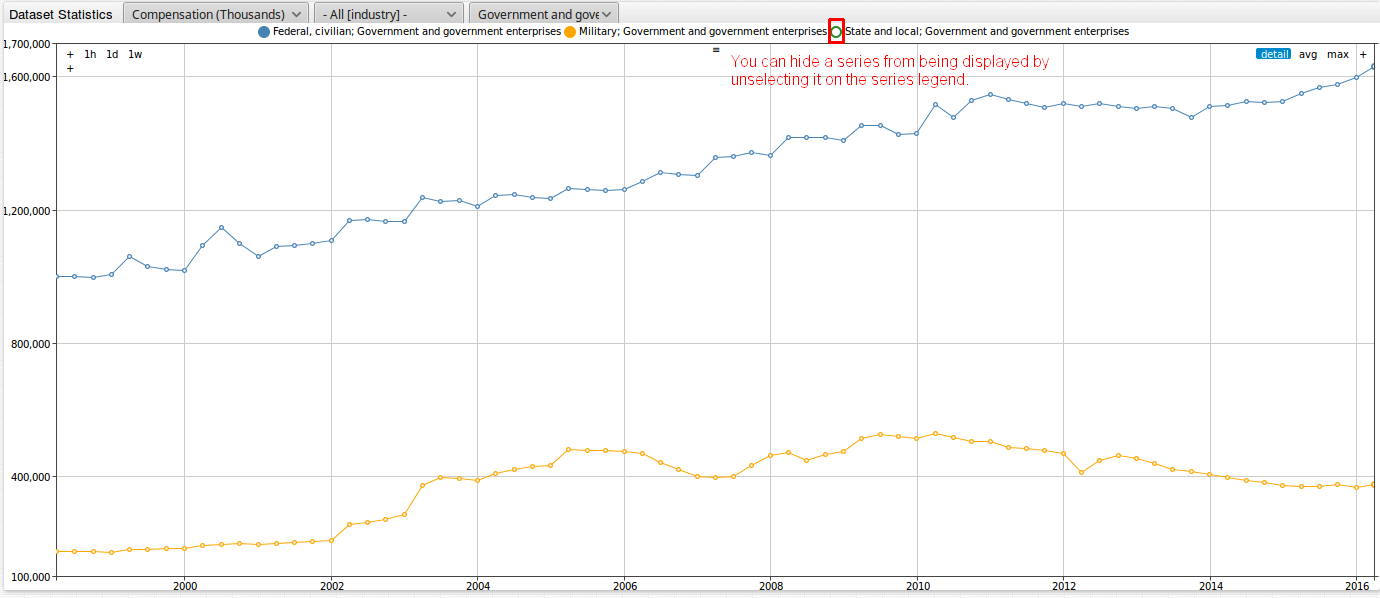
Exclude series from the filtered view with the series legend. The image below hides the State and Local series.
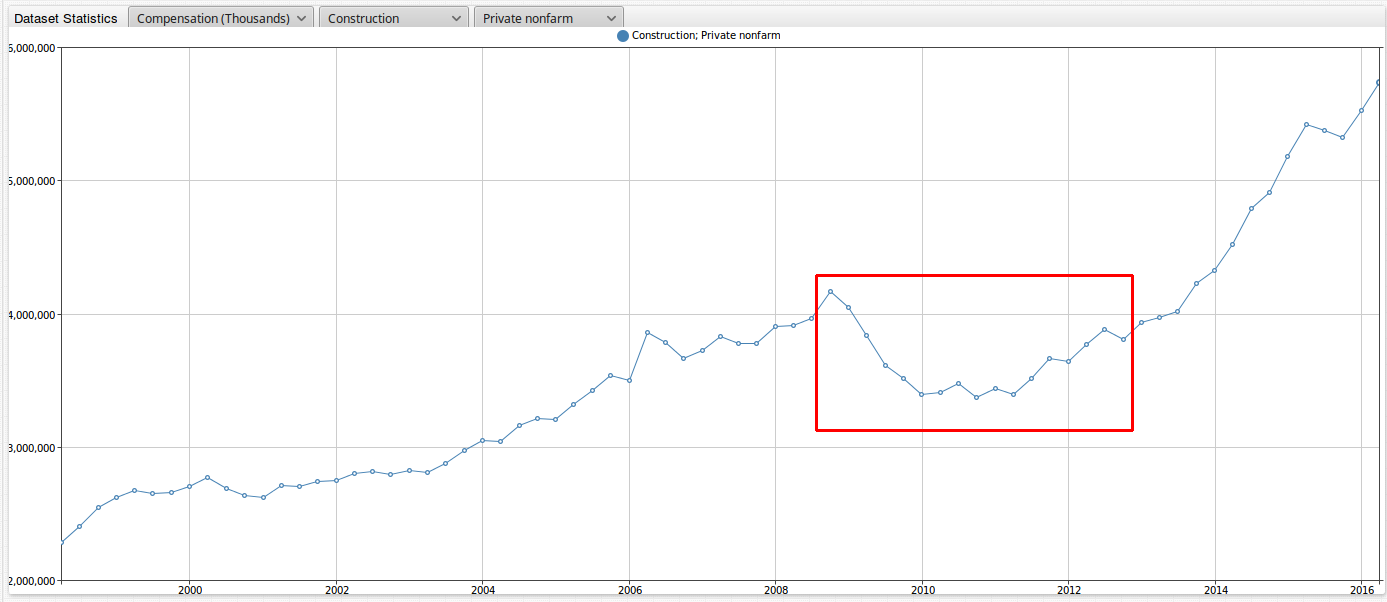
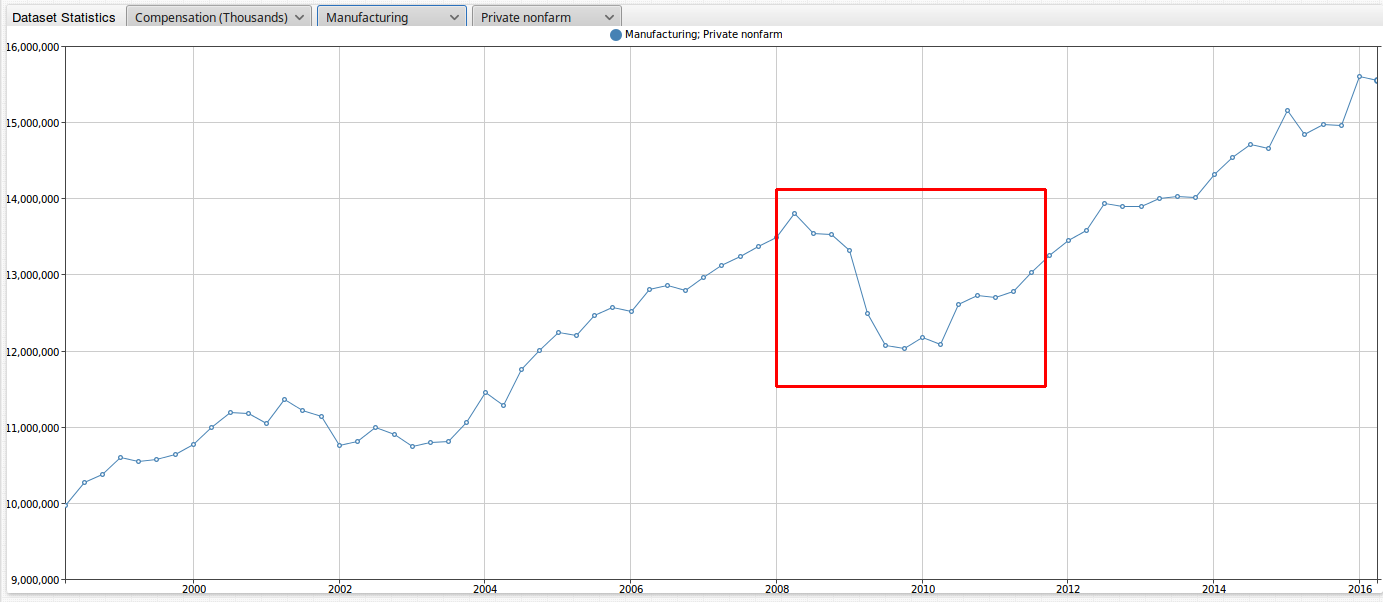
Select the Private Non-Farm series from the industry_type drop-down list.
Filter for the Construction and Manufacturing metrics with the industry drop-down list. Both industries visibly suffered during the Great Recession.
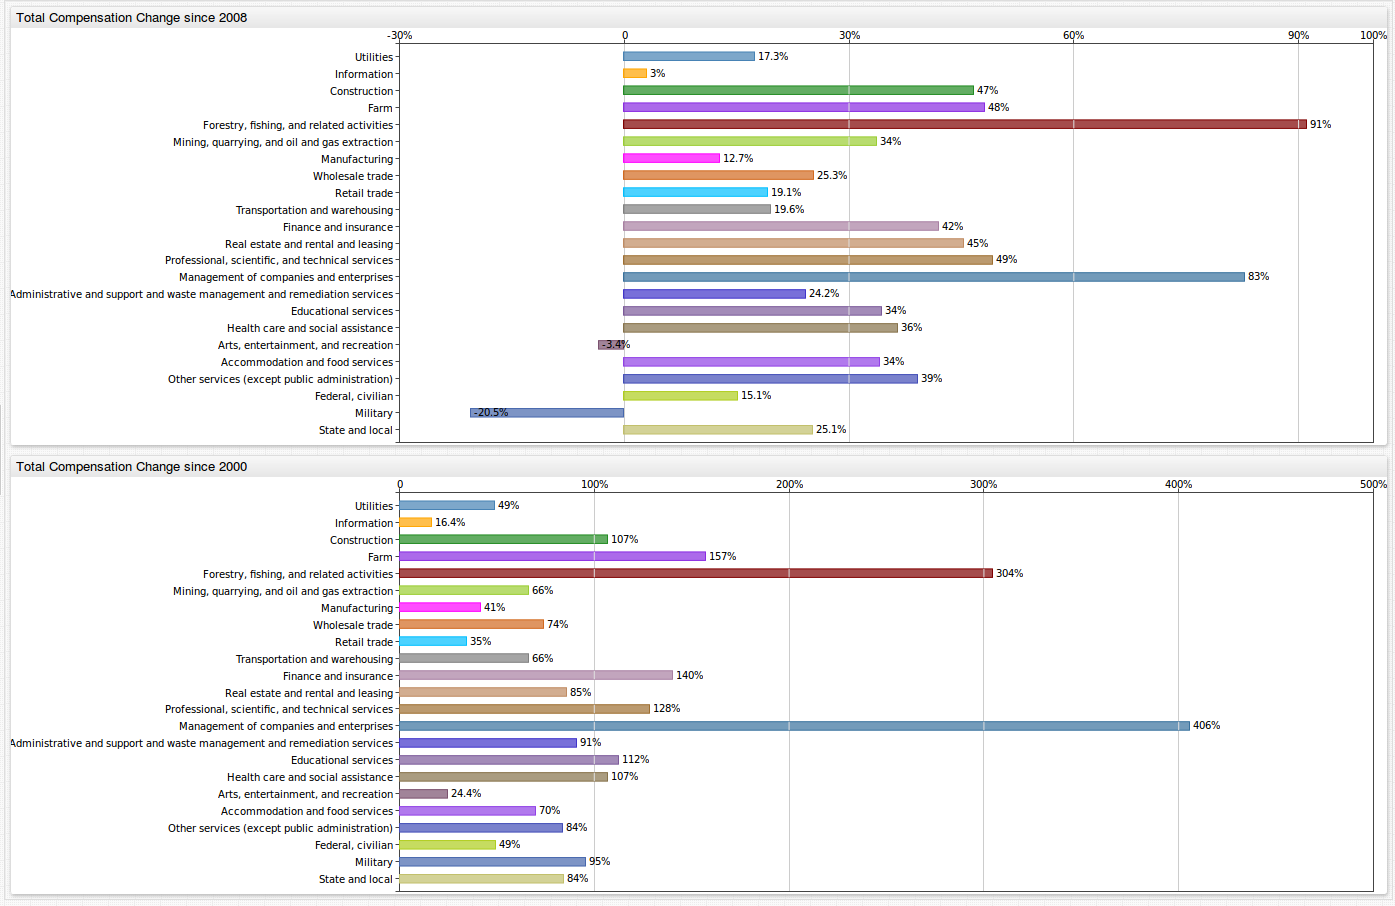
The portal below visualizes total compensation change per industry in Iowa since 2008 and 2000 using a bar chart.
Refer to Charts Documentation for information about other ChartLab widgets.
Additional Iowa Datasets: State of Iowa Employment by Month and Industry
Insert additional data in ATSD to give the above data further context such as a dataset which tracks the gross number of employees working in Iowa.
Navigate to Gov Data | State of Iowa.
On the home page, select the Employment tab.
Scroll to the bottom of the page and open the Topics drop-down list. Select Employment.
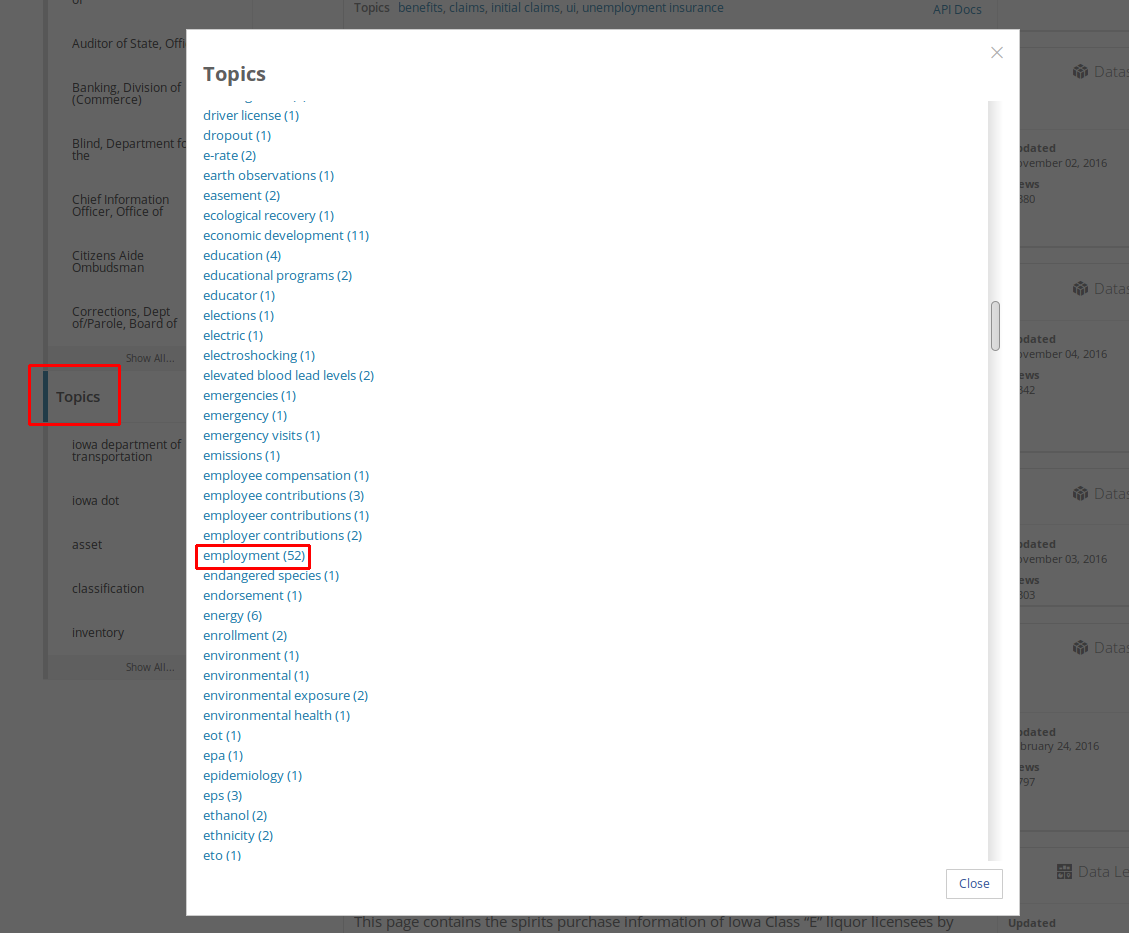
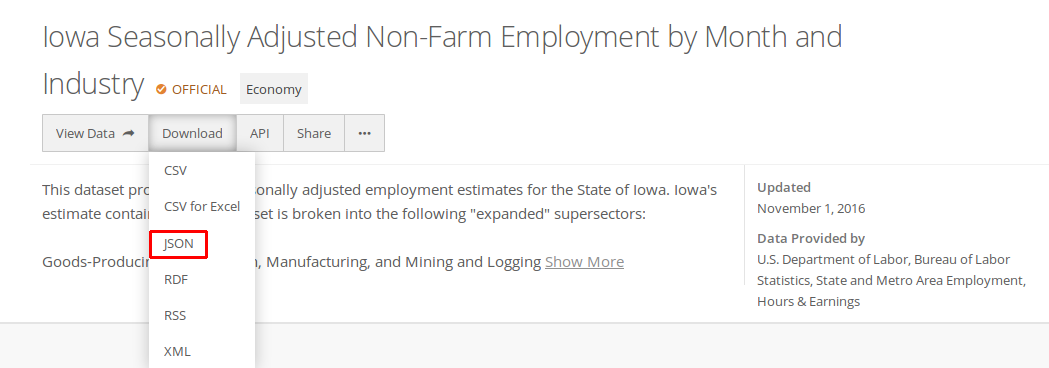
Select Iowa Seasonally Adjusted Non-Farm Employment by Month and Industry.
Open the Download drop-down list and select JSON.
The Iowa Seasonally Adjusted Non-Farm Employment by Month and Industry is visualized below.
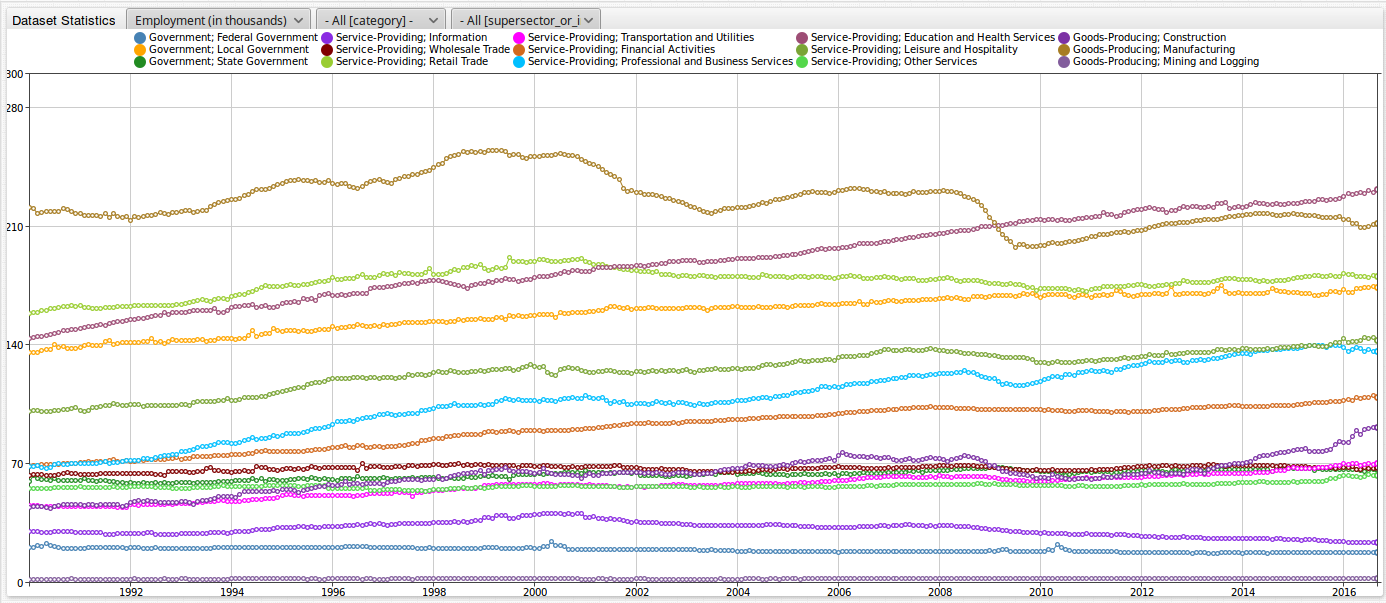
The state of Iowa publishes data for each of the following industries and sub-categories:
- Goods producing
- Construction
- Manufacturing
- Mining and Logging
- Government
- Federal Government
- Local Government
- State Government
- Service providing
- Education and Health Services
- Financial Activities
- Information
- Leisure and Hospitality
- Professional and Business Services
- Retail Trade
- Transportation and Utilities
- Wholesale Trade
Filter data and create interactive functions for any visualization. Open the ChartLab portal below and explore the Iowa employment dataset using the drop-down lists:
- Metric: View data for a specified metric.
- Industry: Filter by each of the three industries.
- Sub-Category: Filter by sub-category.
Explore specific metrics in the Iowa Seasonally Adjusted Non-Farm Employment by Month and Industry dataset. As with the total statewide employee compensation dataset, filter for the Construction and Manufacturing metrics. The visualizations for the Construction and Manufacturing metrics, respectively.
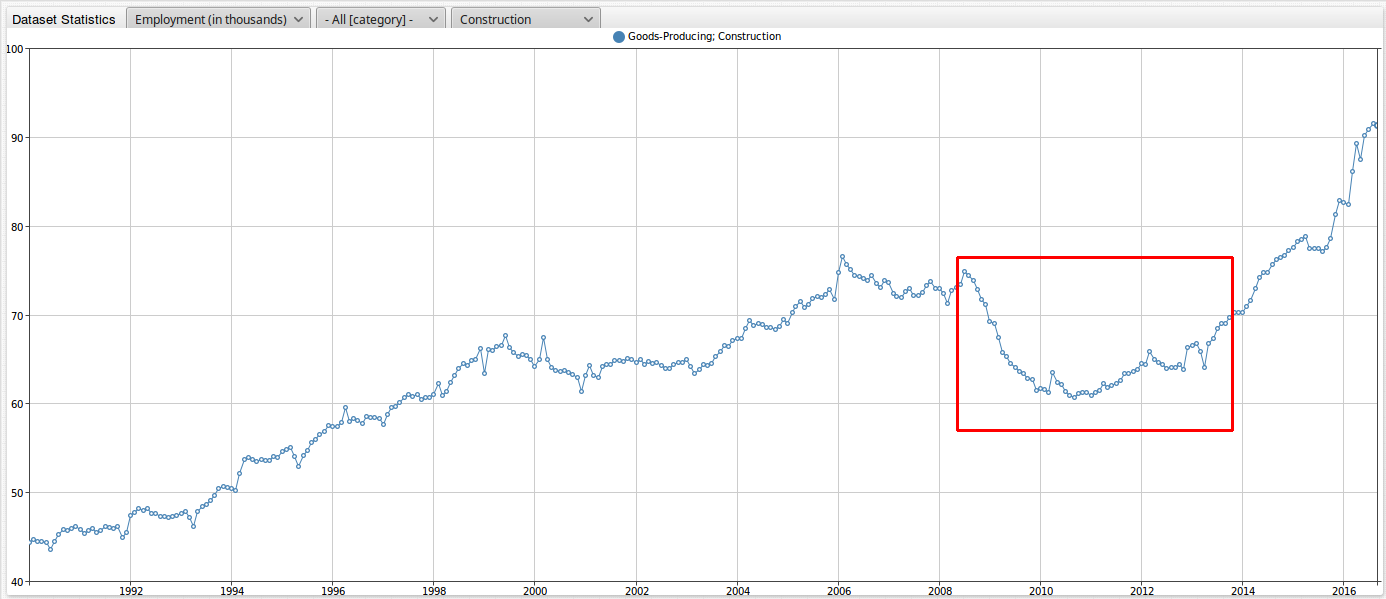
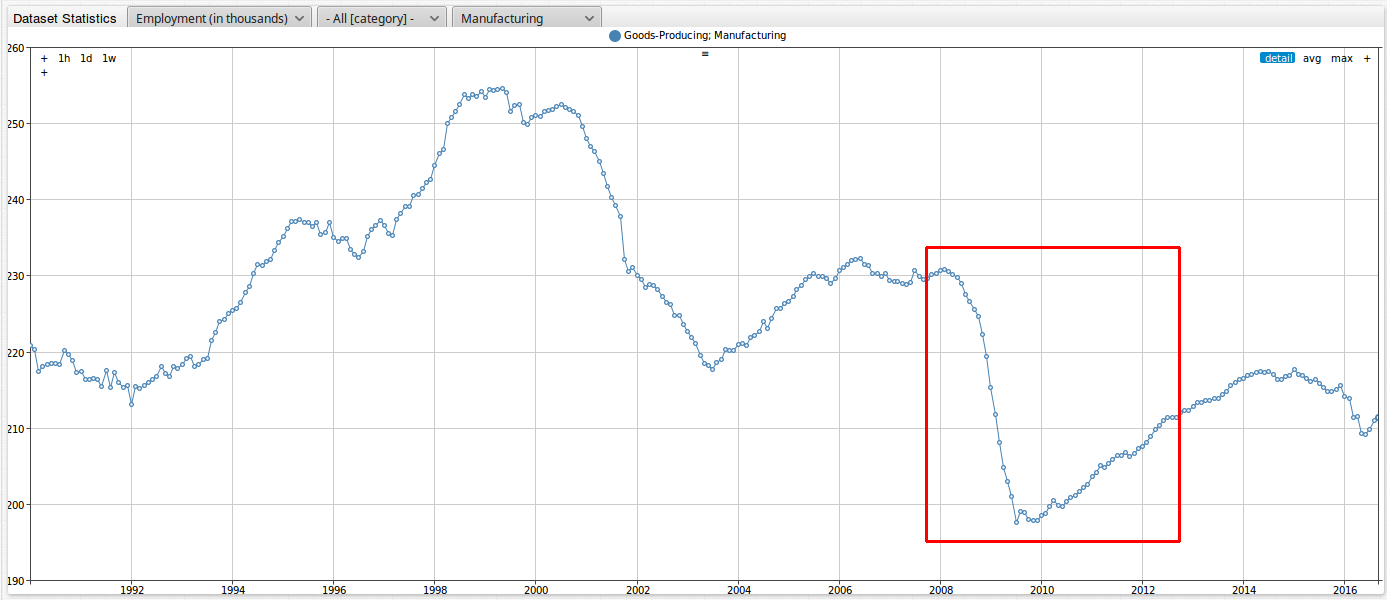
The same decline correlating with the recession period is highlighted the figures above.
Below is a table of datasets from data.iowa.gov which are available in ChartLab. Modify configuration in the Editor window to compare data across entities. For more information about ChartLab syntax or selecting series, see the ChartLab Introduction.
If a dataset appears to be unavailable, raise an issue on the Axibase GitHub page.
Change the entity in the default portal to Unemployment insurance benefit payments by industry.
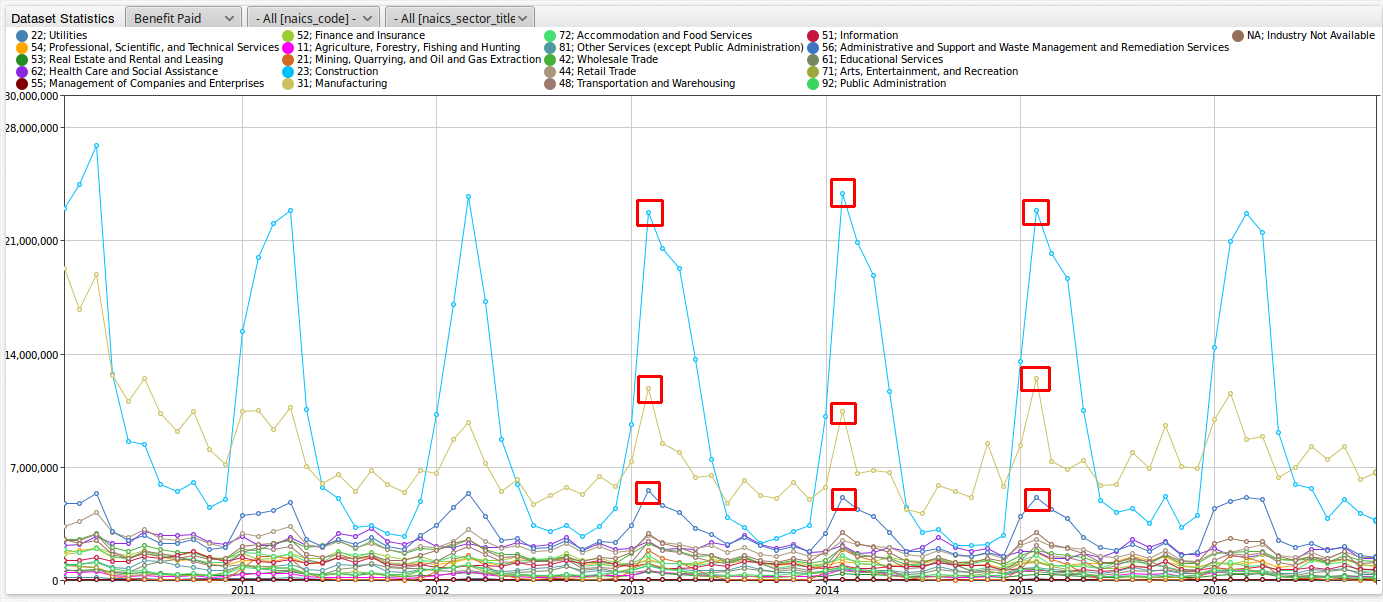
Highlight in the image above for the Construction, Manufacturing, and Administration and Support of Waste Management and Remediation Services metrics, insurance benefit payments follow a cyclical yearly pattern.
Navigate to Unemployment insurance claims and payments (statewide - monthly) by using entity jpje-kkb9.
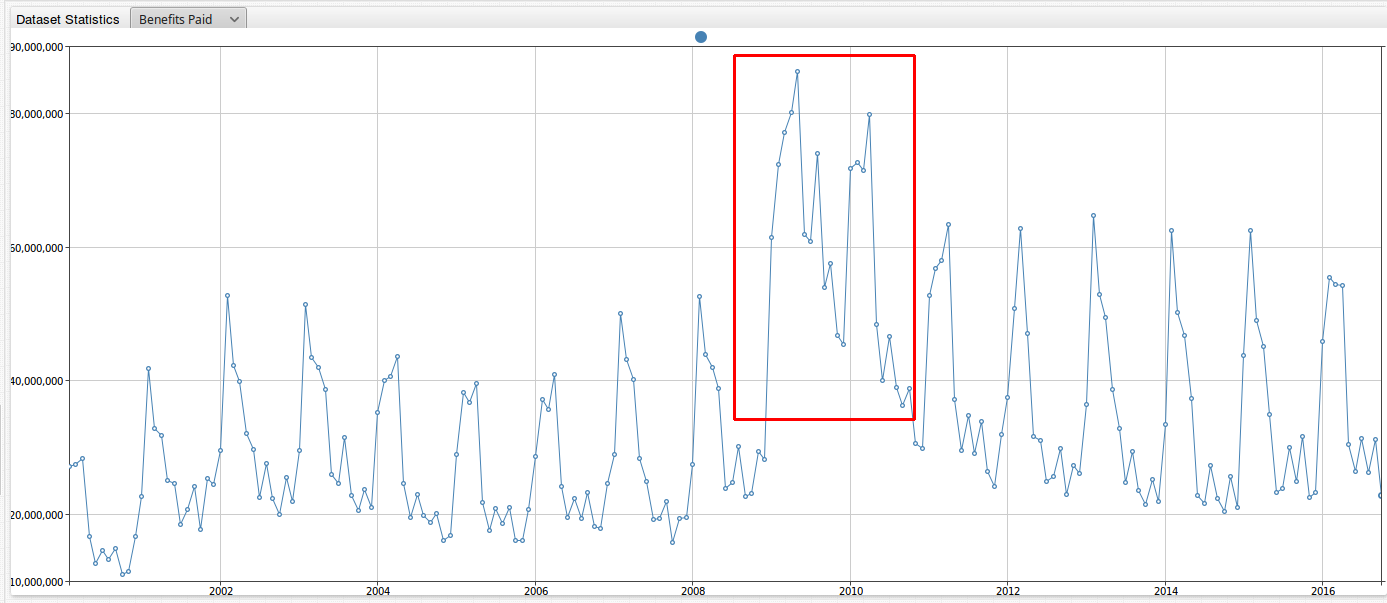
This dataset follows a similar trend, with payments tending to peak in January of each year and fall throughout the remaining months. However, in the late 2000's, the series shifted upward, highlighted in the figure above.
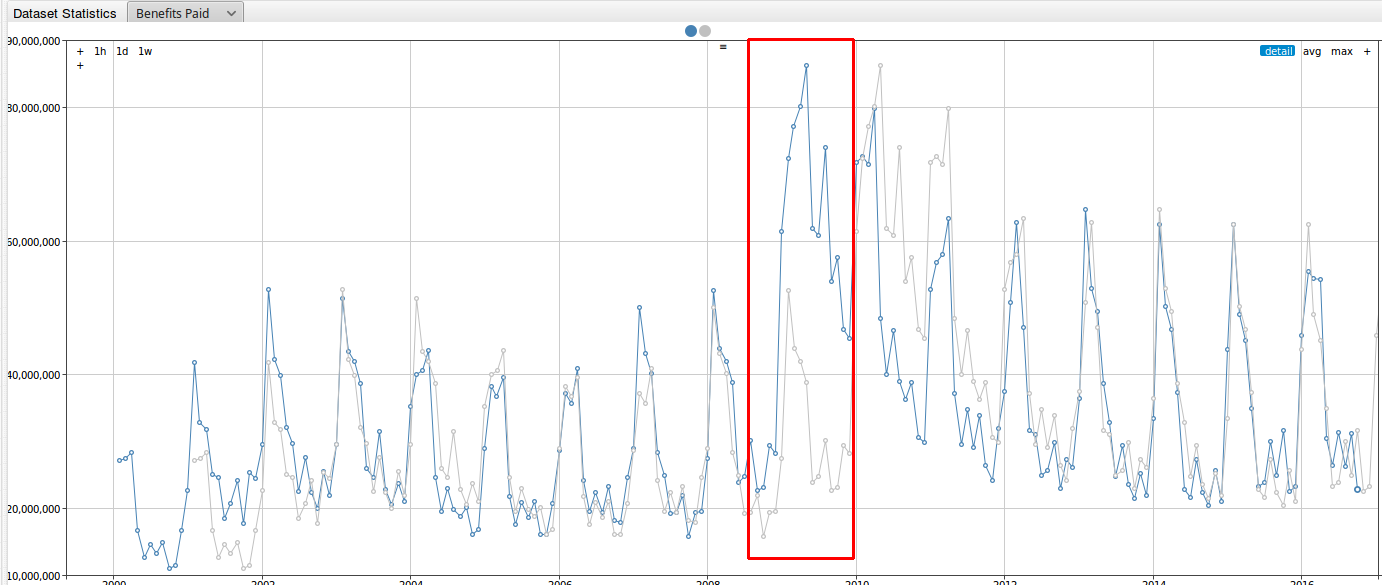
Use a time-offset setting to compare previous year data.
[series]
  time-offset = 1 year
  color = silver
2016 data is shown below in blue and 2015 data is gray. The red box below highlights the dramatic difference when making year-on-year comparisons.
To summarize the effects of the Great Recession in three parts:
- Decrease in total compensation for the state of Iowa.
- Decrease in total number of non-farm employees in the state of Iowa.
- Increase in total of unemployment insurance benefit payments for the state of Iowa.
A Closer look at the Iowa Economy
ATSD supports the combination of several datasets from multiple entities in a single portal. Take these datasets and compute additional metrics to create more in-depth level of analysis. The following sections explore compensation per employee, adjusted with consumer price index (CPI) statistics to account for inflation for employees in the federal government working in the state of Iowa.
The image below shows year-on-year growth experienced by the government and government enterprises industry in Iowa.
Divide total employee compensation by the total number of employees to compute an average wage (adjusted with CPI values) for this industry as a new metric.
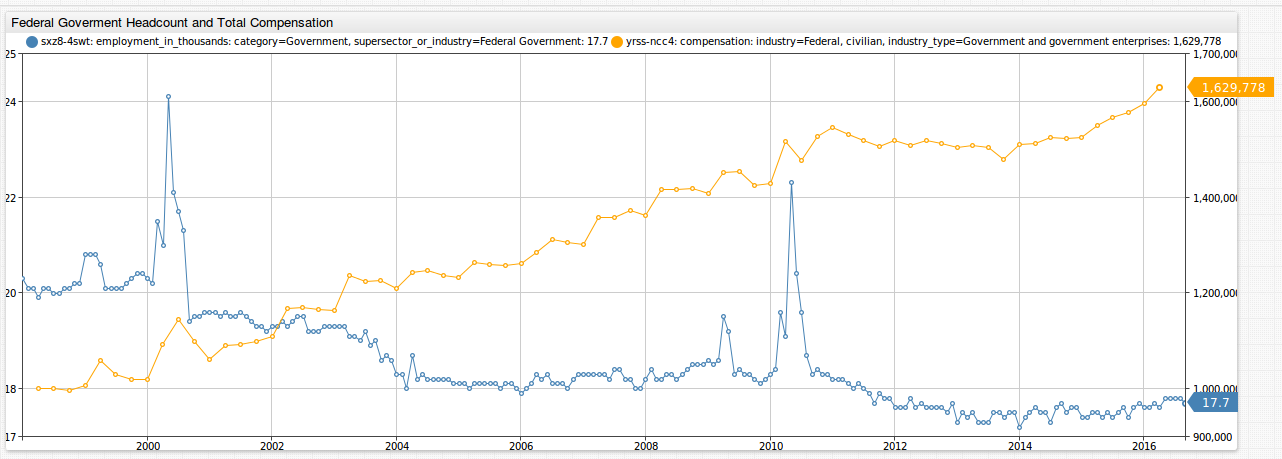
The image below shows the initial configuration for this visualization.
Add a [series] section for both fields by specifying the respective entity and metric names. Next, use [tags] settings to display more specific information, in this case federal government data. Finally, include an axis setting.
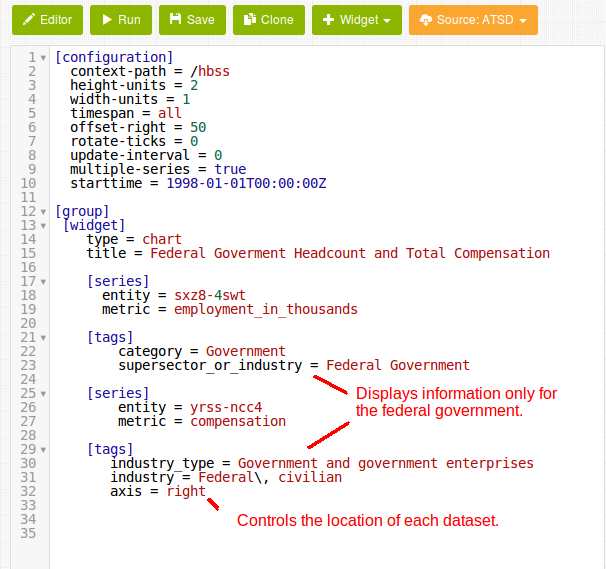
The resulting visualization is shown below:
Over time, despite the fact that the total number of employees has decreased, the total employee compensation has increased. The number of federal government employees in the state decreased from 20,300 to 17,700 but the total compensation increased from $999,528,000 to $1,629,778,000.
Next, compute the average federal government compensation per employee.
The ChartLab configuration is shown below:
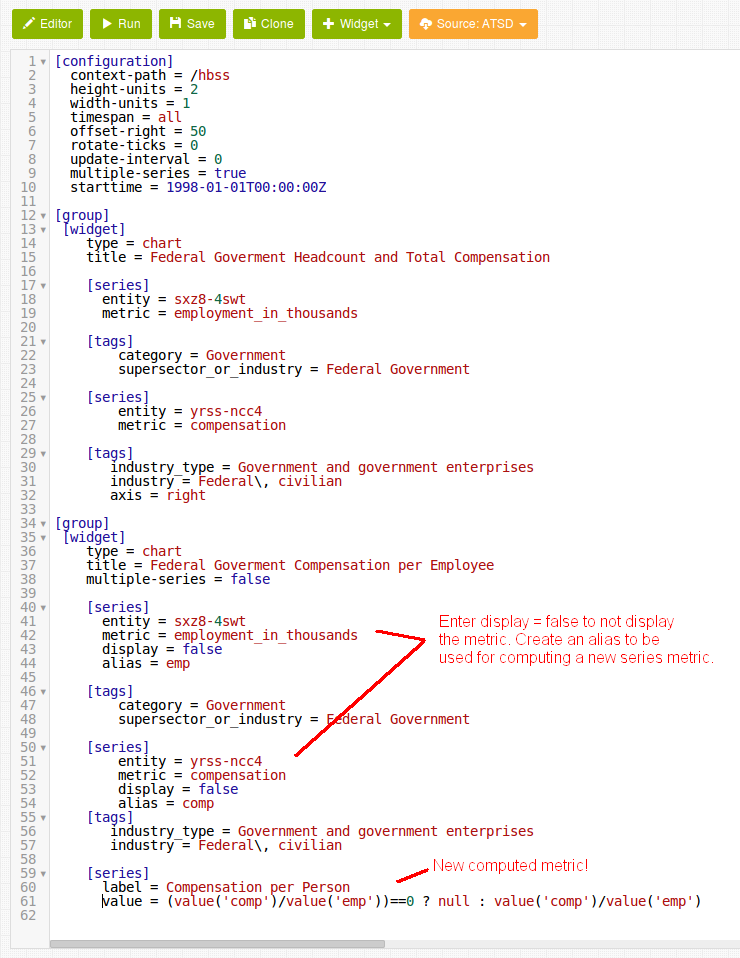
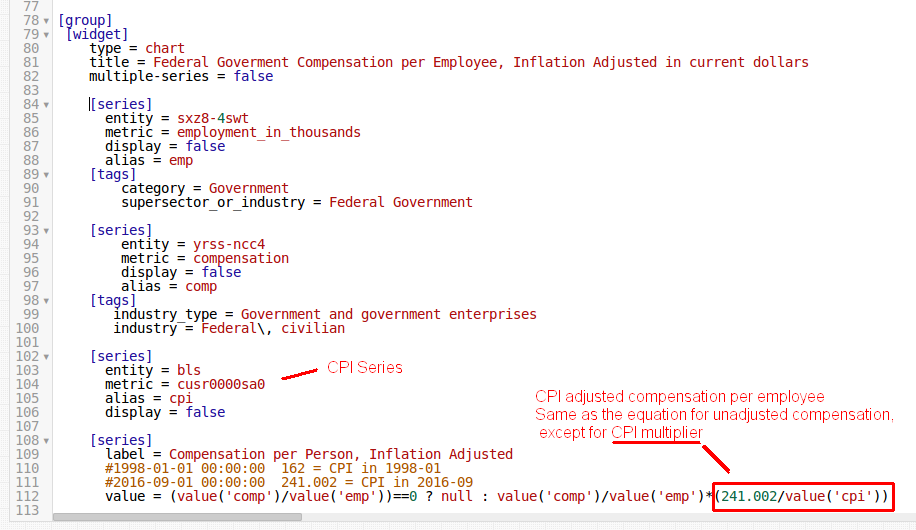
Begin by specifying the [series] and [tags] clauses. To display only the average employee compensation in this output, specify display = false for both series used for calculation. Next, assign these series an alias. Finally, specify a value with the formula used by ChartLab to calculate the new derived series.
The underlying formula is shown here:
value = (value('comp')/value('emp'))==0 ? null : value('comp')/value('emp')
Divide the total employee compensation in the state (comp) by the total number of employees in the state (emp). Because the start-time values for these two series differ, the beginning of the equation serves to set any non-real values (timestamps which do not contain data for both series) as NULL.
Below is an image of the average employee compensation for the federal government industry in the state of Iowa.
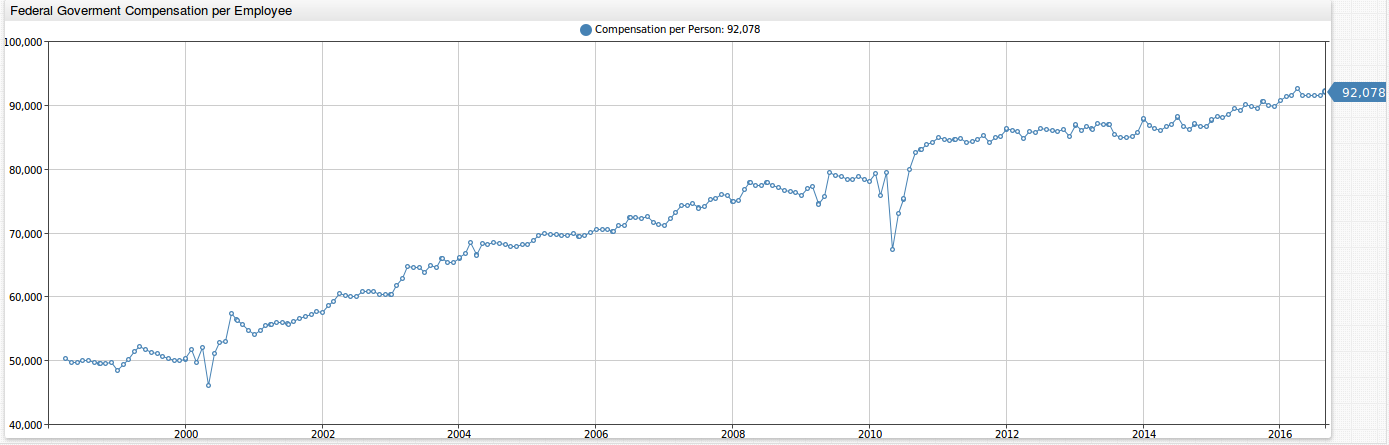
The unadjusted average salary for a federal government employee in the state increased from $50,211 in March of 1998 to $92,078 in September of 2016.
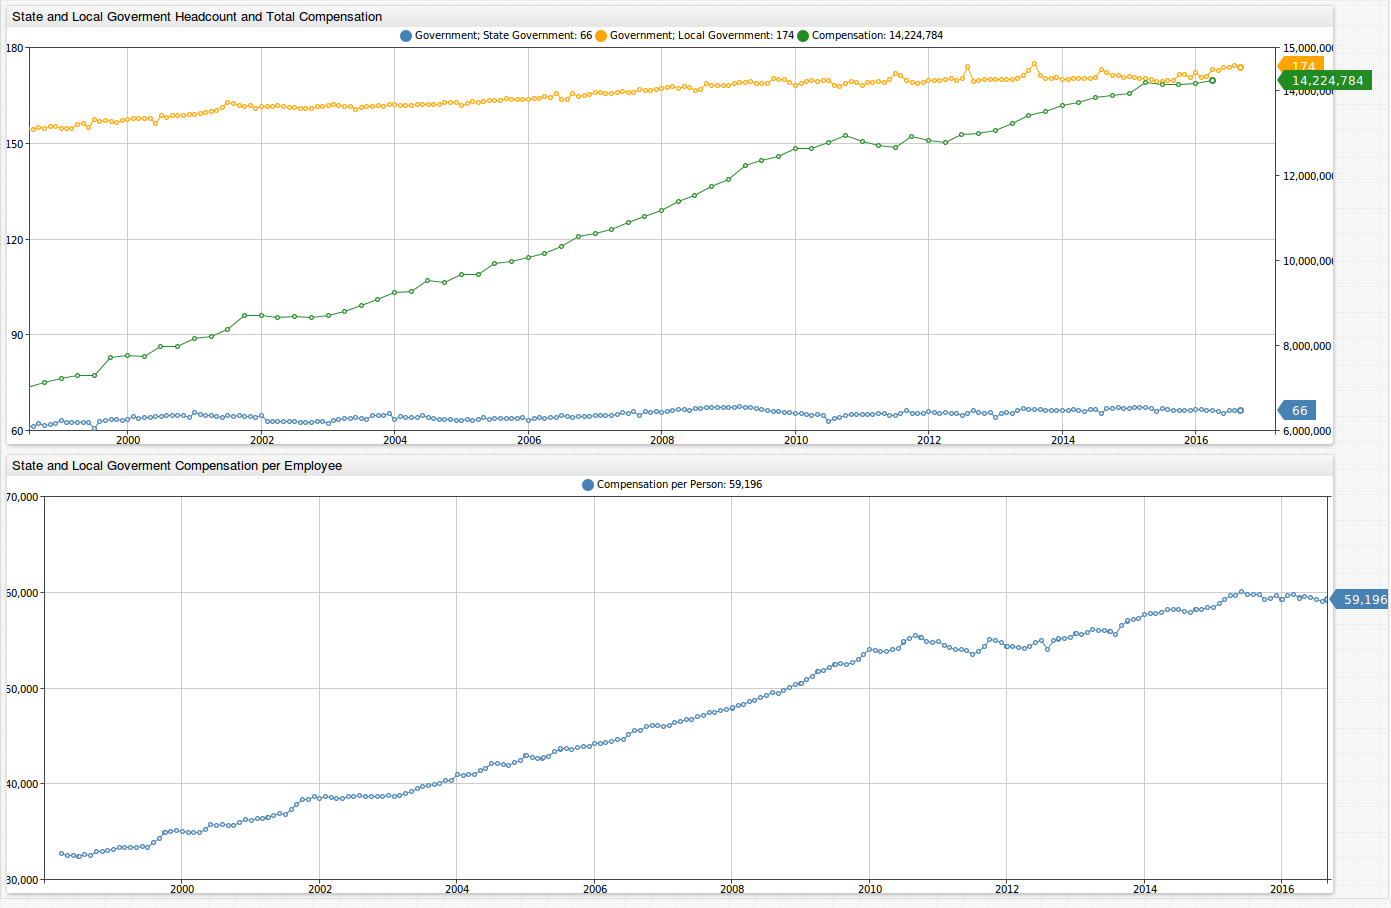
The visualization below shows the average salary for local and state government employees in Iowa. The unadjusted average salary increased from $32,711 in March 1998 to $59,196 in September 2016. During this time, the number of employees in Iowa for local and state government increased from 155,000 to 174,000 and 61,000 to 66,000 persons, respectively.
Follow the same configuration procedure as shown above. Calculate the compensation per employee value,by dividing the average total compensation for employees (emps) by the number of employees (empl).
The underlying formula is shown here:
value = (value('comp')/(value('emps')+value('empl')))==0 ? null : (value('comp')/(value('emps')+value('empl')))
Consumer Price Index Dataset
Adjust income data for inflation with the Consumer Price Index (CPI).
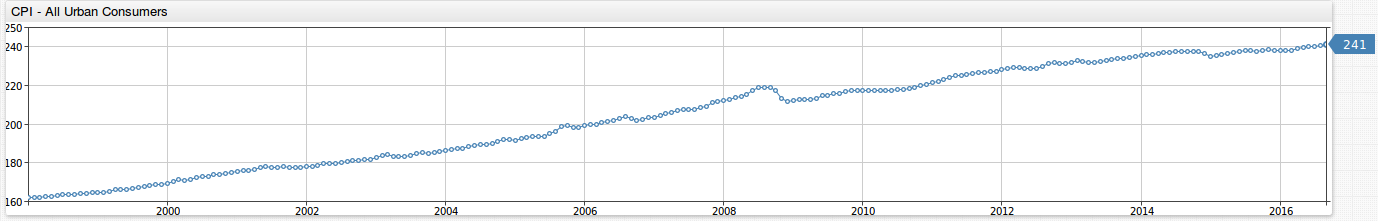
CPI is a measure of the average change over time in the prices paid by urban consumers for a market basket of goods and services. This market basket includes a wide variety of consumer items such as chicken, bedroom furniture, jewelry, eyeglasses, college tuition, tobacco, and many more items. Use CPI to index the real value of average employee salaries change over time using current dollars.
Calculate adjusted dollar value by multiplying unadjusted value and the current CPI, divided by the CPI at any specified time period to project that amount in current dollars. In other words, the rate of change for CPI creates a simple conversion factor for comparing dollar value through time using the amount of goods the same dollar can buy.
Download the CPI dataset from the Bureau of Labor Statistics. Data is available in XLSX format.
Create a Collector job to download the tabular data from the Bureau of Labor Statistics file format and then upload the data into ATSD. Because the file format is nonstandard, configure ATSD to properly upload the data via CSV Parser.
Download the required job and parser configuration.
Add the newly inserted data to the configuration.
Adjust compensation per employee to account for inflation.
The image below displays the required configuration. The key difference between this and earlier portals, is that each series now includes the CPI multiplier.
The portal contains three series:
- Federal government head count and total compensation (not displayed).
- Federal government compensation per employee (derived).
- CPI: all urban customers (raw).
- Federal government compensation per employee, inflation adjusted in current dollars (derived).
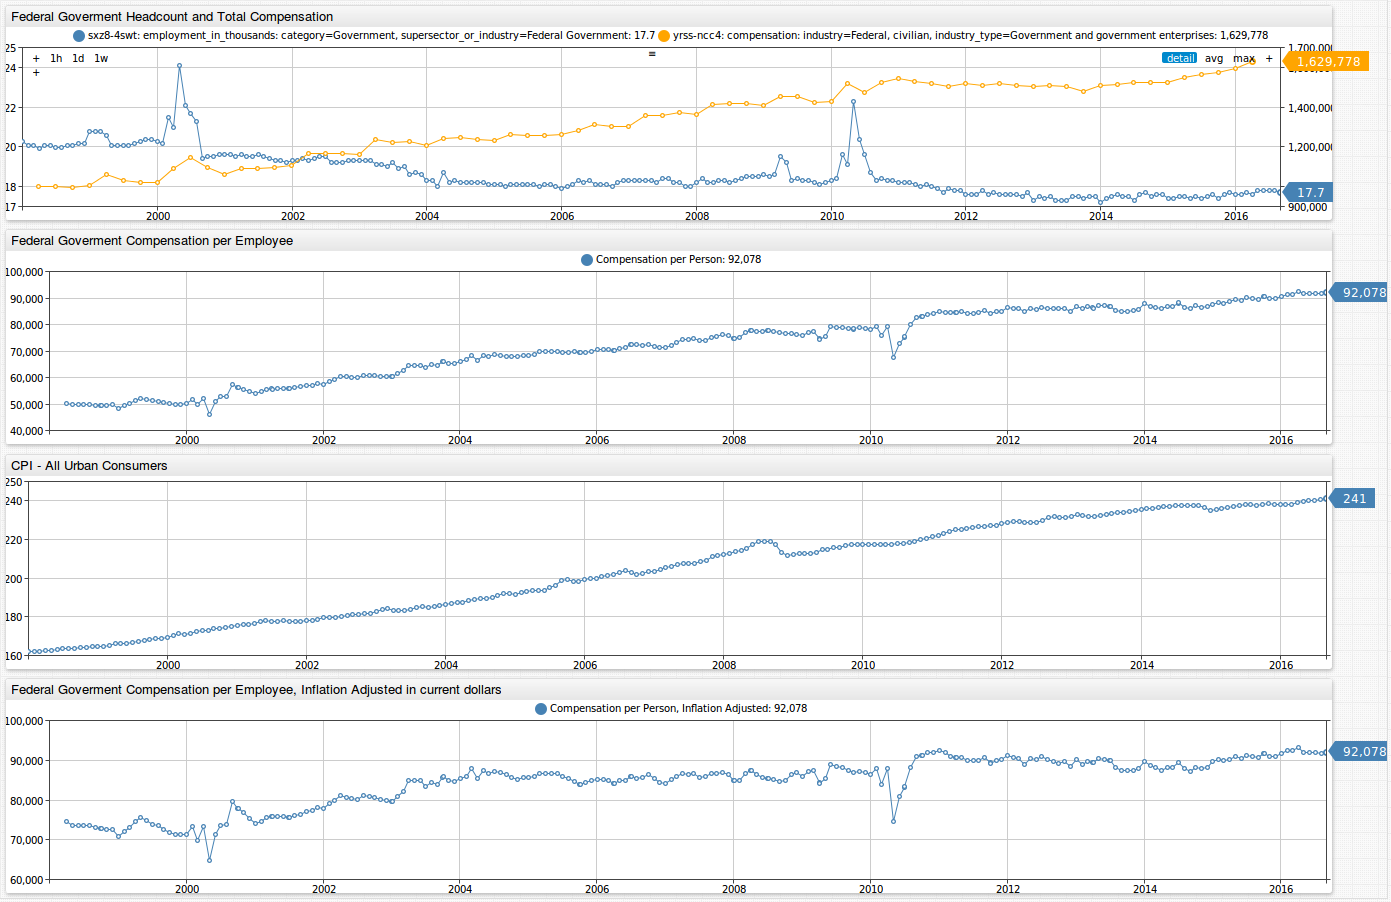
Below is a screenshot of the complete portal for the local and state government dataset.
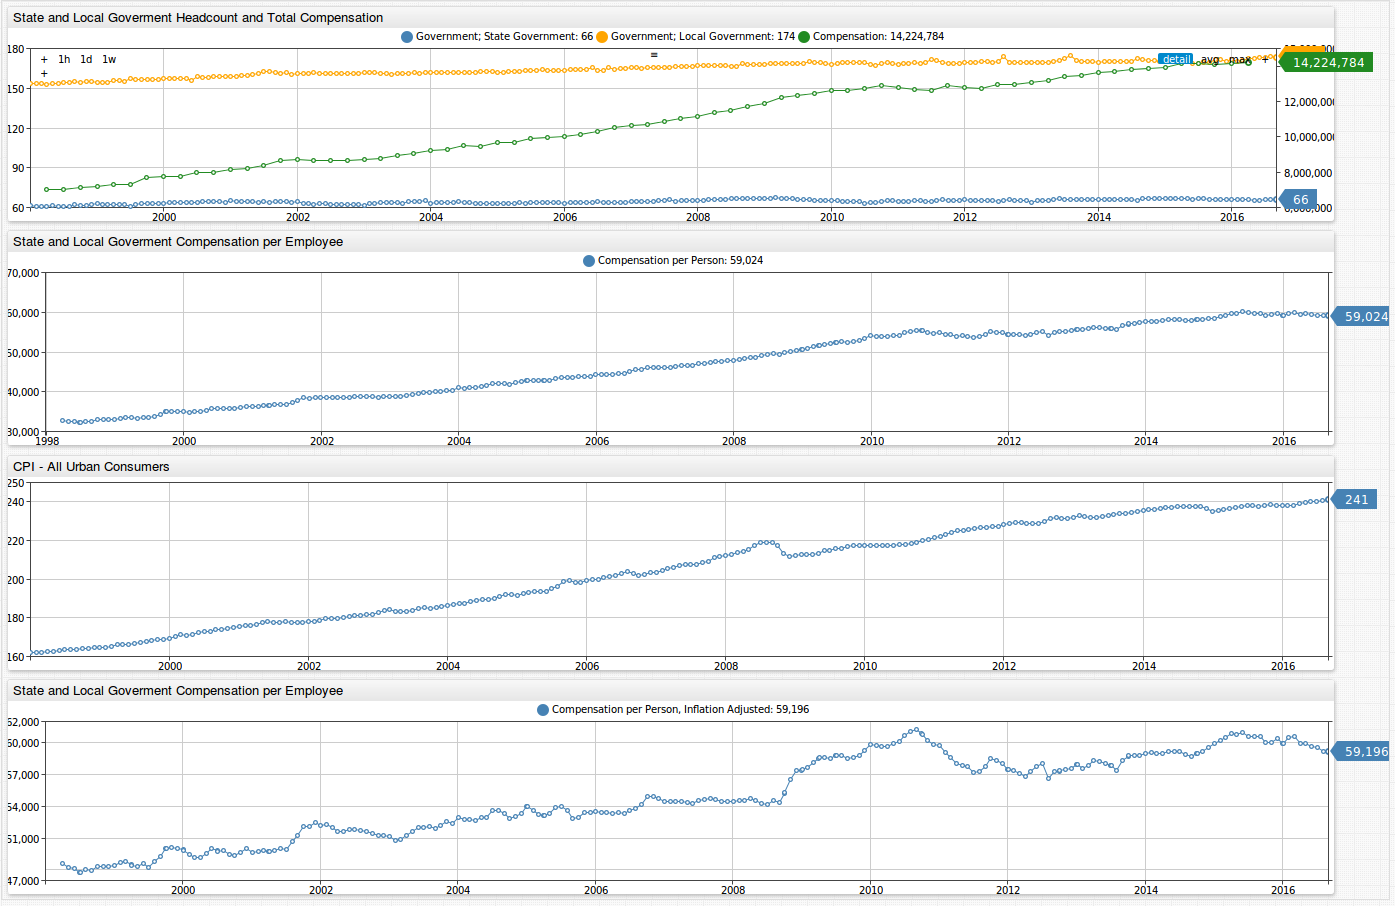
With adjusted compensation per employee values derived series, meaningful conclusions can be made by the economically minded observer. The ability of ATSD to easily combine multiple datasets, regardless of standard or non-standard formats, into one visualization makes comparing employee average compensation simple and straightforward and provides outputs that are easy to interpret.
Action Items
See ATSD Documentation for installation instructions.
For more information about ATSD Chart services, see the Charts Documentation.
See the ChartLab Introduction for more information about ChartLab functionality.
Raise an issue in the Axibase GitHub repository for assistance.