First Quarter Expatriation Shows Marked Decrease After Post-Election Turmoil

Introduction
The Internal Revenue Service (IRS) of the United States releases quarterly reports tracking the number of expatriated citizens processed in the previous three-month period. The reports are announced via the Federal Register which is the primary publication medium of the federal government and used by a number of agencies as an outreach arm to the public.
Ostensibly, the tax bureau maintains these records instead of Citizenship and Immigration Services (CIS) because the IRS uses that information to adjudicate decisions regarding those expatriating citizens upon whom the Expatriation Tax is levied.
An expatriate must meet any one of the following criteria to be liable for the eponymous tax:
- Average annual net income tax for the five years ending before the date of expatriation or termination of residency is more than a specified amount that is adjusted for inflation ($151,000 for 2012, $155,000 for 2013, $157,000 for 2014, and $160,000 for 2015).
- Net worth is $2 million or more on the date of expatriation or termination of residency.
- Failure to certify on
Form 8854that the citizen has complied with all U.S. federal tax obligations for the five years preceding the date of expatriation or termination of residency.
IRS Form 8854 available at is a statement which confirms that up to the date of your expatriation, you have complied with United States Federal Tax Code to the letter of the law. Failing to correctly complete this document means that you are obligated to pay the Expatriation Tax, even if you do not meet either of the previous criteria.
Previous articles tracking United States expatriation:
Expatriation Review
Axibase tracked record-high expatriation during 2017; in the fourth quarter of last year however, it seemed that expatriation levels had begun to normalize once again. Naturally, the number of expatriating citizens is far lower than the amount of number of new citizens due to naturalization, but the trend remains interesting nonetheless. This trend has been noted by such publications as the Washington Post as far back as early 2017, when Axibase published the first article citing the trend.
Latest Data
The underlying IRS report contains the names of the individuals who expatriated in the first quarter of 2018.
Support for date aggregations in ATSD SQL syntax allows reporting on both the annual and quarterly basis.
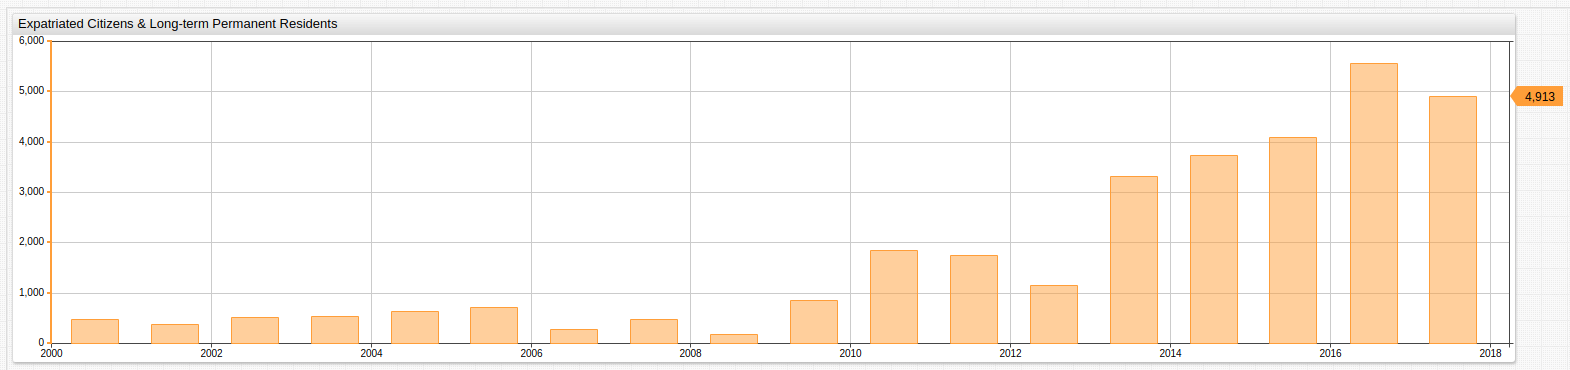
Annual Data
SELECT date_format(time+365*24*60*60000, 'yyyy') AS "Year",
  count(value) AS "Year Total",
  count(value)-lag(count(value)) AS "Y-o-Y Change",
  100*(count(value)-lag(count(value)))/lag(count(value)) AS "Y-o-Y Change, %"
FROM "us-expatriate-counter"
  WHERE entity = 'us.irs' AND datetime <= '2018-03-31T00:00:00Z'
GROUP BY period(1 YEAR, END_TIME)
  ORDER BY period(1 YEAR, END_TIME)
| Year | Year Total | Y-o-Y Change | Y-o-Y Change, % |
|------|------------|--------------|-----------------|
| 2000 | 184        | null         | null            |
| 2001 | 470        | 286          | 155             |
| 2002 | 373        | -97          | -21             |
| 2003 | 507        | 134          | 36              |
| 2004 | 545        | 38           | 7               |
| 2005 | 645        | 100          | 18              |
| 2006 | 724        | 79           | 12              |
| 2007 | 285        | -439         | -61             |
| 2008 | 485        | 200          | 70              |
| 2009 | 174        | -311         | -64             |
| 2010 | 853        | 679          | 390             |
| 2011 | 1850       | 997          | 117             |
| 2012 | 1742       | -108         | -6              |
| 2013 | 1151       | -591         | -34             |
| 2014 | 3319       | 2168         | 188             |
| 2015 | 3743       | 424          | 13              |
| 2016 | 4096       | 353          | 9               |
| 2017 | 5557       | 1461         | 36              |
| 2018 | 4913       | -644         | -12             |
ChartLab is a visualization service which can display ATSD data as charts. ChartLab features a wide range of widgets, created using a declarative syntax.

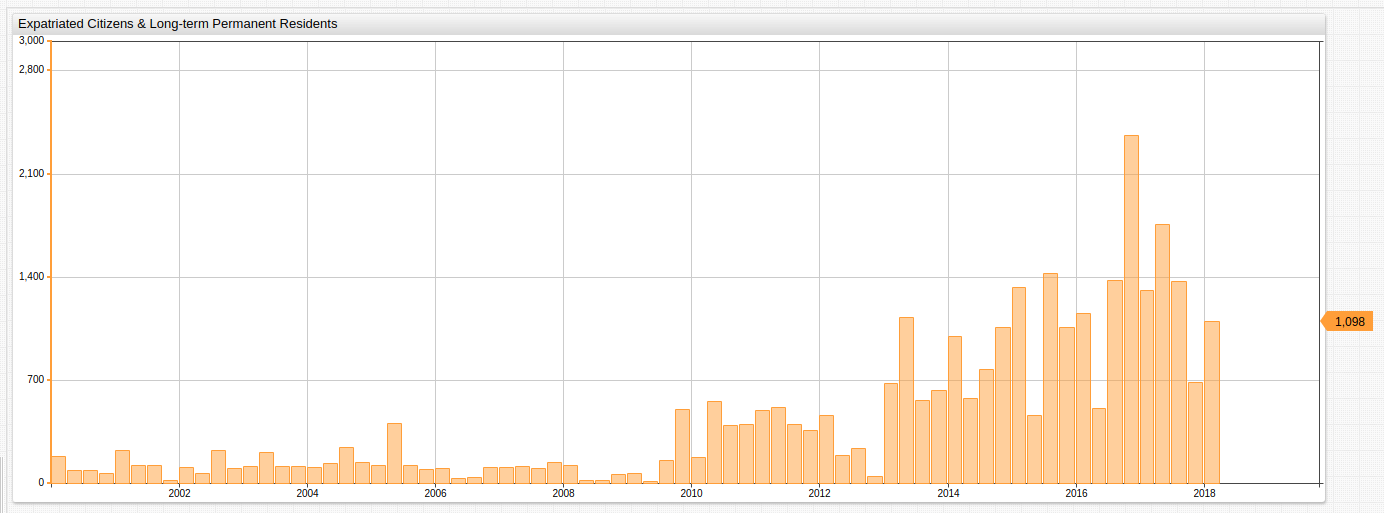
Quarterly Data
SELECT CEIL(CAST(date_format(time, 'M') AS NUMBER)/3) AS "Quarter", date_format(time, 'yyyy') AS "Year",
  count(value) AS "Quarter Total"
FROM "us-expatriate-counter"
  WHERE entity = 'us.irs' AND date_format(time, 'yyyy-MM') >= '2014-01' AND datetime <= now
GROUP BY period(1 QUARTER)
  ORDER BY period(1 QUARTER)
| Quarter | Year | Quarter Total |
|---------|------|---------------|
| 1       | 2013 | 679           |
| 2       | 2013 | 1129          |
| 3       | 2013 | 560           |
| 4       | 2013 | 631           |
| 1       | 2014 | 999           |
| 2       | 2014 | 576           |
| 3       | 2014 | 775           |
| 4       | 2014 | 1061          |
| 1       | 2015 | 1331          |
| 2       | 2015 | 459           |
| 3       | 2015 | 1426          |
| 4       | 2015 | 1057          |
| 1       | 2016 | 1154          |
| 2       | 2016 | 506           |
| 3       | 2016 | 1379          |
| 4       | 2016 | 2359          |
| 1       | 2017 | 1313          |
| 2       | 2017 | 1756          |
| 3       | 2017 | 1374          |
| 4       | 2017 | 685           |
| 1       | 2018 | 1098          |
Although lower than 2017 Q1, 2018 Q1 data is on the order of recent, record-setting years for expatriation numbers.
Using ChartLab for data visualization of the quarterly samples:
On-Loading Expatriation Data
The data published by the Federal Register requires an intermediate ETL step to be available for analysis. This extraction-transformation-loading procedure is implemented by a web crawler built specifically for the task of tracking Federal Register publications for new expatriation data releases.
The Web Crawler operates according to this workflow:
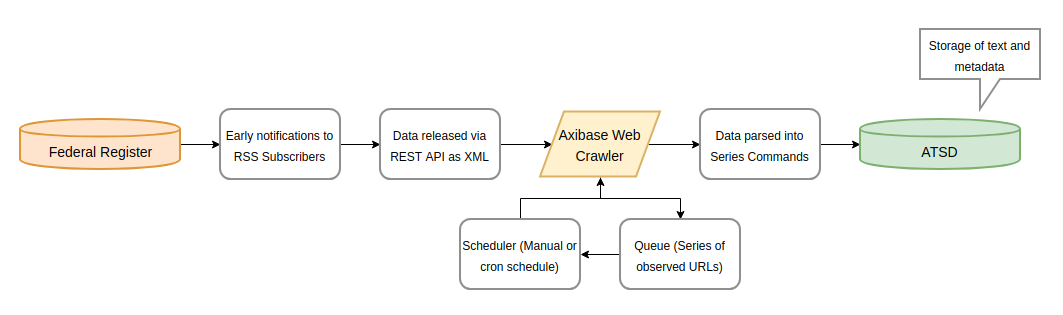
The Web Crawler reads incoming data from the Federal Register and parses it into series commands, readable by ATSD, the database which hosts all the data used in this article and supports the background operations of SQL Console. A series command template is shown below:
series d:{iso-date} e:{entity} t:{tag-1}={val-1} m:{metric-1}={number}
In the case of expatriation data here, the entity is the publishing body, us.irs and the metric is us-expatriate-counter.
SQL result set with raw data output no grouping:
SELECT datetime, tags.first_name, tags.middle_name, tags.last_name
  FROM "us-expatriate-counter"
WHERE entity = 'us.irs'
  ORDER BY datetime DESC
LIMIT 10
| datetime              | tags.first_name  | tags.middle_name  | tags.last_name |
|-----------------------|------------------|-------------------|----------------|
| 2018-03-31T00:00:00Z  | DARSHAM          | EVA               | VOOGT          |
| 2018-03-31T00:00:00Z  | MAX-DOMINIC      | GRAFBEISSEL       | VONGYMNICH     |
| 2018-03-31T00:00:00Z  | JORRIT           | FRISCO            | VANDERVEEN     |
| 2018-03-31T00:00:00Z  | HATTAN           | KHALED            | UJAIMI         |
| 2018-03-31T00:00:00Z  | KANAE            | -                 | TSURUGA        |
| 2018-03-31T00:00:00Z  | ELTJE            | FREDERIKA         | TOLLENAAR      |
| 2018-03-31T00:00:00Z  | GUYSLAINE        | AIMEE             | THALMANN       |
| 2018-03-31T00:00:00Z  | ZHENGPING        | -                 | TAN            |
| 2018-03-31T00:00:00Z  | MOTOKI           | -                 | TAKAHASHI      |
| 2018-03-31T00:00:00Z  | AASIYA           | -                 | TAHIR          |
Additional Visualizations
time_offset
Data may also be compared using time_offset features whereby variable time-offsets may be applied to a dataset which may be compared to itself during a different time period, useful when working with time series data.
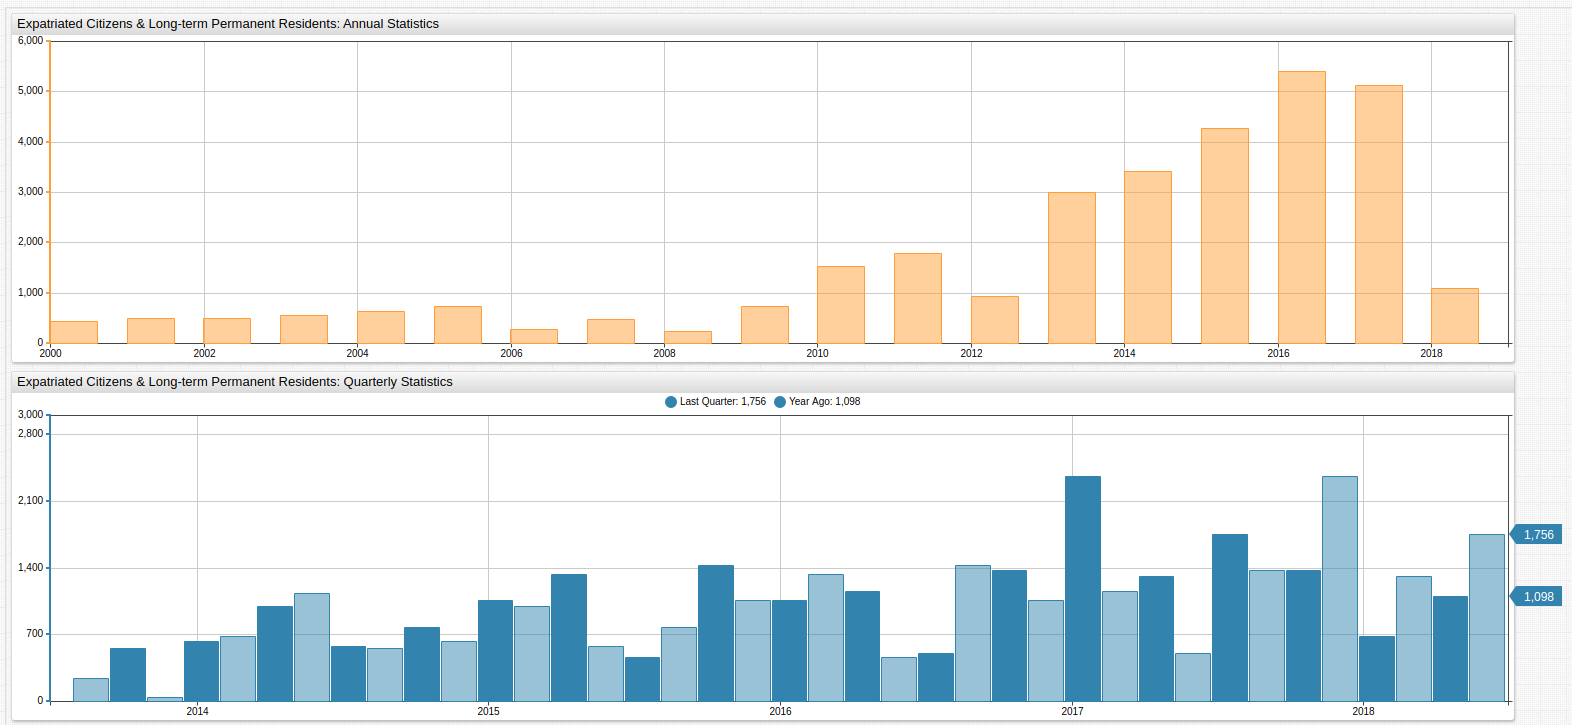
Additionally, a SUM value function may be applied to aggregate quarterly samples into annual totals for the defined period.
period = 1 year
statistics = SUM
time-offset = 1 year
fred.PercentChangeFromYearAgo
A number of built-in statistical functions are already supported by ChartLab, and user-defined functions may be added to a local ATSD instance. You can follow these instructions to upload a user-defined function as a JavaScript file.
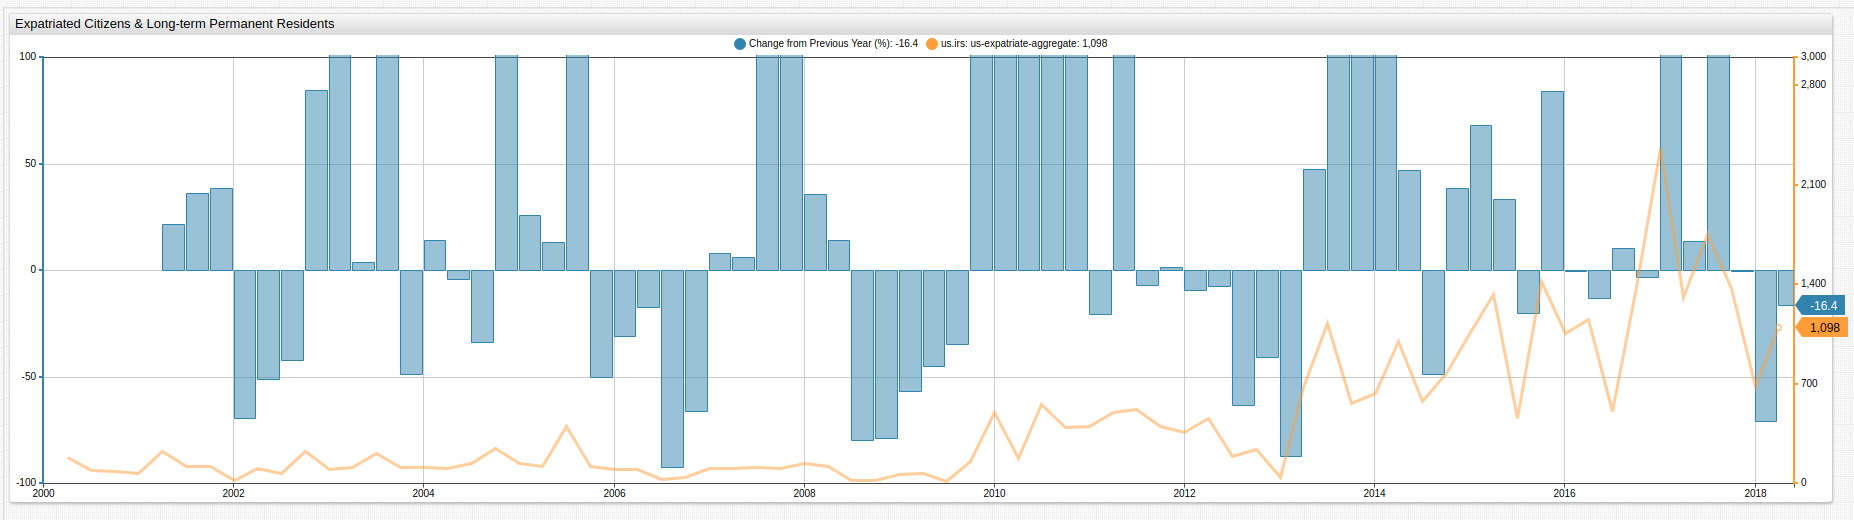
Visualization uses the PercentChangeFromYearAgo user-defined function. While the absolute value of U.S. expatriates is greatest during 2016-2017, the greatest relative change is observed several years ago.
While the underlying function may be quite verbose:
value = var v = value('cpi'); var p = value('prev_cpi'); if(p!=null && v!=null) return (v / p - 1) * 100
The syntax required in the ChartLab configuration is simple:
value = fred.PercentChangeFromYearAgo('raw')
View the complete
fred.jsUDF library here.
Highlights
The charts library support alert-expression settings to display quarters where the percent change from the previous year is greater than 50% in red, and quarters where it is less than -10% in green.
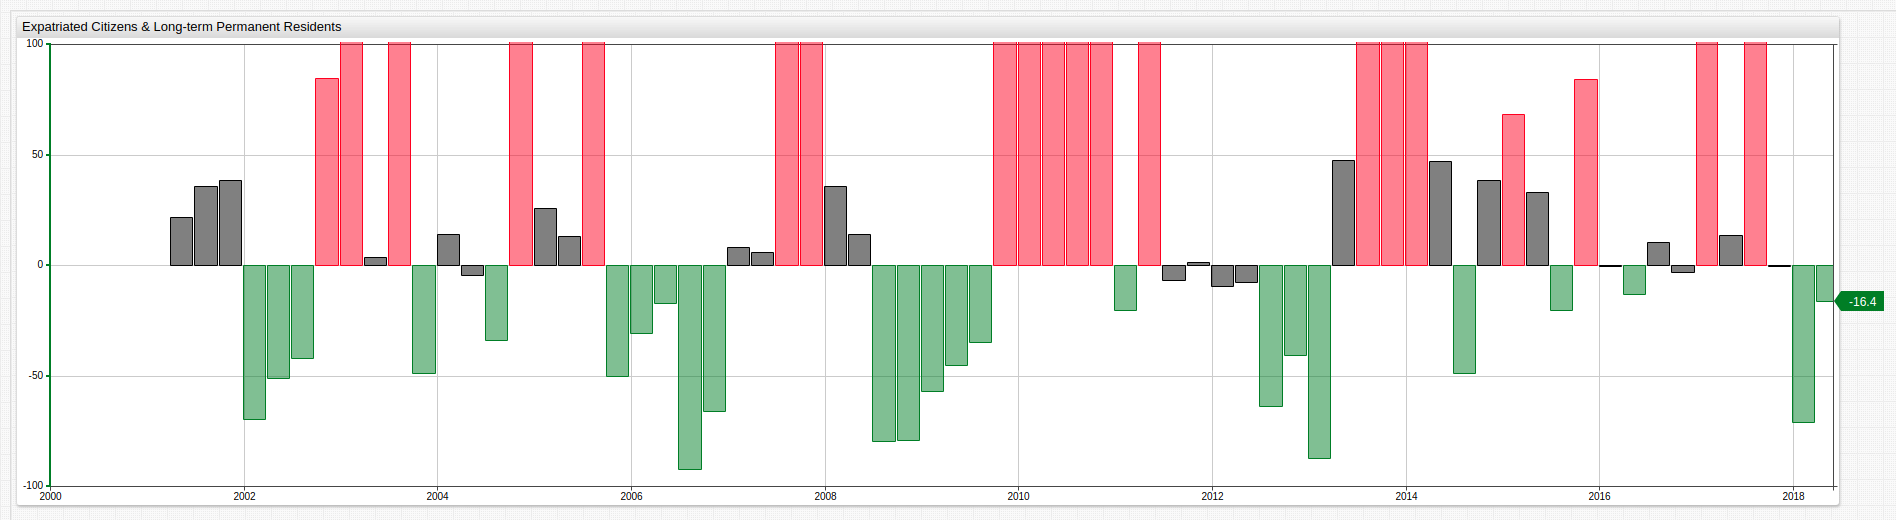
The syntax for the alert-expression above is shown here:
alert-expression = value > 50 ? 4000 : value < -10 ? -100 : 0
alert-style = if (alert > 50) return 'color:red'
alert-style = if (alert < -10) return 'color:green'
When using a two-parameter alert-expression, three arguments are needed: an upper bound, lower bound, and median value separated by : delimiter.
For more information about ChartLab syntax or to explore other features which may be used in the example above, see the complete ChartLab documentation.