MatLab
- Prerequisites
- Configure Database Connection
- Verify Connection
- Review Tables in the Database Explorer
- Load Data
- Write Data
- Calculate Derived Series
Prerequisites
Install MatLab
- Install MatLab
R2017bwith Database Toolbox
Load Sample Data
To complete this exercise, sample data must be available in your ATSD instance.
- Log into the ATSD web interface
- Open Metrics > Data Entry, open the Commands tab.
- Copy the
seriescommands into the form and click Submit.
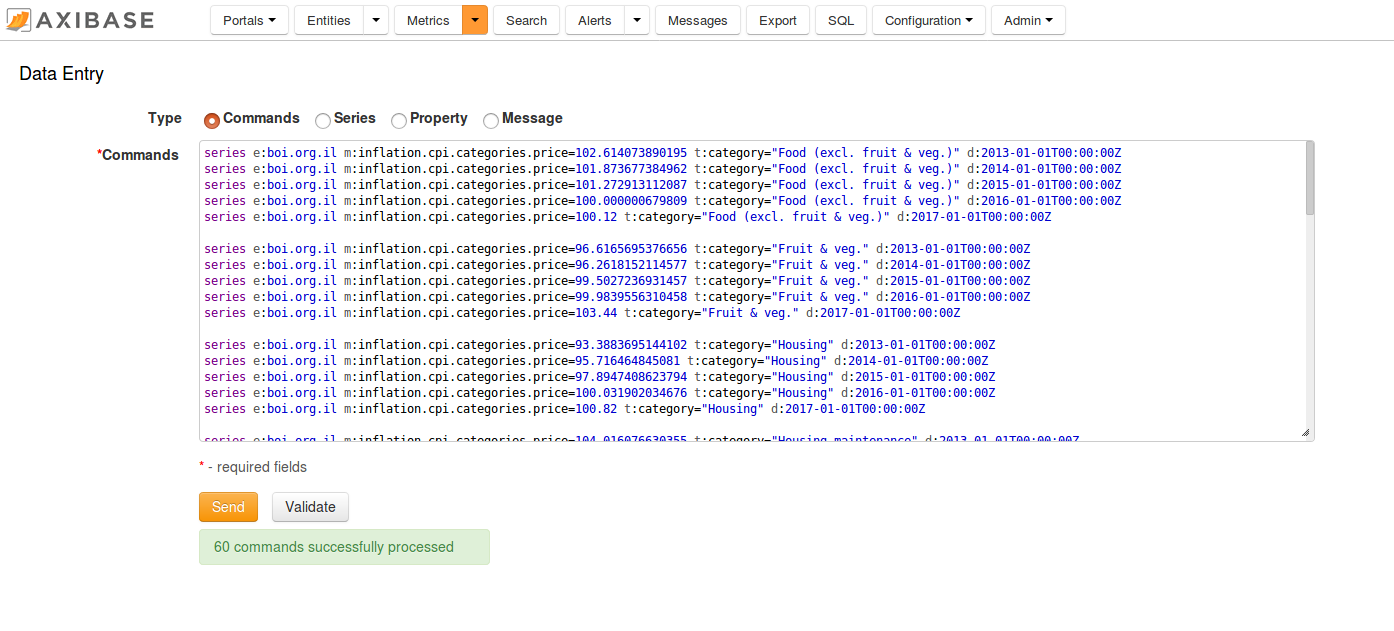
The commands contain the Consumer Price Index (CPI) for each category of items in a consumer basket as well as a weight for each category in the CPI basket. The weights are stored as fractions of 1000. The CPI is tracked from 2013 to 2017 and uses Year 2016 values as the baseline. Weight values are available only for 2017. The underlying data is available in the following Excel file.
To calculate a weighted inflation index we need to multiply the CPI of each category by its weight divided by 1000 and sum the products.
Install ATSD Driver
Download the ATSD JDBC driver with dependencies.
There are two ways of enabling the ATSD JDBC driver in MatLab: static and dynamic
Static
- Run the
prefdircommand in the MatLab Command Window. This command displays the path to a directory used in subsequent steps.

- Close MatLab if the application is running.
- Change to the
prefdirdirectory above and create a file namedjavaclasspath.txt. - Open the
javaclasspath.txtfile. Add the full path to the ATSD driver JAR file, for example,/home/user/MATLAB/atsd-jdbc-1.2.22-DEPS.jar - Save and close
javaclasspath.txt. - Restart MatLab.
Dynamic
- Run the
javaaddpath('dpath')command in the MatLab Command Window, wheredpathis the full path to the ATSD driver JAR file.
Example:

Configure Database Connection
Connect in Database Explorer
- Apps > Database Explorer
- Open Configure Data Source > Configure JDBC Data Source
- Select Vendor > OTHER.
- Set the Driver field to
com.axibase.tsd.driver.jdbc.AtsdDriver - Specify a JDBC URL, for example
jdbc:atsd://atsd_hostname:8443;expandTags=trueInformation about ATSD JDBC URL parameters - Click Test, specify ATSD login and password
- If connection is successful click Save and close JDBC Data Source Configuration window
Example:

atsd_hostname is the hostname address of the ATSD instance you want to connect to.
Connect to the MatLab Command Window
Example of HTTPS connection to ATSD:
driver = 'com.axibase.tsd.driver.jdbc.AtsdDriver';
url = 'jdbc:atsd://atsd_hostname:8443';
username = 'USERNAME';
password = 'PASSWORD';
conn_atsd = database('', username, password, driver, url);
Verify Connection
ATSD connection to Command Window can be verified using the SELECT 1 query.
Assuming conn_atsd is defined:
sqlquery = 'SELECT 1';
curs = exec(conn_atsd, sqlquery);
res = fetch(curs);
data = res.Data
Expected result:

Review Tables in the Database Explorer
- Specify a JDBC URL, for example
jdbc:atsd://atsd_hostname:8443;tables=%jvm%in the JDBC Data Source Configuration window. - Click New Query, select ATSD in the Data Source drop-down list, enter ATSD username and password.
The Database Browser displays a set of tables matching the expression:

Select one or more columns to open the Data Preview window displaying the first N rows of the result set (10 by default).
An example with the datetime, value, and text fields selected:

The complete result set can be imported with the Import button, highlighted with a green arrow.
Load Data
Execute the SQL query to import the result set into a MatLab variable:
sqlquery = "SELECT * FROM gc_time_percent LIMIT 50";
curs = exec(conn_atsd, sqlquery);
res = fetch(curs);
data = res.Data;
Write Data
data example:

To insert data into ATSD (assuming the data variable has required values):
colnames = {'datetime', 'entity', 'value'};
insert(conn_atsd, 'METRIC_NAME', colnames, data);
colnames is a cell array which describes the names and order of columns in the request.
METRIC_NAME is the name of a metric under which the rows in data are inserted.
Calculate Derived Series
Connect to ATSD
driver = 'com.axibase.tsd.driver.jdbc.AtsdDriver';
url = 'jdbc:atsd://atsd_hostname:8443';
username = 'USERNAME';
password = 'PASSWORD';
conn_atsd = database('', username, password, driver, url);
Load pricing data
Load pricing data into the variable prices
% SQL query to get prices for a date range
sqlquery = "SELECT datetime, tags.category, value FROM inflation.cpi.categories.price WHERE datetime BETWEEN '2013-01-01T00:00:00Z' AND '2017-01-01T00:00:00Z' ORDER BY 1, 2";
% get cursor from ATSD
curs = exec(conn_atsd, sqlquery);
% fetch data from cursor
res = fetch(curs);
% initialize result set from data as cell array
prices_resultset = res.Data;

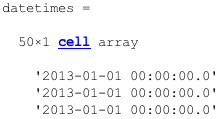
% fetch datetime column
datetimes = prices_resultset(:,1);
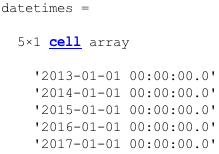
% get every 10th record from datetimes to form list of years
datetimes = datetimes(1:10:length(datetimes));
% fetch third column from prices result set (value field)
% convert column to numeric array
prices = cell2mat(prices_resultset(:,3));

Load weights data
Load weights data into the variable weights
% SQL query to get weights
sqlquery = "SELECT tags.category, value FROM inflation.cpi.categories.weight WHERE datetime = '2017-01-01T00:00:00Z' ORDER BY 1";
% get cursor from ATSD
curs = exec(conn_atsd, sqlquery);
% fetch data from cursor
res = fetch(curs);
% initialize weights result set from data as cell array
weights_resultset = res.Data;
% fetch second column from weights result set (value field)
% convert column to numeric array
weights = cell2mat(weights_resultset(:,2));
% repeat weights column for 2017 values (5,1 means that resulting matrix increases in height 5 times)
weights = repmat(weights, 5, 1);

Calculate Weighted Index
% element-wise multiply of 2 columns (1000 value is here because weights is a proportion out of 1000)
inflation_cpi_price = prices .* weights / 1000;

% sum inflation prices for each year
inflation_cpi_composite_price = sum(reshape(inflation_cpi_price, 10, 5));
% transponse vector (transform row to column)
inflation_cpi_composite_price = inflation_cpi_composite_price';

Create cell-matrix to insert into ATSD
% form list of entities for result payload
entity = 'bls.gov';
entities = repmat(cellstr(entity), size(datetimes, 1), 1);

% append Entity, Datetime and Inflation columns
payload = [entities, datetimes, num2cell(inflation_cpi_composite_price)];
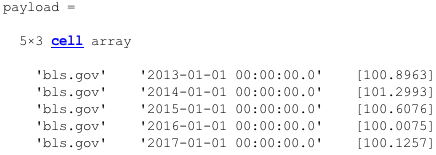
% define colnames which is a cell array describing names and order of columns in payload
colnames = {'entity', 'datetime', 'value'};
% insert data into ATSD
insert(conn_atsd, 'inflation.cpi.composite.price', colnames, payload);
MatLab script file
- Link to file that contains transformation steps.
Reference
MATLAB functions: